Posts filed under General (3152)

September 25, 2018

NRL Predictions for the Grand Final

Team Ratings for the Grand Final

The basic method is described on my Department home page.
Here are the team ratings prior to this week’s games, along with the ratings at the start of the season.

Current Rating Rating at Season Start Difference
Storm 8.13 16.73 -8.60
Roosters 7.37 0.13 7.20
Sharks 4.08 2.20 1.90
Rabbitohs 3.73 -3.90 7.60
Broncos 2.73 4.78 -2.10
Raiders 1.85 3.50 -1.70
Panthers 0.87 2.64 -1.80
Cowboys 0.13 2.97 -2.80
Dragons -0.06 -0.45 0.40
Warriors -0.74 -6.97 6.20
Bulldogs -0.82 -3.43 2.60
Titans -4.06 -8.91 4.90
Wests Tigers -5.43 -3.63 -1.80
Sea Eagles -5.47 -1.07 -4.40
Eels -5.98 1.51 -7.50
Knights -8.66 -8.43 -0.20


Performance So Far

So far there have been 200 matches played, 126 of which were correctly predicted, a success rate of 63%.
Here are the predictions for last week’s games.

Game Date Score Prediction Correct
1 Storm vs. Sharks Sep 21 22 – 6 2.10 TRUE
2 Roosters vs. Rabbitohs Sep 22 12 – 4 2.90 TRUE


Predictions for the Grand Final

Here are the predictions for the Grand Final. The prediction is my estimated expected points difference with a positive margin being a win to the home team, and a negative margin a win to the away team.

Game Date Winner Prediction
1 Roosters vs. Storm Sep 30 Roosters 2.20


Mitre 10 Cup Predictions for Round 7

Team Ratings for Round 7

The basic method is described on my Department home page.
Here are the team ratings prior to this week’s games, along with the ratings at the start of the season.

Current Rating Rating at Season Start Difference
Wellington 15.79 12.18 3.60
Canterbury 13.13 15.32 -2.20
Auckland 5.93 -0.50 6.40
Waikato 4.45 -3.24 7.70
Tasman 4.45 2.62 1.80
North Harbour 4.23 6.42 -2.20
Taranaki 0.13 6.58 -6.40
Otago -0.65 0.33 -1.00
Northland -1.84 -3.45 1.60
Bay of Plenty -2.20 0.27 -2.50
Counties Manukau -2.30 1.84 -4.10
Hawke’s Bay -10.06 -13.00 2.90
Manawatu -10.67 -4.36 -6.30
Southland -22.57 -23.17 0.60


Performance So Far

So far there have been 46 matches played, 33 of which were correctly predicted, a success rate of 71.7%.
Here are the predictions for last week’s games.

Game Date Score Prediction Correct
1 Manawatu vs. Tasman Sep 19 19 – 29 -9.90 TRUE
2 Northland vs. Southland Sep 20 26 – 10 26.70 TRUE
3 Bay of Plenty vs. Waikato Sep 21 21 – 54 4.00 FALSE
4 Hawke’s Bay vs. North Harbour Sep 22 34 – 51 -8.80 TRUE
5 Otago vs. Canterbury Sep 22 25 – 47 -7.10 TRUE
6 Taranaki vs. Auckland Sep 22 30 – 31 -2.00 TRUE
7 Tasman vs. Counties Manukau Sep 23 21 – 19 12.70 TRUE
8 Manawatu vs. Wellington Sep 23 7 – 49 -18.20 TRUE


Predictions for Round 7

Here are the predictions for Round 7. The prediction is my estimated expected points difference with a positive margin being a win to the home team, and a negative margin a win to the away team.

Game Date Winner Prediction
1 Hawke’s Bay vs. Northland Sep 26 Northland -4.20
2 Bay of Plenty vs. Manawatu Sep 27 Bay of Plenty 12.50
3 Auckland vs. Otago Sep 28 Auckland 10.60
4 Waikato vs. Southland Sep 29 Waikato 31.00
5 Taranaki vs. North Harbour Sep 29 North Harbour -0.10
6 Wellington vs. Tasman Sep 29 Wellington 15.30
7 Canterbury vs. Hawke’s Bay Sep 30 Canterbury 27.20
8 Counties Manukau vs. Northland Sep 30 Counties Manukau 3.50


Currie Cup Predictions for Round 7

Team Ratings for Round 7

The basic method is described on my Department home page.
Here are the team ratings prior to this week’s games, along with the ratings at the start of the season.

Note that Cheetahs2 refers the Cheetahs team when there is a Pro14 match. The assumption is that the team playing in the Pro14 is the top team and the Currie Cup team is essentially a second team.


Current Rating Rating at Season Start Difference
Western Province 7.31 4.66 2.60
Sharks 4.13 4.18 -0.10
Lions 2.27 3.23 -1.00
Cheetahs 2.23 3.86 -1.60
Blue Bulls 0.52 0.94 -0.40
Pumas -7.64 -8.36 0.70
Griquas -10.39 -9.78 -0.60
Cheetahs2 -29.69 -30.00 0.30


Performance So Far

So far there have been 17 matches played, 14 of which were correctly predicted, a success rate of 82.4%.
Here are the predictions for last week’s games.


Game Date Score Prediction Correct
1 Cheetahs2 vs. Pumas Sep 22 14 – 42 -16.70 TRUE
2 Sharks vs. Lions Sep 22 37 – 21 5.50 TRUE
3 Western Province vs. Griquas Sep 22 38 – 12 21.50 TRUE


Predictions for Round 7

Here are the predictions for Round 7. The prediction is my estimated expected points difference with a positive margin being a win to the home team, and a negative margin a win to the away team.


Game Date Winner Prediction
1 Western Province vs. Sharks Sep 29 Western Province 7.70


September 24, 2018

And while we’re talking about Lotto …

Our very own Liza Bolton was summoned to TV show The Project last week to reveal how to minimise the chance of sharing a First Division Lotto win with heaps of other people.

The invite came after last Wednesday’s Lotto draw, where 40 people shared the first division prize, getting only $25,000 each rather than something with  one or two extra zeroes.

Liza had 90 seconds to share her top five tips – the first one is on the image.

Watch the clip here.

September 21, 2018

Lotto: no, you’re still not going to win

There’s a story about Lotto on Stuff that starts off promisingly

Forty Kiwis took out Lotto First Division on Wednesday night – the most first division winners in a single draw in the game’s 30-year-history.

With that many winners sharing the $1 million prize, they’re only getting $25,000 each.

This is one of the big reasons that you can’t just divide the prize by number of possible combinations and get the expected value of a ticket.

Further down, though we get this

Despite these overwhelming odds there are times when it makes mathematical sense to buy a Lotto ticket.

That’s when Powerball jackpots get so large the value of the prize pool is greater than the amount spent on tickets.

Technically, this is true. The problem is you don’t know the amount spent on the tickets, because NZ Lotto doesn’t tell anyone. So as a strategy, it’s useless.  The link goes to another story headlined Why professors of statistics play Lotto too, when the prize is big enough.  That surprised me, so I read on to see who these professors of statistics were.

There are two professors mentioned in the story, Martin Hazelton of Massey and Peter Donelan of the university currently known as Vic.  You should definitely pay attention to their opinions: Martin, in particular, is probably the country’s top statistical theorist.

They don’t, however, say they “play Lotto too, when the prize is big enough”.  Professor Hazelton doesn’t say anything on that issue. Professor Donelan is quoted right at the end of the story

“In my household, if it was up to me, I wouldn’t bother to buy one,” Donelan said.

But he suspects some stats professors do: “I expect some do regardless of what they know.”

And that’s probably true. Nothing wrong with Lotto as an entertainment — the monetary return on investment is low, but the same is true for beer, movies, rugby, or twilight walks on the beach — but it will very rarely “make mathematical sense.”


September 18, 2018

NRL Predictions for the Preliminary Finals

Team Ratings for the Preliminary Finals

The basic method is described on my Department home page.
Here are the team ratings prior to this week’s games, along with the ratings at the start of the season.

Current Rating Rating at Season Start Difference
Storm 7.16 16.73 -9.60
Roosters 7.01 0.13 6.90
Sharks 5.05 2.20 2.80
Rabbitohs 4.09 -3.90 8.00
Broncos 2.73 4.78 -2.10
Raiders 1.85 3.50 -1.70
Panthers 0.87 2.64 -1.80
Cowboys 0.13 2.97 -2.80
Dragons -0.06 -0.45 0.40
Warriors -0.74 -6.97 6.20
Bulldogs -0.82 -3.43 2.60
Titans -4.06 -8.91 4.90
Wests Tigers -5.43 -3.63 -1.80
Sea Eagles -5.47 -1.07 -4.40
Eels -5.98 1.51 -7.50
Knights -8.66 -8.43 -0.20


Performance So Far

So far there have been 198 matches played, 124 of which were correctly predicted, a success rate of 62.6%.
Here are the predictions for last week’s games.

Game Date Score Prediction Correct
1 Sharks vs. Panthers Sep 14 21 – 20 4.70 TRUE
2 Rabbitohs vs. Dragons Sep 15 13 – 12 4.70 TRUE


Predictions for the Preliminary Finals

Here are the predictions for the Preliminary Finals. The prediction is my estimated expected points difference with a positive margin being a win to the home team, and a negative margin a win to the away team.

Game Date Winner Prediction
1 Storm vs. Sharks Sep 21 Storm 2.10
2 Roosters vs. Rabbitohs Sep 22 Roosters 2.90


Mitre 10 Cup Predictions for Round 6

Team Ratings for Round 6

The basic method is described on my Department home page.
Here are the team ratings prior to this week’s games, along with the ratings at the start of the season.

Current Rating Rating at Season Start Difference
Wellington 13.65 12.18 1.50
Canterbury 11.79 15.32 -3.50
Auckland 6.02 -0.50 6.50
Tasman 5.40 2.62 2.80
North Harbour 3.49 6.42 -2.90
Waikato 2.92 -3.24 6.20
Bay of Plenty 1.13 0.27 0.90
Otago 0.69 0.33 0.40
Taranaki 0.05 6.58 -6.50
Northland -0.88 -3.45 2.60
Counties Manukau -3.26 1.84 -5.10
Manawatu -8.52 -4.36 -4.20
Hawke’s Bay -11.12 -13.00 1.90
Southland -23.53 -23.17 -0.40


Performance So Far

So far there have been 38 matches played, 26 of which were correctly predicted, a success rate of 68.4%.
Here are the predictions for last week’s games.

Game Date Score Prediction Correct
1 North Harbour vs. Canterbury Sep 12 21 – 31 -5.80 TRUE
2 Waikato vs. Hawke’s Bay Sep 13 42 – 2 13.20 TRUE
3 Northland vs. Manawatu Sep 14 49 – 19 7.60 TRUE
4 Tasman vs. Taranaki Sep 14 53 – 17 3.50 TRUE
5 Counties Manukau vs. Wellington Sep 15 12 – 53 -6.70 TRUE
6 Southland vs. Otago Sep 15 24 – 43 -20.50 TRUE
7 North Harbour vs. Bay of Plenty Sep 16 32 – 20 5.50 TRUE
8 Canterbury vs. Auckland Sep 16 29 – 34 12.60 FALSE


Predictions for Round 6

Here are the predictions for Round 6. The prediction is my estimated expected points difference with a positive margin being a win to the home team, and a negative margin a win to the away team.

Game Date Winner Prediction
1 Manawatu vs. Tasman Sep 19 Tasman -9.90
2 Northland vs. Southland Sep 20 Northland 26.70
3 Bay of Plenty vs. Waikato Sep 21 Bay of Plenty 2.20
4 Hawke’s Bay vs. North Harbour Sep 22 North Harbour -10.60
5 Otago vs. Canterbury Sep 22 Canterbury -7.10
6 Taranaki vs. Auckland Sep 22 Auckland -2.00
7 Tasman vs. Counties Manukau Sep 23 Tasman 12.70
8 Manawatu vs. Wellington Sep 23 Wellington -18.20


Currie Cup Predictions for Round 6


Team Ratings for Round 6

The basic method is described on my Department home page.
Here are the team ratings prior to this week’s games, along with the ratings at the start of the season.

Note that Cheetahs2 refers the Cheetahs team when there is a Pro14 match. The assumption is that the team playing in the Pro14 is the top team and the Currie Cup team is essentially a second team.


Current Rating Rating at Season Start Difference
Western Province 6.94 4.66 2.30
Sharks 3.72 4.18 -0.50
Lions 2.69 3.23 -0.50
Cheetahs 2.23 3.86 -1.60
Blue Bulls 0.52 0.94 -0.40
Pumas -8.08 -8.36 0.30
Griquas -10.02 -9.78 -0.20
Cheetahs2 -29.25 -30.00 0.80


Performance So Far

So far there have been 14 matches played, 11 of which were correctly predicted, a success rate of 78.6%.
Here are the predictions for last week’s games.


Game Date Score Prediction Correct
1 Lions vs. Western Province Sep 15 38 – 65 1.90 FALSE
2 Griquas vs. Cheetahs2 Sep 15 52 – 24 22.90 TRUE
3 Blue Bulls vs. Pumas Sep 15 39 – 29 13.70 TRUE


Predictions for Round 6

Here are the predictions for Round 6. The prediction is my estimated expected points difference with a positive margin being a win to the home team, and a negative margin a win to the away team.


Game Date Winner Prediction
1 Cheetahs2 vs. Pumas Sep 22 Pumas -16.70
2 Sharks vs. Lions Sep 22 Sharks 5.50
3 Western Province vs. Griquas Sep 22 Western Province 21.50


September 17, 2018

Briefly

  • Are we being misled by precision medicine? New York Times
  • When people search for a phrase that does not have natural informative results, it’s easy for manipulators to control the results. Take, for example, “did the Holocaust exist?” danah boyd on search and media manipulation
  • Should the Norfolk (UK) police be using a predictive model to decide whether a burglary is worth spending effort on? IEEE Spectrum is somewhat more negative than I would be.
  • Interesting piece at Slate about a story relating social media and hate crimes in Germany
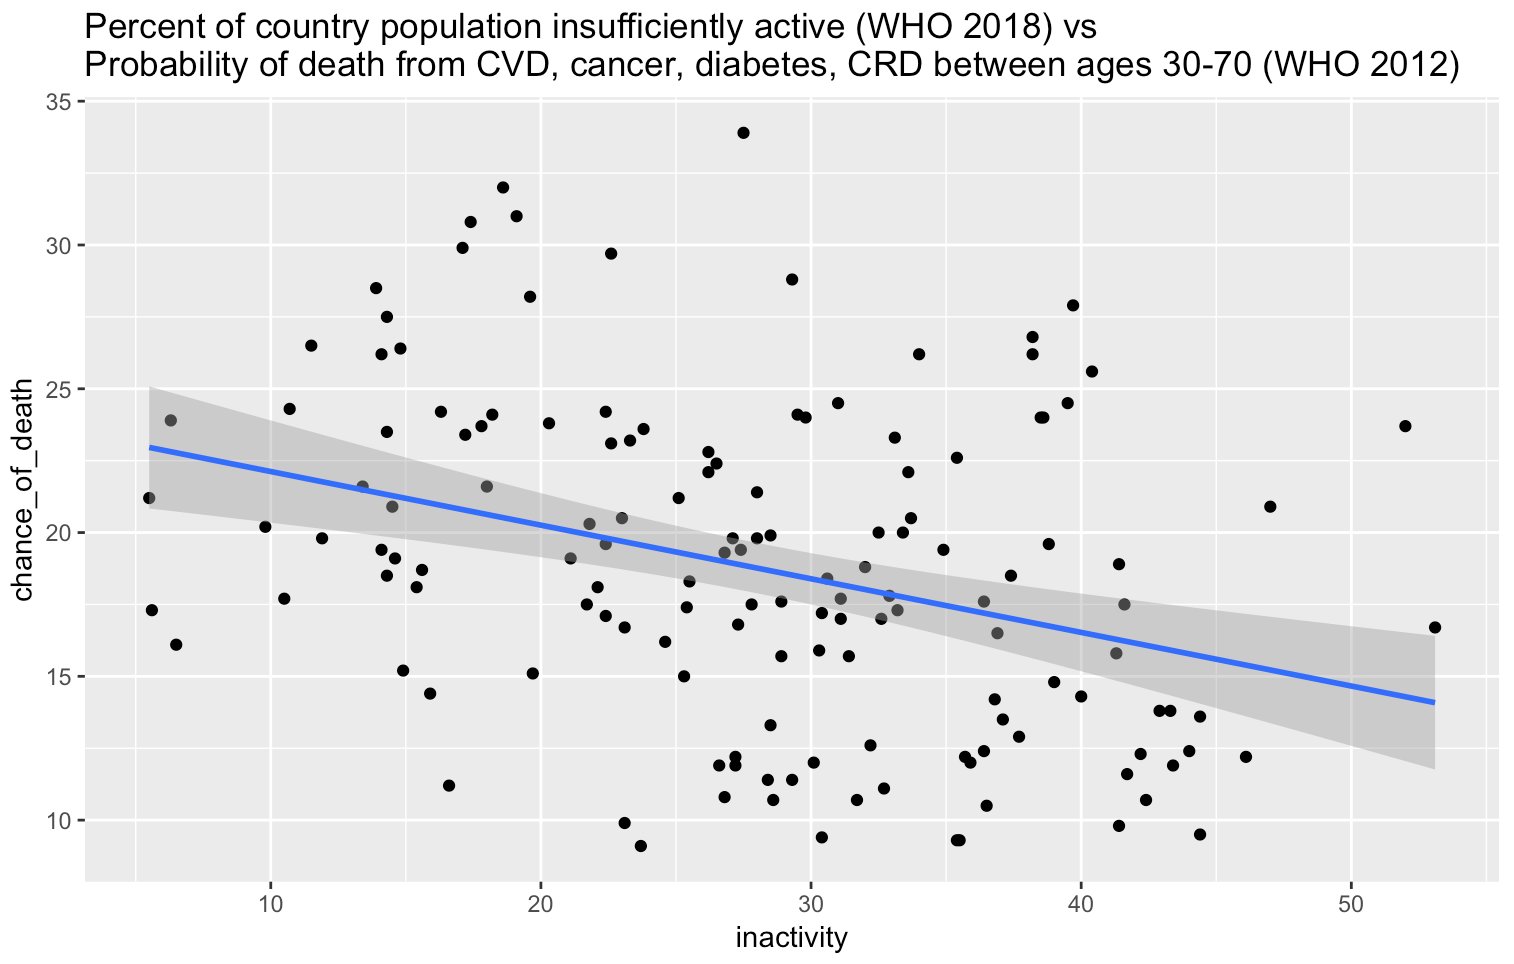
  • Correlations can be confusing. This, from David Hood on Twitter, shows that countries where more people get the recommended amount of exercise have more deaths from heart disease, cancer, lung disease, diabetes.  That’s also what trends over time would say.  Presumably the (real) benefits of exercise are smaller than the benefits of wealth and modern health care, but it’s a neat example.   Note that this isn’t chance correlation in small samples with many variables to choose from, unlike the famous spurious correlations website


September 12, 2018

Tracking down the numbers

There was a story on Radio NZ last night, and then in other places

The research is the first in the world to measure the impact of taking numerous medications on fractures in the elderly.

Its findings show elderly people taking several high-risk medications for sleeping, pain or incontinence are twice as likely to fall and break bones as those taking no medication.

As the story says, overmedication in elderly people is known to be a problem — people get put on medications and then not taken off them, and there are interactions, and it’s not good.  Some — even many– of the drugs are necessary, of course, but these researchers aren’t the only people who think there should be more regular review of what all medications someone is taking.

This research is trying to quantify the impact on falls and fractures, using a large NZ data set of everyone in NZ who was being evaluated for publicly funded long-term community services or aged residential care.  Together with the high-quality NZ prescription data, it’s a good opportunity to look at a large enough group of people to measure fractures.

The media stories all seem to come from the Otago press release. The press release doesn’t include a link to the research paper. It doesn’t even give the journal name. The implication that no-one who reads the story could possibly care about the details is a bit insulting.

I’m assuming the research paper is this one, which is new and has the right topic and authors. The analysis is a bit tricky: a lot of people die without having fractures, and you have to decide how to count them in the denominator over time.  They did a sensible analysis, if not exactly the one I would have done.

There’s one problem, though: that paper says, in the Results section of the Abstract:

The estimated subhazard ratio was 1.52 (95% confidence interval: 1.28, 1.81) for those with DBI>3 compared with those with DBI=0 in the adjusted analysis.

That is, the paper’s best estimate is a 50% higher rate of fractures in people taking multiple potentially-risky drugs compared to none. 50% higher is still a problem — they estimate that about 1 in 8 fractures could be prevented if everyone could be taken off these drugs (which, of course, not every one can) — but 50% higher isn’t twice as high, and I couldn’t find the “twice as high” number in the paper.