Posts filed under General (3156)

October 13, 2015

ITM Cup Predictions for the ITM Cup Finals

Team Ratings for the ITM Cup Finals

The basic method is described on my Department home page.

Here are the team ratings prior to this week’s games, along with the ratings at the start of the season.

Current Rating Rating at Season Start Difference
Canterbury 11.81 10.90 0.90
Tasman 10.77 12.86 -2.10
Taranaki 10.39 7.70 2.70
Auckland 9.63 5.14 4.50
Counties Manukau 2.72 7.86 -5.10
Wellington 2.64 -4.62 7.30
Hawke’s Bay 2.29 -0.57 2.90
Otago 1.73 -4.84 6.60
Waikato -4.56 -6.96 2.40
Bay of Plenty -6.54 -9.77 3.20
Manawatu -6.69 -1.52 -5.20
North Harbour -8.60 -10.54 1.90
Southland -10.02 -6.01 -4.00
Northland -19.56 -3.64 -15.90


Performance So Far

So far there have been 7 matches played, 5 of which were correctly predicted, a success rate of 71.4%.
Here are the predictions for last week’s games.

Game Date Score Prediction Correct
1 Northland vs. Otago Oct 07 36 – 54 -15.80 TRUE
2 Taranaki vs. Tasman Oct 08 17 – 35 8.40 FALSE
3 Hawke’s Bay vs. Waikato Oct 09 30 – 36 14.60 FALSE
4 Canterbury vs. Southland Oct 10 39 – 20 27.30 TRUE
5 Wellington vs. Manawatu Oct 10 33 – 39 17.60 FALSE
6 Counties Manukau vs. Auckland Oct 10 16 – 31 -0.30 TRUE
7 North Harbour vs. Northland Oct 11 36 – 12 12.80 TRUE
8 Otago vs. Bay of Plenty Oct 11 43 – 30 11.90 TRUE


Predictions for the ITM Cup Finals

Here are the predictions for the ITM Cup Finals. The prediction is my estimated expected points difference with a positive margin being a win to the home team, and a negative margin a win to the away team.

Game Date Winner Prediction
1 Auckland vs. Tasman Oct 16 Auckland 2.90
2 Hawke’s Bay vs. Bay of Plenty Oct 17 Hawke’s Bay 12.80
3 Canterbury vs. Taranaki Oct 17 Canterbury 5.40
4 Wellington vs. Otago Oct 17 Wellington 4.90


Currie Cup Predictions for the SemiFinals

Team Ratings for the SemiFinals

The basic method is described on my Department home page.

Here are the team ratings prior to this week’s games, along with the ratings at the start of the season.

Current Rating Rating at Season Start Difference
Lions 6.09 3.04 3.00
Western Province 5.08 4.93 0.10
Blue Bulls 1.98 0.17 1.80
Sharks 1.51 3.43 -1.90
Cheetahs -2.40 -1.75 -0.70
Pumas -6.66 -6.47 -0.20
Griquas -9.36 -7.81 -1.60
Kings -10.14 -9.44 -0.70


Performance So Far

So far there have been 40 matches played, 29 of which were correctly predicted, a success rate of 72.5%.
Here are the predictions for last week’s games.

Game Date Score Prediction Correct
1 Pumas vs. Blue Bulls Oct 09 24 – 25 -5.60 TRUE
2 Western Province vs. Kings Oct 09 45 – 14 18.00 TRUE
3 Lions vs. Griquas Oct 10 29 – 19 19.50 TRUE
4 Cheetahs vs. Sharks Oct 10 34 – 34 -0.50 FALSE


Predictions for the SemiFinals

Here are the predictions for the SemiFinals. The prediction is my estimated expected points difference with a positive margin being a win to the home team, and a negative margin a win to the away team.

Game Date Winner Prediction
1 Blue Bulls vs. Western Province Oct 16 Blue Bulls 0.40
2 Lions vs. Cheetahs Oct 17 Lions 12.00


October 11, 2015

With the potential to miss us completely

Q: Did you see there’s a giant rock with the potential to end life on Earth?

A: This one?

Q: Yes. Are they exaggerating?

A: Depends what you mean. In a sense it does have the potential to end human life on Earth, but it would have to actually hit Earth to do that.

Q: But it’s  “similar to the 1862 Apollo asteroid which was classified as a potentially hazardous object”

A: Similar except for being a lot further away. As the story says, “Potentially Hazardous Objects” approach closer than 7,402,982km, and this one is about 25 million km away at its closest.

Q: That’s an awfully precise number, 7,402,982, isn’t it? Why do they need it to the nearest kilometre?

A: They don’t. It’s 0.05 Astronomical Units, and whoever did the conversion doesn’t understand about significant digits. Wikipedia, for example, rounds it to 7.5 million km.

Q: And the other really precise numbers? It says the asteroid is moving at 64,374km/hr, but surely the speed will change more than 1km/hr because, you know, gravity and physics and stuff?

A: That’s 40,000 miles per hour. Again, looks like one significant digit in the original.

Q: So how far away is this asteroid compared to, say, the moon?

A: To one significant figure, 100 times further away.

Q: That’s quite a lot. Why is NASA making a fuss about this asteroid?

A: They aren’t. They issued a press release about asteroid rumours in  August, headlined “There is no asteroid threatening Earth“.  The NASA @asteroidwatch twitterwallah is getting a bit tetchy about the whole thing.

Q: Does the asteroid have something to do with the “blood moon” we had recently?

A: Only in the sense that they were both completely unsurprising and harmless astronomical events.


(h/t @philiplyth)

Gay gene update

Yesterday I wrote about a ‘gay epigenetics’ story in the Herald, and wasn’t convinced that there was anything worth publicising at this point, and that there wasn’t enough detail to interpret the results.

Ed Yong, a science journalist who was actually at the conference, has a story today in the Atlantic. He fingers the conference as the responsible party for the publicity (here’s their press release), though with the active cooperation of the researchers.

His story has more detail and makes it clear that there’s very little evidence, and more importantly that the lead researcher knew this:

“The reality is that we had basically no funding,” he said. “The sample size was not what we wanted. But do I hold out for some impossible ideal or do I work with what I have? I chose the latter.”

For pilot research presented to consenting scientists that might be reasonable, but for press releases it isn’t.

Epigenetics is an area of science where New Zealand has an international reputation. It would be a pity if it ended up as one of the areas where you can be sure that basically nothing that makes it to the newspapers is true.

October 10, 2015

Return of the brother of the gay gene

From the Herald (from the Telegraph)

Factors ranging from exposure to certain chemicals to childhood abuse, diet and exercise may affect the DNA controlling sexuality, according to research being presented at a US conference on genetics.

They believe they can predict with 70 per cent accuracy whether a man is gay or straight, simply by looking at those parts of the genome.

[There’s a slightly better story in Nature News.]

70% accuracy doesn’t seem all that impressive. Using the usual figures on the proportion of men who are gay, the approach of assuming everyone is straight unless you are told otherwise is better than 90% accurate, and doesn’t need expensive genetics.  Presumably they mean something different by 70% accuracy, but we don’t know what.

More importantly, this is research in identical twins.  If you take pairs of people who are genetically identical, had the same environment in the womb, and then very similar environments in infancy and childhood, you’ve stripped out nearly all the other factors that could affect sexual orientation. That’s the point of doing the research this way — you get a clearer view of potentially-small differences — but it’s a limitation when you’re trying to make claims about people in general.

Also, there’s an important difference between genetics and epigenetics here. The epigenetic markers, as the story says, can be affected by things that happen to you during childhood. But that means we can’t necessarily assume the correlations between epigenetic differences and sexual orientation are causal.  The “factors ranging from exposure to certain chemicals to childhood abuse, diet and exercise” that can affect epigenetic markers could also affect sexual orientation directly — especially since the epigenetic markers were measured in cells from the lining of the mouth, not in, say, the brain.

On top of all that, this is another annoying example of research being publicised before it’s published. It’s not at all impossible that the claims are true,  but there isn’t enough public information to tell. The research was presented at the conference of the American Society for Human Genetics. People at the conference would have been able to see more detail, and maybe ask questions. We can’t. We won’t be able to until there’s a published research paper. That would have been the time for publicity.

And finally, there’s an interesting assumption revealed in the headline “Boys ‘turned gay by childhood shift in genes’“. The research looked at differences between identical twins. It says absolutely nothing about which twin changed and which one stayed the same — you could equally well say “Boys turned straight by childhood shift in genes”.


Predicting abortion attitudes

Quartz has an interesting analysis of a recent Twitter storm over abortion, triggered by the US Republicans’ attempts to defund Planned Parenthood.  The headline is striking “How to tell whether a Twitter user is pro-choice or pro-life without reading any of their tweets.”

The writers describe how they could use words in twitter profiles to predict people’s attitudes.  They also found that social network structure was a very strong predictor: people shared the views of those they followed.  They write “so polarized is the social network structure that even very basic, obvious characteristics stop mattering if we know who your friends are”

It might seem strange that you could do so well in predicting attitudes across multiple countries on a controversial topic. It would be strange, except that the data they used was restricted to a small group of people who were participating in a Twitter argument about abortion. The story admits this, but not until near the end.

In real life, you probably can’t learn that much about someone’s views on abortion by whether they tweet about cats or football. In the context of a small, highly polarised argument, you probably can.  In real life, people don’t necessarily agree with the views of the people they follow on Twitter, but in that context it’s not surprising that they do.  And in real life, if someone wants to find out your views on a controversial topic they’d probably be better off asking you than tracking down all your friends and asking them.


October 9, 2015

Briefly

  • A 2010 post complaining about a continuing problem: when the media report on scientific papers that the journals haven’t yet made available to scientists.
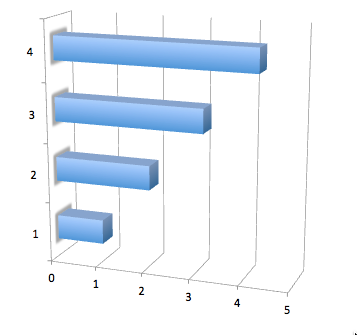
  • Which bar is closest to a whole number in length?xl
    That’s right, the smallest one is exactly 1.0 and the others are all slightly larger than a whole number. Inspired by one of Kieran Healy’s examples
  • Linguistic statistics: G K Chesterton almost never used feminine pronouns in his novels.
  • The famous London Underground map, labelled with rents in the neighbourhood of each station. Would be interesting to see an Auckland map using trains and major bus routes. (via Flowing Data)
October 7, 2015

Currie Cup Predictions for Round 10

Team Ratings for Round 10

The basic method is described on my Department home page.

Here are the team ratings prior to this week’s games, along with the ratings at the start of the season.

Current Rating Rating at Season Start Difference
Lions 6.36 3.04 3.30
Western Province 4.74 4.93 -0.20
Blue Bulls 2.21 0.17 2.00
Sharks 1.53 3.43 -1.90
Cheetahs -2.42 -1.75 -0.70
Pumas -6.89 -6.47 -0.40
Griquas -9.63 -7.81 -1.80
Kings -9.80 -9.44 -0.40


Performance So Far

So far there have been 36 matches played, 26 of which were correctly predicted, a success rate of 72.2%.
Here are the predictions for last week’s games.

Game Date Score Prediction Correct
1 Lions vs. Western Province Oct 02 62 – 32 4.00 TRUE
2 Blue Bulls vs. Kings Oct 02 48 – 27 14.90 TRUE
3 Pumas vs. Cheetahs Oct 03 37 – 37 -1.10 FALSE
4 Griquas vs. Sharks Oct 03 20 – 45 -6.80 TRUE


Predictions for Round 10

Here are the predictions for Round 10. The prediction is my estimated expected points difference with a positive margin being a win to the home team, and a negative margin a win to the away team.

Game Date Winner Prediction
1 Pumas vs. Blue Bulls Oct 09 Blue Bulls -5.60
2 Western Province vs. Kings Oct 09 Western Province 18.00
3 Lions vs. Griquas Oct 10 Lions 19.50
4 Cheetahs vs. Sharks Oct 10 Sharks -0.50


October 6, 2015

When the lack of news is the story

There are new (provisional) suicide figures out for the year to June, and the Herald has a story (and has embedded the summary report).

The problem with news stories on this topic is that the important statistics haven’t changed.  Suicide rates have been pretty much constant over the 9 years of data shown. It’s still true that New Zealand has a high suicide rate, that it’s much higher for men than women, and that it’s much higher for Māori than non-Māori, and lowest for Asians.

There were slightly more suicides this year than in recent years, almost the same per-capita rate as in 2011/12.  Most of the increase was in men, but it’s still not any sort of clear sign of a trend.  The Herald story leads with the changes, as news has to, but the real story is that we still haven’t managed to change anything.

October 5, 2015

Our favourite bogus poll

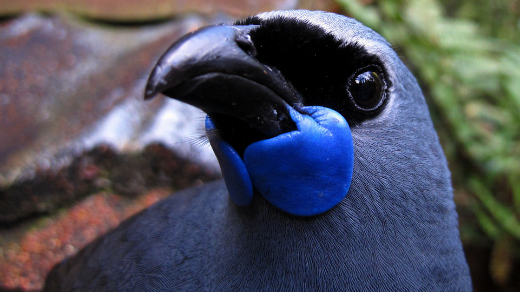
It’s time for Forest & Bird’s Bird of the Year competition. As with any bogus poll, we won’t learn what the true popularity of the various NZ birds actually is.

kokako_0

As long as it’s clear that bogus polls are being used for entertainment and advertising, not to collect information, there isn’t a statistical problem with them.