Posts filed under General (3156)

October 24, 2015

Bacon vs cigarettes

There has apparently been a leak from the International Agency for Research on Cancer about their forthcoming assessment of meat. It’s just in the UK papers so far, but I expect it will spread. Here’s an example, from the Telegraph

Bacon, ham and sausages ‘as big a cancer threat as smoking’, WHO to warn
The WHO is expected to publish a report listing processed meat as a cancer-causing substance with the highest of five possible rankings

Presumably what they mean is that IARC is going to classify processed meat as a Group 1 carcinogen. The story is playing on a common misunderstanding of the IARC hazard grades for carcinogenicity.

As I’ve written before, the IARC hazard grades aren’t about the magnitude of the threat. A Group 1 carcinogen is an agent whose ability to cause or promote cancer is well established. To quote the Preamble to the IARC Monographs

A cancer ‘hazard’ is an agent that is capable of causing cancer under some circumstances, while a cancer ‘risk’ is an estimate of the carcinogenic effects expected from exposure to a cancer hazard. The Monographs are an exercise in evaluating cancer hazards, despite the historical presence of the word ‘risks’ in the title. The distinction between hazard and risk is important, and the Monographs identify cancer hazards even when risks are very low at current exposure levels, because new uses or unforeseen exposures could engender risks that are significantly higher.

In the Monographs, an agent is termed ‘carcinogenic’ if it is capable of increasing the incidence of malignant neoplasms, reducing their latency, or increasing their severity or multiplicity.

The ‘five possible rankings‘ mentioned by the Telegraph could also do with some clarification. Effectively, there are three rankings, officially defined as “definite”, “probable”, and “possible”. There’s a “don’t know” ranking for things that haven’t been studied enough to make any assessment. Finally, there’s a largely-hypothetical “probably not” ranking, which has only ever been used once in nearly a thousand assessments.

If the leak is correct, processed meats will be joining alcohol, plutonium, sunlight, tobacco, birth-control pills, and Chinese-style salted fish in Group 1. These aren’t all an equal threat, but the IARC scientists believe all of them are able to cause cancer at the right dose.

Mostly Male Meetings: what are the odds?

A story in the Atlantic talks about an ongoing problem in science (and tech, and science fiction): the large number of conferences where nearly all the high-profile speaking slots go to men.  This isn’t news, even to their readers; there was a story in the Atlantic two and a half years ago on the same point. You don’t see this to quite the same extent in statistics, but at least part of that is because we don’t do as many conferences with a lot of high-profile speaking slots. We tend to let everyone speak.

When this is raised, one of the main negative response (of the ones people are prepared to put their names to), has been that this is chance. That’s what the piece in the Atlantic talks about.

Working with a “conservative” assumption that 24 percent of Ph.D.s in mathematics have been granted to women over the last 25 years, he finds that it’s statistically impossible that a speakers’ lineup including one woman and 19 men could be random.

The  probability of getting 0 or 1 women in a random sample of 20 people from a population with 24% women is 3%.  You could argue that the speakers are likely to be academics, and will tend to be more senior and increase the probability a bit, but the story’s figure of “less than 5%” is not an outlandish estimate — especially as mathematicians make a point of claiming they do their best work young.

On the other hand, 5% (or 3%) isn’t that small a number. It certainly isn’t “statistically impossible” as in the quote or “astronomically small” as in the story’s headline. Considering this conference in isolation the evidence of bias would be positive, but hardly overwhelming.

The statistical aspect of this problem is a bit like the statistical aspect of the Bechdel test for movies (two female characters; who talk to each other; not only about a man). You’d expect some movies to fail the Bechdel test. Some movies should fail the Bechdel test. What’s notable is that about half of all movies do.

You’d expect some conferences to have substantially fewer women than the population average for a field — the women in, say, mathematics will not be spread out evenly, so some topics will have more and some will have fewer in a way that messes up the probability calculation.  Also, some conferences will be more worried about other forms of under-representation — it’s more obvious for women because they are a relatively large fraction of the target population and because you can tell someone’s gender fairly reliably from a name and photo.

There wouldn’t be anything noteworthy about the occasional conference having substantially fewer women than expected. Even with perfect homogeneity across topics and no bias, about one conference in thirty would have a one-in-thirty under-representation of women. In that scenario you could argue there wasn’t any need to do anything about it.

That is so not where we are.

October 23, 2015

A little search goes a long way

The Herald has a story about cheese addiction, meant literally.

To understand why this is probably unreliable, try Wikipedia on the following terms or phrases from the story

Next, consider why Vegetarian Times is the primary source for a story purportedly about biochemistry.

October 21, 2015

Rugby World Cup Predictions for the Semi-finals

Team Ratings for the Semi-finals

The basic method is described on my Department home page.

Here are the team ratings prior to this week’s games, along with the ratings at the start of the Rugby World Cup.

Current Rating Rating at RWC Start Difference
New Zealand 28.42 29.01 -0.60
South Africa 22.84 22.73 0.10
Australia 20.85 20.36 0.50
England 16.43 18.51 -2.10
Ireland 15.97 17.48 -1.50
Wales 13.85 13.93 -0.10
Argentina 11.27 7.38 3.90
France 8.96 11.70 -2.70
Scotland 5.94 4.84 1.10
Fiji -2.19 -4.23 2.00
Samoa -4.15 -2.28 -1.90
Italy -6.37 -5.86 -0.50
Tonga -8.84 -6.31 -2.50
Japan -9.10 -11.18 2.10
USA -17.13 -15.97 -1.20
Georgia -17.74 -17.48 -0.30
Canada -17.89 -18.06 0.20
Romania -19.44 -21.20 1.80
Uruguay -31.67 -31.04 -0.60
Namibia -33.29 -35.62 2.30


Performance So Far

So far there have been 44 matches played, 37 of which were correctly predicted, a success rate of 84.1%.
Here are the predictions for last week’s games.

Game Date Score Prediction Correct
1 South Africa vs. Wales Oct 17 23 – 19 10.10 TRUE
2 New Zealand vs. France Oct 17 62 – 13 16.60 TRUE
3 Ireland vs. Argentina Oct 18 20 – 43 7.50 FALSE
4 Australia vs. Scotland Oct 18 35 – 34 16.50 TRUE


Predictions for the Semi-finals

Here are the predictions for the Semi-finals. The prediction is my estimated expected points difference with a positive margin being a win to the first-named team, and a negative margin a win to the second-named team.

Game Date Winner Prediction
1 South Africa vs. New Zealand Oct 24 New Zealand -5.60
2 Argentina vs. Australia Oct 25 Australia -9.60


October 20, 2015

World Statistics Day

[this post by Julie Middleton]

WSD_Logo_Final_Languages_Outline

Today is World Statistics Day, and statisticians all over the world will be showcasing the value of their work under the theme ‘Better data, better lives’.
To mark the day, Statistics New Zealand is putting out three useful resources:[

1: An animated infographic that expresses the value of statistics to the economy and people as they go about their day-to-day lives;

2: A video that summarises in two minutes changes in New Zealand’s population over the last 150 years;

3: A video that summarises the highs and lows of 30 years of labour market statistics.

World Statistics Day was proclaimed by the United Nations General Assembly in 2010 to recognise the importance of statistics in shaping our societies. National and regional statistical days already existed in more than 100 countries, but the General Assembly’s adoption of this international day as 20 October brought extra momentum. That first World Statistics Day in October 2010 was marked in more than 130 countries and areas.

According to UNStats, this year marks an important cornerstone for official statistics, with the conclusion of the Millennium Development Goals (see how countries have fared here), the post-2015 development agenda, the data revolution (see what the Data Revolution Group set up by UN Secretary-General Ban Ki-Moon has to say here), the preparations for the 2020 World Population and Housing Census Programme and the likes.
One cute initiative of UNStats is to translate the English logo for World Statistics Day into many of the languages of the world. We couldn’t miss the opportunity to have UNStats do one in the first language of this country, te reo Māori. Te tino kē hoki o te moko nā! (Nice logo!)

WorldStatsDay_Logo_Maori-01
You can download logos in English, Māori and dozens of other languages from the UNStats site here.

One important initiative of the UN for this year’s commemoration is the launch, at its New York headquarters, of the report The World’s Women 2015: Trends and Statistics. The report is produced every five years under the Beijing Platform for Action, which was adopted at the Fourth World Conference on Women in 1995.

The eight chapters of the report cover several critical areas of policy concerns identified in that landmark 1995 conference: population and families; health; education; work; power and decision-making; violence against women; environment; and poverty. It takes a life-cycle approach in revealing the experiences of women and men during different periods of life.

October 19, 2015

Briefly

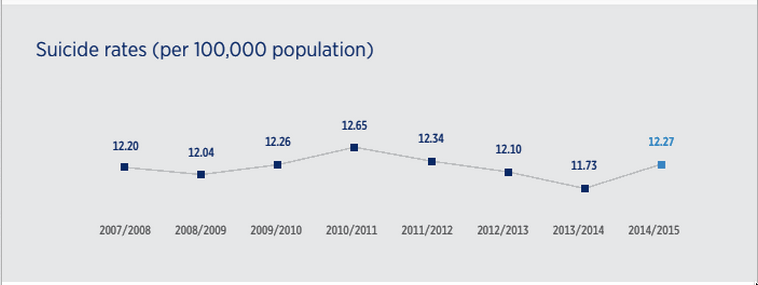
  • The Guardian says‘We have to start talking about it’: New Zealand suicide rates hit record high.” The first bit is true. The second, as I explained a couple of weeks ago, isn’t. The rate isn’t at a record high (the count is), and more generally the tragedy (or scandal) is that the rate has been basically this high for a long time. This graph is on the front page of the report from the Chief Coroner
    suicide
  • No, I don’t know why moles on your  right arm are particularly relevant to melanoma.  I don’t know because the British Journal of Dermatology told the media to print the story before they released the scientific paper. Yes, there’s a lot of this around.
  • I am pretty sure, though, that customising a UK story about melanoma with “In New Zealand, new skin cancers total about 67,000 per year” isn’t helpful. That’s all skin cancers. For melanoma the figure is about 2500 (from the Ministry of Health) or about 4000 (from Melanoma NZ). I think the difference between the two figures may be that the Ministry of Health don’t count melanoma in situ. Either way, not 67,000.
  • Experimental evidence that decorating your barcharts with round bits or pointy bits really makes them less readable. (via @albertocairo)
  • Nicholas Felton has been collecting data about himself and making art in the form of Personal Annual Reports for ten years. His latest and last is out now.
  • New factsheets from the (UK) Patient Information Forum, on communicating risk (via David Spiegelhalter)
  • People are more afraid of shark attacks than car accidents despite the fact that car accidents are much more likely. SMBC has a solution to this problem. It involves marine biology. (via @scicomguy)

Thinking about public Big Data

There are useful pieces by David Fisher in the Herald, and Tom Pullar-Strecker at Stuff, about the new NZ Data Futures Partnership and its chair, Dame Diane Robertson.  The idea is that the government has access to a lot of data, which could be used in all sorts of ways, but that New Zealand society needs to make decisions about which uses are ok. At least, that’s the idea in David Fisher’s story. In the Stuff piece it sounds more as though the idea is to educate people so they agree with the desired uses. [update: in the print version of the Herald there’s also something by Harkanwal Singh on the social consent issue]

Detailed individual data can be used for predicting things, and while there’s obviously a problem if the predictions are inaccurate, there can be even more of a problem if they are accurate. The Herald story mentions the use of predictions of re-offending to give people longer prison terms, so-called ‘evidence-based sentencing‘.

It isn’t just a question of whether data will be used to do Bad Things, though. There’s a broader problem of maintaining trust in government data. If you think your information is going to be used to do complex, mysterious, and potentially creepy things, you’re going to be less likely to talk to the nice StatsNZ interviewer.  Reliable government data collection is important for the private sector as well as the public sector, and it’s much more difficult and expensive if the public don’t trust the data collectors.

In the US, according to a recent analysis, confidence in federal statistical agencies is fairly low — they’re rated more highly than the politicians, but below the military and universities, and level with newspapers.

In this survey, it mattered how much people knew about the statistical agencies, but in a complicated way. For people who didn’t know much about what the agencies did, confidence in them was moderately well correlated with confidence in the military, newspapers, Congress, and universities. For people who knew more about the agencies, these correlations were weaker.  These people might like or dislike the Census Bureau or the CDC, but didn’t see the agencies as part of a vague and powerful Them.

There are plenty of cynical explanations you can give for these results, but there’s also an obvious positive explanation: it’s good for people to understand what government does with their data and why.


October 16, 2015

Not the news

I was surprised to see a headline in the Business section of the Herald saying “2015 luckiest year for Lotto players” about lotto jackpots (story here)

lotto-ad

After all, the way the lottery jackpots work, the amount paid out is a fixed fraction of the amount taken in. If there are more people winning large amounts then either the large amounts aren’t as large as in other years, or it’s because more people are collectively losing large amounts. Lotto players, considered individually, can be lucky or not; lotto players conside collectively, can’t be.

If you look carefully, though, you can see this isn’t a news story. It’s a “Sponsored Story”.

This still seems different from the “Brand Insight” that “connects readers directly to the leadership thinking of many prominent companies and organisations“, or the science and technology column by Michelle ‘Nanogirl’ Dickinson that was initially sponsored by Callaghan Innovation.

October 15, 2015

Briefly

  • With some insurance companies taking advantage of exercise trackers like FitBit to discriminate in favour of the health, there’s a potential market for fooling your FitBit. It’s hard to tell if UnfitBits is serious, but someone will be.
  • When you might not want the government to have high-quality evidence-based choice of policies
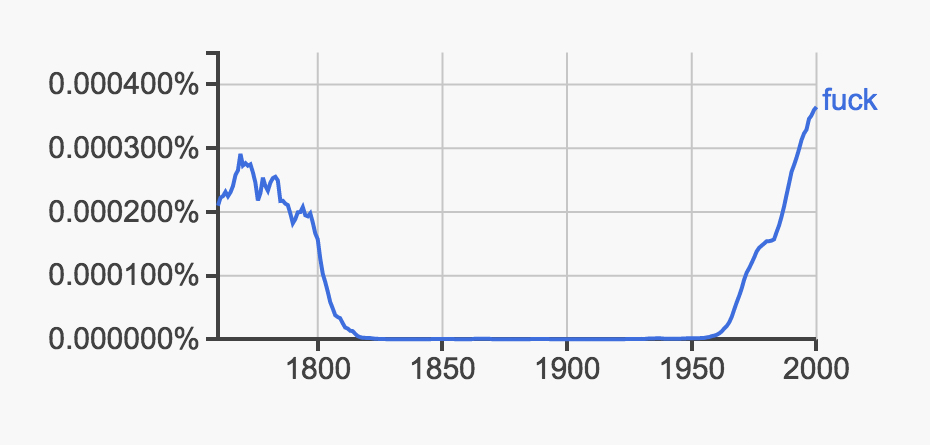
  • The pitfalls of using Google n-grams for linguistic research, from Wired
    Screenshot-2015-10-12-10.59.09
October 13, 2015

Rugby World Cup Predictions for the Quarter Finals

Team Ratings for the Quarter Finals

The basic method is described on my Department home page.

Here are the team ratings prior to this week’s games, along with the ratings at the start of the Rugby World Cup.

Current Rating Rating at RWC Start Difference
New Zealand 26.96 29.01 -2.00
South Africa 23.39 22.73 0.70
Australia 21.66 20.36 1.30
Ireland 17.35 17.48 -0.10
England 16.43 18.51 -2.10
Wales 13.30 13.93 -0.60
France 10.41 11.70 -1.30
Argentina 9.89 7.38 2.50
Scotland 5.13 4.84 0.30
Fiji -2.19 -4.23 2.00
Samoa -4.15 -2.28 -1.90
Italy -6.37 -5.86 -0.50
Tonga -8.84 -6.31 -2.50
Japan -9.10 -11.18 2.10
USA -17.13 -15.97 -1.20
Georgia -17.74 -17.48 -0.30
Canada -17.89 -18.06 0.20
Romania -19.44 -21.20 1.80
Uruguay -31.67 -31.04 -0.60
Namibia -33.29 -35.62 2.30


Performance So Far

So far there have been 40 matches played, 34 of which were correctly predicted, a success rate of 85%.
Here are the predictions for last week’s games.

Game Date Score Prediction Correct
1 New Zealand vs. Tonga Oct 09 47 – 9 35.30 TRUE
2 Samoa vs. Scotland Oct 10 33 – 36 -10.70 TRUE
3 Australia vs. Wales Oct 10 15 – 6 8.20 TRUE
4 England vs. Uruguay Oct 10 60 – 3 54.10 TRUE
5 Argentina vs. Namibia Oct 11 64 – 19 42.80 TRUE
6 Italy vs. Romania Oct 11 32 – 22 13.70 TRUE
7 France vs. Ireland Oct 11 9 – 24 -5.90 TRUE
8 USA vs. Japan Oct 11 18 – 28 -7.60 TRUE


Predictions for the Quarter Finals

Here are the predictions for the Quarter Finals. The prediction is my estimated expected points difference with a positive margin being a win to the first-named team, and a negative margin a win to the second-named team.

Game Date Winner Prediction
1 South Africa vs. Wales Oct 17 South Africa 10.10
2 New Zealand vs. France Oct 17 New Zealand 16.60
3 Ireland vs. Argentina Oct 18 Ireland 7.50
4 Australia vs. Scotland Oct 18 Australia 16.50