Posts filed under General (3156)

March 4, 2015

NRL Predictions for Round 1

Team Ratings for Round 1

The basic method is described on my Department home page.

Here are the team ratings prior to this week’s games, along with the ratings at the start of the season.

Current Rating Rating at Season Start Difference
Rabbitohs 13.06 13.06 -0.00
Cowboys 9.52 9.52 -0.00
Roosters 9.09 9.09 -0.00
Storm 4.36 4.36 0.00
Broncos 4.03 4.03 -0.00
Panthers 3.69 3.69 -0.00
Warriors 3.07 3.07 -0.00
Sea Eagles 2.68 2.68 0.00
Bulldogs 0.21 0.21 0.00
Knights -0.28 -0.28 -0.00
Dragons -1.74 -1.74 -0.00
Raiders -7.09 -7.09 -0.00
Eels -7.19 -7.19 -0.00
Titans -8.20 -8.20 0.00
Sharks -10.76 -10.76 -0.00
Wests Tigers -13.13 -13.13 -0.00


Predictions for Round 1

Here are the predictions for Round 1. The prediction is my estimated expected points difference with a positive margin being a win to the home team, and a negative margin a win to the away team.

Game Date Winner Prediction
1 Broncos vs. Rabbitohs Mar 05 Rabbitohs -6.00
2 Eels vs. Sea Eagles Mar 06 Sea Eagles -6.90
3 Cowboys vs. Roosters Mar 07 Cowboys 3.40
4 Knights vs. Warriors Mar 07 Knights 0.70
5 Titans vs. Wests Tigers Mar 07 Titans 7.90
6 Panthers vs. Bulldogs Mar 08 Panthers 6.50
7 Sharks vs. Raiders Mar 08 Raiders -0.70
8 Dragons vs. Storm Mar 09 Storm -3.10


Super 15 Predictions for Round 4

Team Ratings for Round 4

The basic method is described on my Department home page.

Here are the team ratings prior to this week’s games, along with the ratings at the start of the season.

Current Rating Rating at Season Start Difference
Waratahs 8.16 10.00 -1.80
Crusaders 7.07 10.42 -3.30
Hurricanes 5.52 2.89 2.60
Chiefs 4.08 2.23 1.90
Brumbies 3.84 2.20 1.60
Sharks 2.81 3.91 -1.10
Stormers 2.80 1.68 1.10
Bulls 1.82 2.88 -1.10
Blues 0.43 1.44 -1.00
Highlanders -2.53 -2.54 0.00
Cheetahs -4.29 -5.55 1.30
Lions -4.33 -3.39 -0.90
Force -5.17 -4.67 -0.50
Reds -5.91 -4.98 -0.90
Rebels -7.29 -9.53 2.20


Performance So Far

So far there have been 21 matches played, 13 of which were correctly predicted, a success rate of 61.9%.

Here are the predictions for last week’s games.

Game Date Score Prediction Correct
1 Highlanders vs. Reds Feb 27 20 – 13 8.10 TRUE
2 Force vs. Hurricanes Feb 27 13 – 42 -3.40 TRUE
3 Cheetahs vs. Blues Feb 27 25 – 24 -0.50 FALSE
4 Chiefs vs. Crusaders Feb 28 40 – 16 -1.80 FALSE
5 Rebels vs. Brumbies Feb 28 15 – 20 -7.60 TRUE
6 Bulls vs. Sharks Feb 28 43 – 35 2.20 TRUE
7 Lions vs. Stormers Feb 28 19 – 20 -3.60 TRUE


Predictions for Round 4

Here are the predictions for Round 4. The prediction is my estimated expected points difference with a positive margin being a win to the home team, and a negative margin a win to the away team.

Game Date Winner Prediction
1 Chiefs vs. Highlanders Mar 06 Chiefs 10.60
2 Brumbies vs. Force Mar 06 Brumbies 13.00
3 Blues vs. Lions Mar 07 Blues 9.30
4 Reds vs. Waratahs Mar 07 Waratahs -10.10
5 Cheetahs vs. Bulls Mar 07 Bulls -2.10
6 Stormers vs. Sharks Mar 07 Stormers 4.00


March 2, 2015

A nice cuppa

Q:  What do you think about this new research on tea preventing diabetes?

A: That’s not what it says

Q: Sure it is. Big black letters, right at the top: “Three cups of tea a day can cut your risk of diabetes… even if you add milk”

A: I mean that’s not what the research says

Q: The bit about milk?

A: Well, they didn’t study milk at all, but that’s not the main problem

Q: They didn’t study cups?

A: No. Or diabetes. Or, in one of the studies, tea.

Q: Hmm. Ok, so this “glucose-lowering effect” they write about, is that a lab study?

A: Yes.

Q: Mice?

A:  One of the studies used rats, the other didn’t

Q: Cells, then?

A: No, just enzymes in a test tube, and a highly processed chemical extract of tea.

Q: Ok, forget about that one. But the rat study, that measured actual glucose lowering and actual tea?

A:  Almost. They gave the rats a high-sugar drink, and if they were given the tea first, their blood glucose didn’t go up as much.

Q: Which of the two studies was this one?

A: The one where the story just says the results were similar and doesn’t give the researchers’ names, only their institution.

Q: Wouldn’t you think the story would say more about this one, since it actually involves blood glucose and, like, living things?

A: In a perfect world, yes.

Q: The story says they don’t think milk would make a difference. What about sugar?

A: No mention of it.

Q: That’s strange. Quite a lot of British people have sugar in their tea. Wouldn’t it be helpful to say something?

A: You’d think.

Q: How much tea did the rats get?

A: The lowest effective dose they report is 62.5 mg/kg of freeze-dried tea powder

Q: What’s that in cups?

A: The research paper says “corresponds to nine cups of black tea”.

Q: Per day?

A: No, all at once.

Q: So we need to get bigger cups?

A: Or fewer reprinted British ‘health’ stories.

February 27, 2015

CensusAtSchool 2015 launches soon!

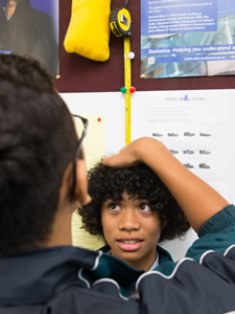
It’s nearly CensusAtSchool time again!  CAS is a biennial educational project in te reo Māori and English that turns school students into data detectives, using real-world, anonymised data about them, their peers, and their world.123_UoAStats_6May13 -low res

This is how it works: In the classroom, using any sort of internet-enabled digital device, and under the supervision of teachers, students fill in a confidential questionnaire in English or te reo Māori.

Some questions involve practical skills, such as weighing their schoolbags and measuring their arm span. Some questions ask about their day-to-day lives: How do they get to school? Where did they eat their dinners the night before? Do they think bullying is a problem in their school? And, given that this is a major sporting year: Which two teams will contest the Rugby World Cup final?

The database is then made available for students and their teachers to undertake statistical investigations, which is an important part of the statistics strand of the curriculum.

Teachers, this year’s Census starts on March 16, and can be completed any time this year. It’s free and you can register at www.censusatschool.org.nz. For everyone else, CAS always attracts great mainstream media interest – we’ll post the best stories here as they crop up.081_UoAStats_6May13low res

CensusAtSchool is an international educational project that began in the UK in 2000, based on a 1990 trial project by Dr Sharleen Forbes, then of Statistics New Zealand. It is now run in the UK, Ireland, Australia, Canada, South Africa, Japan and the US, as well as  New Zealand.

February 25, 2015

Briefly

  • NZ papers have sensible coverage of the new peanuts/kids research (Herald, Stuff). NHS Behind The Headlines has a summary and takes some UK papers to task.
  • “Rich Data, Poor Data”: Nate Silver writes about why sports statistics works. Unfair summary: it’s an artificial problem in a controlled environment that people care about more than they should.
  • “the vast majority of health sites, from the for-profit WebMD.com to the government-run CDC.gov, are loaded with tracking elements that are sending records of your health inquiries to the likes of web giants like Google, Facebook, and Pinterest, and data brokers like Experian and Acxiom.” Story at vice.com, video summary from the researcher:
  • “A memo to the American people from US Chief Data Scientist Dr DJ Patil”.  More informative than you might expect given the source.
  • “the biggest problem facing the world of public opinion research isn’t that online opt-in polls, but rather the temptation to troll twitter to “see what people are thinkingand other thoughts from Cathy O’Neil, based on the new report on Big Data from the American Association for Public Opinion Research.
  • Openweathermap.org: another part of the increasing supply of open data
    weathermap

Wiki New Zealand site revamped

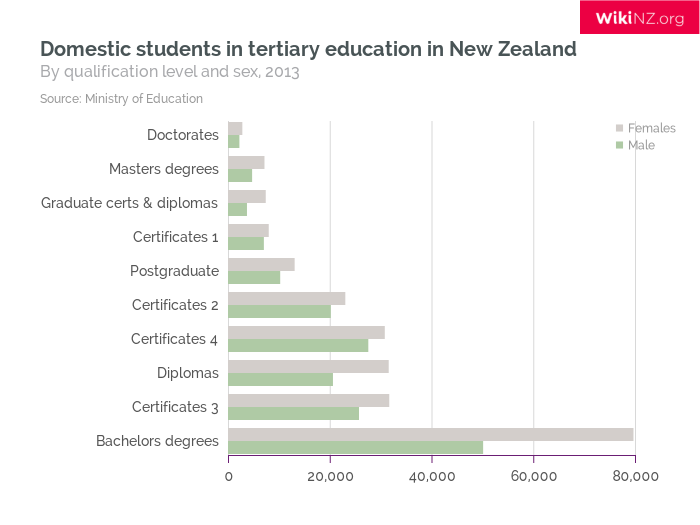
We’ve written before about Wiki New Zealand, which aims to ‘democractise data’. WNZ has revamped its website to make things clearer and cleaner, and you can browse here.

As I’m a postgraduate scarfie this year, the table on domestic students in tertiary education interested me – it shows that women (grey) are enrolled in greater numbers than men at every single level. Click the graph to embiggen.

Founder Lillian Grace talks about the genesis of Wiki New Zealand here, and for those who love the techy  side, here’s a video about the backend.


png


February 18, 2015

Super 15 Predictions for Round 2

Team Ratings for Round 2

The basic method is described on my Department home page.

Here are the team ratings prior to this week’s games, along with the ratings at the start of the season.

Current Rating Rating at Season Start Difference
Crusaders 8.60 10.42 -1.80
Waratahs 8.35 10.00 -1.60
Brumbies 3.95 2.20 1.70
Hurricanes 3.65 2.89 0.80
Sharks 2.79 3.91 -1.10
Chiefs 2.77 2.23 0.50
Stormers 2.69 1.68 1.00
Bulls 1.87 2.88 -1.00
Blues 0.90 1.44 -0.50
Highlanders -2.54 -2.54 -0.00
Force -3.02 -4.67 1.70
Lions -4.14 -3.39 -0.80
Cheetahs -4.42 -5.55 1.10
Reds -6.73 -4.98 -1.70
Rebels -7.71 -9.53 1.80


Performance So Far

So far there have been 7 matches played, 2 of which were correctly predicted, a success rate of 28.6%.

Here are the predictions for last week’s games.

Game Date Score Prediction Correct
1 Crusaders vs. Rebels Feb 13 10 – 20 24.40 FALSE
2 Brumbies vs. Reds Feb 13 47 – 3 11.20 TRUE
3 Lions vs. Hurricanes Feb 13 8 – 22 -1.80 TRUE
4 Blues vs. Chiefs Feb 14 18 – 23 3.20 FALSE
5 Sharks vs. Cheetahs Feb 14 29 – 35 13.50 FALSE
6 Bulls vs. Stormers Feb 14 17 – 29 5.20 FALSE
7 Waratahs vs. Force Feb 15 13 – 25 18.70 FALSE


Predictions for Round 2

Here are the predictions for Round 2. The prediction is my estimated expected points difference with a positive margin being a win to the home team, and a negative margin a win to the away team.

Game Date Winner Prediction
1 Chiefs vs. Brumbies Feb 20 Chiefs 3.30
2 Rebels vs. Waratahs Feb 20 Waratahs -12.10
3 Bulls vs. Hurricanes Feb 20 Bulls 2.70
4 Highlanders vs. Crusaders Feb 21 Crusaders -7.10
5 Reds vs. Force Feb 21 Reds 0.30
6 Stormers vs. Blues Feb 21 Stormers 6.30
7 Sharks vs. Lions Feb 21 Sharks 10.90


February 16, 2015

Briefly

February 14, 2015

Run and find out, but guess first

Vox.com has a post on calendar patterns.  Yuri Victor noticed that, this year, February is a nice rectangular shape on a calendar (as happens whenever it starts on Sunday in  a non-leap year), and wondered how often this happened.  This is the sort of question where you can easily find out the answer, so he did:

I decided to see if this occurs often so I wrote some code and found out it happens more than I thought.In the past 100 years, there have been 11 Februaries that make a rectangle.

He also noticed that February 13th would be Friday when this happened and wondered how often we got a Friday 13th:

Friday the 13ths also happen more than I thought. In the past 100 years there have been 171 Friday the 13ths, which means there is one to two a year.

This is a Good Thing. We want journalists wondering about patterns and looking up data to check them. We don’t want them being required to call an expert in calendars to give a quote. It’s also a Good Thing that he tells us his expectations were wrong

It would be even better, though, if he’d tried to work out a quantitative guess and tell us. The simplest guess would be that, in the long run, February 1 is a Sunday as often as any other day, and that the 13th of a month is a Friday as often as any other day.  These are natural guesses because there’s no special reason the year or a particular month should start on a particular day of the week. 

In  100 years there are 1200 months, and 1200/7 is 171.4, so it looks as though Friday 13th happens in almost exactly 1/7 of months.  In the past 100 years there are 75 Februaries with 28 days, and 75/7 is 10.7, so 28-day Februaries begin on Sunday almost exactly 1/7 of the time.

You wouldn’t always expect the simplest possible explanation to hold. For example, the date of Passover is set based on the solar and lunar calendars, in a 19-year cycle. Since 7 doesn’t divide 19, you’d expect either that the days of the week didn’t divide up equally or that they took a long time (requiring lots of leap years) to do so.


February 13, 2015

Super 15 Predictions for Round 1

Team Ratings for Round 1

Sorry about the delay in posting these predictions. I have never been really happy with my selection of parameters, so decided to do a massive grid search yesterday which ended up taking about 16 hours. That means this year I have shiny new parameter values for my predictions. As ever, remember the adage, “past performance is not necessarily indicative of future behaviour”.

The basic method is described on my Department home page.

Here are the team ratings prior to this week’s games, along with the ratings at the start of the season.

Current Rating Rating at Season Start Difference
Crusaders 10.42 10.42 0.00
Waratahs 10.00 10.00 0.00
Sharks 3.91 3.91 -0.00
Hurricanes 2.89 2.89 -0.00
Bulls 2.88 2.88 0.00
Chiefs 2.23 2.23 0.00
Brumbies 2.20 2.20 -0.00
Stormers 1.68 1.68 -0.00
Blues 1.44 1.44 0.00
Highlanders -2.54 -2.54 -0.00
Lions -3.39 -3.39 -0.00
Force -4.67 -4.67 0.00
Reds -4.98 -4.98 0.00
Cheetahs -5.55 -5.55 -0.00
Rebels -9.53 -9.53 -0.00


Predictions for Round 1

Here are the predictions for Round 1. The prediction is my estimated expected points difference with a positive margin being a win to the home team, and a negative margin a win to the away team.

Game Date Winner Prediction
1 Crusaders vs. Rebels Feb 13 Crusaders 24.40
2 Brumbies vs. Reds Feb 13 Brumbies 11.20
3 Lions vs. Hurricanes Feb 13 Hurricanes -1.80
4 Blues vs. Chiefs Feb 14 Blues 3.20
5 Sharks vs. Cheetahs Feb 14 Sharks 13.50
6 Bulls vs. Stormers Feb 14 Bulls 5.20
7 Waratahs vs. Force Feb 15 Waratahs 18.70