Posts filed under General (3156)

January 22, 2015

Meet Statistics summer scholar Yiying Zhang

yiyingEvery year, the Department of Statistics offers summer scholarships to a number of students so they can work with staff on real-world projects. Yiying, right, is working on a project called Modelling Competition and Dispersal in a Statistical Phylogeographic Framework with Dr Stéphane GuindonYiying explains.

 “The processes that govern the spatial distribution of species are complex. Traditional approaches in ecology generally rely on the hypothesis that adaptation to the environment is the main force driving this distribution.

“The supervisors of this project propose an alternative explanation that assumes that species are found in certain places simply because they were the first to colonise these locations during the course of evolution. They have recently designed a stochastic model that explains the observed spatial distribution of species using a combination of dispersal events (i.e., species migrating to new territories) and competition between species.

“In this project, I will run in silico [computer] experiments and analyse real data in order to validate the software Phyloland that implements our dispersal-competition model.

“To validate the model, we will randomly generate ‘true value’. Then we will use the model to make estimations of the true value. If the estimated values match the true value relatively closely, then the model is reliable.

“I am doing a BCom/BSc conjoint degree. My majors are Finance, Accounting and Statistics – 2015 is my fourth year. I am planning to do an Honours degree in statistics, so this summer research project is a very valuable experience for me.

“I enjoy statistics because it brings me closer to the real world. Sometimes, things are not simply what we see. Without data, we would never have convincing evidence about what is really happening. The amount of information out there is massive and statistics can help people tell how reliable a statement is. Studying statistics has helped me make better use of information and think more critically.

“My plans for summer include relaxing and reading more books. And having plenty of sleep.”
 

January 21, 2015

Tired foreign drivers

This one makes sense as a possibility

However, road safety campaigner Clive Matthew-Wilson today slammed the new website a “dangerous waste of time”.

He has repeatedly called for tourist drivers to be banned from driving vehicles within 24 hours of arriving in the country.

“Driving tired is as dangerous as driving drunk,” said Mr Matthew-Wilson.

Obviously it matters how tired vs how drunk, but fatigue certainly is unhealthy in drivers.

There’s also the issue that almost 50% of foreign tourists have only come from Australia, not a terribly arduous trip, and that there are almost as many Kiwis returning from Foreign Parts as there are Foreigners visiting. Still, banning car rentals within 24 hours of a sufficiently long flight is something that wouldn’t need to be restricted to foreigners and so wouldn’t require withdrawing from the UN Conventions on Road Traffic.

It would be surprising if tired foreign drivers weren’t at somewhat higher risk of a crash. We’d still want data to see how many crashes we’re talking about. Is this rule going to prevent 10 fatal crashes per year, or 1 per decade?

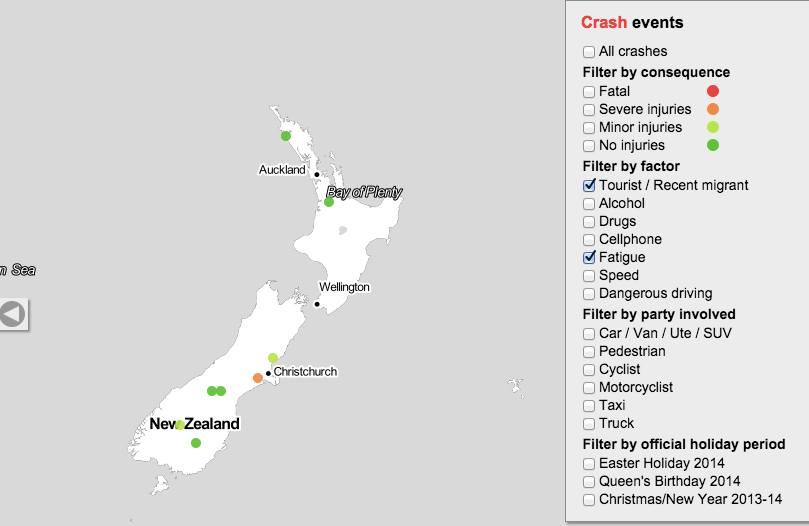
We can get an initial idea from the National Crash Map built by Richard Law and Andrew Parnell and feature in the Herald Data Blog on Christmas Day.

Here are all the crashes from December 2013 to July 2014 where both fatigue and being a foreign driver were judged to be contributing causes. It’s an overestimate, since it includes fatigue from all causes rather than just from recent arrival, and in a multi-car collision even includes fatigue in someone other than the foreign driver. Also, it’s based on police judgment and maybe they overestimate or underestimate fatigue as a cause.

It’s a start.

tired-foreign


Over this eight-month period there were no fatal crashes, one serious-injury crash, and two minor-injury crashes satisfying these criteria.

This is just two-thirds of one year, and a proper analysis would look at the data back to 2007 (or the more-limited data even further back). It’s still more data than the story provided.


Meet Statistics summer scholar Alexander van der Voorn

Alex van der VoornEvery year, the Department of Statistics offers summer scholarships to a number of students so they can work with staff on real-world projects. Alexander, right, is undertaking a statistics education research project with Dr Marie Fitch and Dr Stephanie Budgett. Alexander explains:

“Essentially, what this project involves is looking at how bootstrapping and re-randomisation being added into the university’s introductory statistics course have affected students’ understanding of statistical inference, such as interpreting P-values and confidence intervals, and knowing what can and can’t be justifiably claimed based on those statistical results.

“This mainly consists of classifying test and exam questions into several key categories from before and after bootstrapping and re-randomisation were added to the course, and looking at the change (if any) in the number of students who correctly answer these questions over time, and even if any common misconceptions become more or less prominent in students’ answers as well.

“This sort of project is useful as traditionally, introductory statistics education has had a large focus on the normal distribution and using it to develop ideas and understanding of statistical inference from it. This results in a theoretical and mathematical approach, which means students will often be restricted by the complexity of it and will therefore struggle to be able to use it to make clear inference about the data.

“Bootstrapping and re-randomisation are two techniques that can be used in statistical analysis and were added into the introductory statistics course at the university in 2012. They have been around for some time, but have only become prominent and practically useful recently as they require many repetitions of simulations, which obviously is better-suited to a computer rather than a person. Research on this emphasises how using these techniques allow key statistical ideas to be taught and understood without a lot of fuss, such as complicated assumptions and dealing with probability distributions.

“In 2015, I’ll be completing my third year of a BSc in Statistics and Operations Research, and I’ll be looking at doing postgraduate study after that. I’m not sure why statistics appeals to me, I just found it very interesting and enjoyable at university and wanted to do more of it. I always liked maths at school, so it probably stemmed from that.

“I don’t have any plans to go away anywhere so this summer I’ll just relax, enjoy some time off in the sun and spend time around home. I might also focus on some drumming practice, as well as playing with my two dogs.”

January 19, 2015

10 out of 38 ain’t bad!

From our friends at Simply Stats: A non-comprehensive list of awesome things other people did in 2014. See number 10 of the 36 in particular (aw, thanks, guys) and any one of the many on the list that talks about R and its loin fruit. R was born in the mid-90s at the Department of Statistics at the University of Auckland and has since turned into a monster. I never ever get tired of telling people that. And speaking of R, a feature praising the little letter that did has been published in Nature.


January 15, 2015

Briefly

  • Just one of the unfortunate graphic elements in an infographic dissected at JunkCharts
    6a00d8341e992c53ef01b8d0bf0214970c-250wi
  • The Herald had a story (from the Washington Post) on being married increasing happiness. Frances Woolley explains that ‘happiness’ isn’t really what they measured.
  • Eric Crampton (and Tim Harford) on replacing ‘value of a statistical life’ with ‘microlife’ or ‘micromort‘. That is, rather than saying (as the NZTA does) that preventing a death is worth $4.2 million, say that reducing the risk of a death by one in a million is worth $4.20 per exposed person.
  • “it’s the shiver of noticing” A poem on coincidences at the New Yorker, which (incidentally) gets the statistical point exactly right. (via Harkanwal Singh)
January 7, 2015

98% of what?

On Twitter, I was sent to the headline Wind supplied 98% of Scotland’s household Power in 2014 and other Amazing Green Energy Stories.

That sounds pretty amazing. Nearly all of household electricity from wind. The next question, of course, is “And how much of the commercial and industrial electricity?”

What actually happened was that wind power supplied 40% of Scotland’s electricity last year. That’s still pretty good, but it doesn’t make such a great headline. Since household electricity was 41% of use, if you pretend that all the wind power went to households, you get 98% of household use.

The headline is misleading in the obvious way. It’s also misleading in a non-obvious way: one of the problems with wind power is that it’s generated when the wind blows, not on demand. If the power grid were set up so that household electricity was a thing, you couldn’t reasonably supply 98% of household power from wind alone.

The figure seems to come from WWF Scotland

Wind turbines provided an estimated 8,958,130MWh of electricity to the National Grid, or an average of 746,510MWh each month – enough to supply the electrical needs of 98% of Scottish households, or 2.36 million homes.

Most people who reported it didn’t go as far as the headline I quoted; on the other hand, most people didn’t pass on the data that lets you work out the real proportion.


January 6, 2015

Getting to work

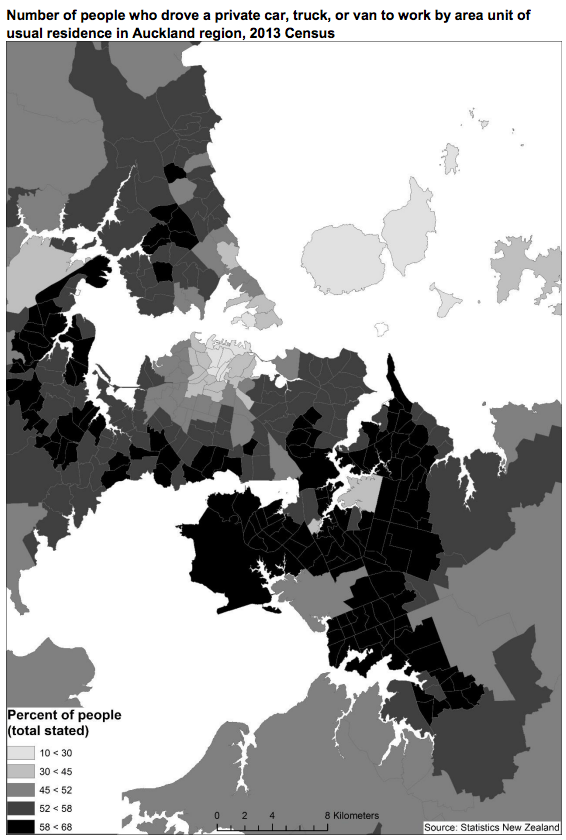
From a new StatsNZ report on commuting in Auckland, based on the last Census.  Qualitatively, people drive to work from where you’d expect. Quantitatively, there’s been a bit of increase in public transport use.

commute-map

Commuting patterns is an example of where an interactive map would be helpful for visualisation.

(via @polemic and @DarrenDavis10 on Twitter)

December 31, 2014

Duck! Here comes another year.

This year the visits to StatsChat have been about 1/3 for rugby prediction, about 1/3 for other posts, and about 1/3 for the home page. We had a slight increase in page views over last year.

Some specific things I’d like to highlight:

December 30, 2014

Briefly

  • From Matt Levine at Bloomberg View, a good example of why multidimensional visualisation is interesting, and easy to get wrong: If you’ve ever dreamed of being able to “process financial information easily without ever seeing a single number or percentage,” then you are mad, but also someone has built a thing for you. You wear it on your face and walk around looking at your stock portfolio; be careful not to trip over Radio Shack!
December 26, 2014

Safety and effectiveness in data mining

New medications have to demonstrate safety and effectiveness before they are marketed. Showing effectiveness is usually fairly straightforward, if slow and expensive. Safety is more difficult, because it’s mostly about uncommon events, edge cases, interactions.

Automated decisions based on data mining and algorithms have a similar problem.  It’s fairly easy to make sure they do what you intended them to do. It’s much harder to make sure they don’t also do things you didn’t think of.

Sometimes this is just human error, like the problems with RepricerExpress rules that led UK small businesses to post prices as low as 1p for goods on Amazon before Christmas, leading to massive losses. Sometimes it’s an algorithm than optimises the wrong thing.

Eric Meyer has written a post about Facebook’s “Year in Review”, which (repeatedly) pops up a picture in his feed saying “Eric, here’s what your year looked like!”. The algorithm is right. Horribly right.

But for those of us who lived through the death of loved ones, or spent extended time in the hospital, or were hit by divorce or losing a job or any one of a hundred crises, we might not want another look at this past year.

If I could fix one thing about our industry, just one thing, it would be that: to increase awareness of and consideration for the failure modes, the edge cases, the worst-case scenarios.  And so I will try.