Posts filed under General (3156)

April 10, 2014

Frittering away

Q: Did you see that “some generation Y foodies are spending up to $600 a week on gourmet produce such as seafood, cheeses, olives and cured hams.”

A: In the Herald? Yes.

Q: Is it true?

A: Slightly.

Q: Who are these people?

A: Well, for a start, they’re Australians

Q: Oh. How many is “some”

A: At least one.

Q: No, seriously, how many?

A: 1% of a the 18-34 subset of a sample of ‘over’ 1000. Here’s the full report

Q: How many is that?

A: Maybe three in the sample?

Q: Three people or three households?

A: A good question. They don’t say, though the average weekly food expenditure in their sample looks reasonably close to the national household average that they cite.

Q: How were the people sampled?

A: They don’t say.

Q: How many were Generation Y?

A: They don’t say

Q: How did they even define ‘gourmet food’? Or don’t they say that either?

A: Sadly, no.

Q: This report doesn’t seem to follow the code of practice you blogged about recently, does it?

A: That was just for political polls, and anyway this report is Australian.

Q: Is there anything else you want to complain about in the report?

A: If  you call it an “Inaugural” report you really can’t use it to conclude “Australians are becoming a more food savvy nation”.
 

April 9, 2014

Briefly

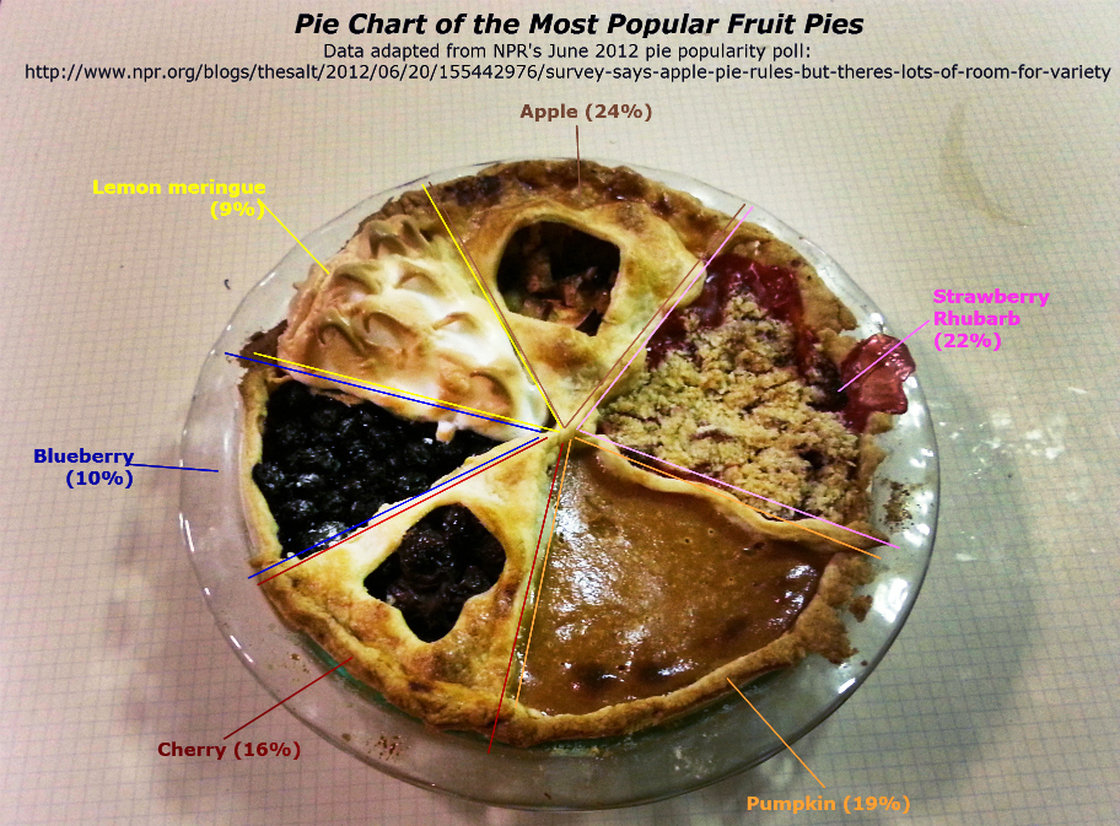
Pie chart edition

piechartpie_custom-04484aacfec019c8444fa1b42dbdb33f71b80ed9-s40-c85

April 8, 2014

Busable Auckland

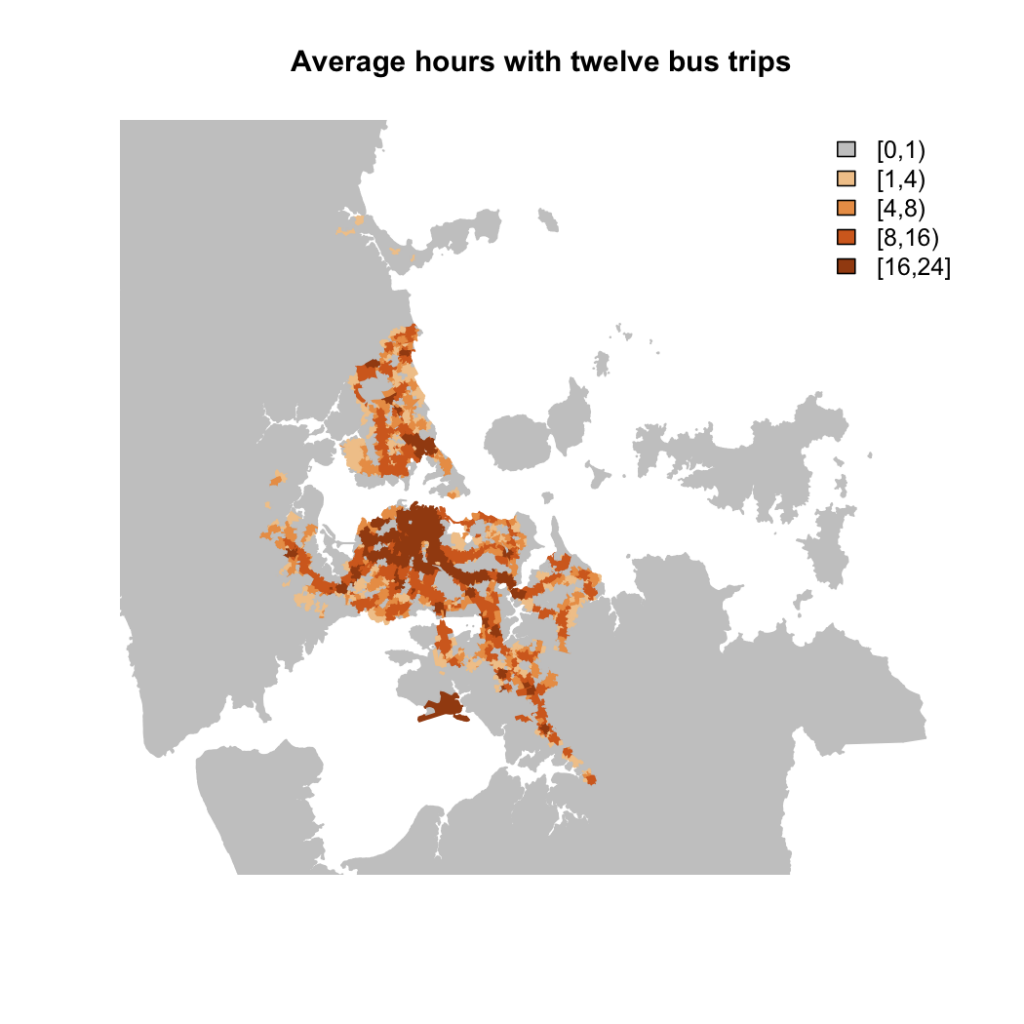
Bus commuter services can be very useful in reducing traffic and parking congestion in the city center, but reducing the average number of cars per household requires buses that are available all the time. I used the Auckland Transport bus schedule data and the new StatsNZ meshblock data and boundary files

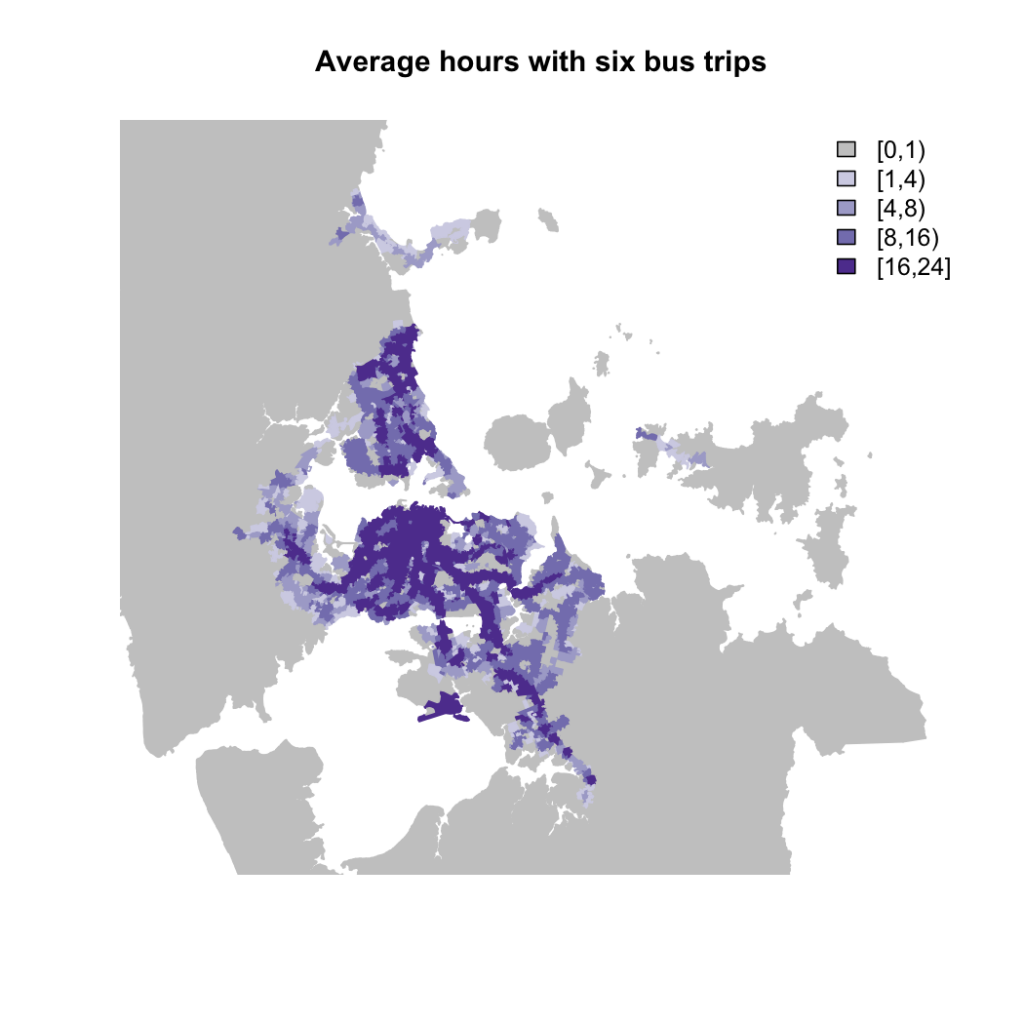
Here’s a map of Auckland showing how many hours per day (on average) there are at least six bus trips per hour stopping within 500m of each meshblock (actually, within 500m of the ‘label point’ for the meshblock).

On a single road, six trips per hour is one trip in each direction every twenty minutes. The dark purple area has this level of service at least 16 hours a day on average. (Click for the honking great PDF version.)

bus6png

For twelve trips per hour (eg, one every twenty minutes on two different routes) the area shrinks a lot

bus12png

The reason for using meshblocks in the map is that we can merge the bus files with the census files. For example, for Auckland as a whole, 50% of the population is in the grey busless emptiness, 17% in the 8-16 hour tolerable zone, and 12% in the pretty reasonable 16+ hour zone.   People of Maori descent are more likely to be unbused (60%) and less likely to be well bused (8%), as are people over 65 (60% in the lowest category, 9% in the highest).

Recent (<10 years) migrants like transit: 18% of us are in the good bus category and only 40% in the busless category.

On talking to people

April 7, 2014

Stat of the Week Winner: March 29 – April 4 2014

Congratulations to Myles Thomas who is our Stat of the Week winner this week for nominating the following poll question:

“Statistic: In the latest 3 News-Reid Research poll, when asked if David Cunliffe’s actions were worthy of a Prime Minister, 65 percent of voters, almost two-thirds, said “no”, while only 27 percent said “yes”.

As Russell Brown points out – this question is ludicrous. What does that even mean? That people think he’s not fit to be Prime Minister? That it was an unworthy action of someone who aspired to be Prime Minister one day? It’s actually a hard question for even a Cunliffe supporter to answer “yes” to. As a bit of emotional framing it works well, as a research question it’s bullshit.

This seems to be a news company engaging in dodgy push-polling and the claiming the inevitable but meaningless result is news. Wrong on several levels.”

April 4, 2014

Thomas Lumley’s latest Listener column

…”One of the problems in developing drugs is detecting serious side effects. People who need medication tend to be unwell, so it’s hard to find a reliable comparison. That’s why the roughly threefold increase in heart-attack risk among Vioxx users took so long to be detected …”

Read his column, Faulty Powers, here.

April 2, 2014

NRL Predictions for Round 5

Team Ratings for Round 5

The basic method is described on my Department home page. I have made some changes to the methodology this year, including shrinking the ratings between seasons.

Here are the team ratings prior to this week’s games, along with the ratings at the start of the season.

Current Rating Rating at Season Start Difference
Roosters 10.04 12.35 -2.30
Sea Eagles 7.46 9.10 -1.60
Bulldogs 5.96 2.46 3.50
Storm 4.26 7.64 -3.40
Rabbitohs 3.70 5.82 -2.10
Knights 3.68 5.23 -1.50
Cowboys 2.49 6.01 -3.50
Broncos -0.06 -4.69 4.60
Titans -0.45 1.45 -1.90
Panthers -1.49 -2.48 1.00
Warriors -2.62 -0.72 -1.90
Sharks -4.35 2.32 -6.70
Raiders -4.46 -8.99 4.50
Dragons -5.00 -7.57 2.60
Wests Tigers -8.05 -11.26 3.20
Eels -12.89 -18.45 5.60


Performance So Far

So far there have been 32 matches played, 14 of which were correctly predicted, a success rate of 43.8%.

Here are the predictions for last week’s games.

Game Date Score Prediction Correct
1 Roosters vs. Sea Eagles Mar 28 0 – 8 10.40 FALSE
2 Dragons vs. Broncos Mar 28 20 – 36 3.00 FALSE
3 Warriors vs. Wests Tigers Mar 29 42 – 18 6.80 TRUE
4 Eels vs. Panthers Mar 29 32 – 16 -11.70 FALSE
5 Bulldogs vs. Storm Mar 29 40 – 12 1.60 TRUE
6 Rabbitohs vs. Raiders Mar 30 18 – 30 17.70 FALSE
7 Knights vs. Sharks Mar 30 30 – 0 8.80 TRUE
8 Titans vs. Cowboys Mar 31 13 – 12 1.80 TRUE


Predictions for Round 5

Here are the predictions for Round 5. The prediction is my estimated expected points difference with a positive margin being a win to the home team, and a negative margin a win to the away team.

Game Date Winner Prediction
1 Roosters vs. Bulldogs Apr 04 Roosters 8.60
2 Broncos vs. Eels Apr 04 Broncos 17.30
3 Sharks vs. Warriors Apr 05 Sharks 2.80
4 Panthers vs. Raiders Apr 05 Panthers 7.50
5 Dragons vs. Rabbitohs Apr 05 Rabbitohs -4.20
6 Storm vs. Titans Apr 06 Storm 9.20
7 Wests Tigers vs. Sea Eagles Apr 06 Sea Eagles -11.00
8 Cowboys vs. Knights Apr 07 Cowboys 3.30


Big data: are we making a big mistake?

Just a quick pointer to a nice opinion piece by the Financial Times’ “Undercover Economist” and star of BBC Radio 4’s excellent “More or Less” podcast, Tim Harford. Tim very nicely argues that in the hype over big data, stories of the failures of simplistic, correlation driven approaches rarely get airtime, and hence we get a misleading impression about the efficacy of these techniques.

March 28, 2014

Briefly

Reader request edition

  • Margin of error. The Herald has a reasonable story on public opinion about Labour’s baby-bonus plan. It would have been good to say what the margin of error was for the difference between men and women, since that was the headline. If the gender split was about 50:50 the margin of error for that difference is going to be just over 7%, and the observed difference was 8%. The headline is ok, but that’s the sort of calculation someone should have done, and having done, should have reported. We already have doubts about this particular poll, though. (via @danylmc)


  • The New Republic thinks sunglasses make you less moral and advises against them, based on the fact that masks are used for anonymity and that undergraduates in a psych experiment gave away an average of 90c less when they were wearing sunglasses.  The data on benefits of sunglasses are somewhat better founded. (via @juha_saarinen)
March 27, 2014

NRL Predictions for Round 4

Team Ratings for Round 4

The basic method is described on my Department home page. I have made some changes to the methodology this year, including shrinking the ratings between seasons.

Here are the team ratings prior to this week’s games, along with the ratings at the start of the season.

Current Rating Rating at Season Start Difference
Roosters 11.68 12.35 -0.70
Storm 6.54 7.64 -1.10
Rabbitohs 6.24 5.82 0.40
Sea Eagles 5.81 9.10 -3.30
Bulldogs 3.68 2.46 1.20
Cowboys 2.39 6.01 -3.60
Knights 1.81 5.23 -3.40
Panthers 0.89 -2.48 3.40
Titans -0.35 1.45 -1.80
Broncos -1.76 -4.69 2.90
Sharks -2.48 2.32 -4.80
Dragons -3.31 -7.57 4.30
Warriors -4.17 -0.72 -3.50
Wests Tigers -6.50 -11.26 4.80
Raiders -7.00 -8.99 2.00
Eels -15.28 -18.45 3.20


Performance So Far

So far there have been 24 matches played, 10 of which were correctly predicted, a success rate of 41.7%.

Here are the predictions for last week’s games.

Game Date Score Prediction Correct
1 Wests Tigers vs. Rabbitohs Mar 21 25 – 16 -12.00 FALSE
2 Broncos vs. Roosters Mar 21 26 – 30 -10.20 TRUE
3 Panthers vs. Bulldogs Mar 22 18 – 16 1.60 TRUE
4 Sharks vs. Dragons Mar 22 12 – 14 7.10 FALSE
5 Cowboys vs. Warriors Mar 22 16 – 20 14.40 FALSE
6 Sea Eagles vs. Eels Mar 23 22 – 18 30.10 TRUE
7 Raiders vs. Titans Mar 23 12 – 24 0.10 FALSE
8 Storm vs. Knights Mar 24 28 – 24 10.50 TRUE


Predictions for Round 4

Here are the predictions for Round 4. The prediction is my estimated expected points difference with a positive margin being a win to the home team, and a negative margin a win to the away team.

Game Date Winner Prediction
1 Roosters vs. Sea Eagles Mar 28 Roosters 10.40
2 Dragons vs. Broncos Mar 28 Dragons 3.00
3 Warriors vs. Wests Tigers Mar 29 Warriors 6.80
4 Eels vs. Panthers Mar 29 Panthers -11.70
5 Bulldogs vs. Storm Mar 29 Bulldogs 1.60
6 Rabbitohs vs. Raiders Mar 30 Rabbitohs 17.70
7 Knights vs. Sharks Mar 30 Knights 8.80
8 Titans vs. Cowboys Mar 31 Titans 1.80