Posts filed under General (3156)

December 11, 2013

Briefly

And these three men, Noah, Daniel, and Job were in it, and all the abominations that be done in (log n) steps.

December 10, 2013

It’s all in the definition

The most-read story on the NZ Herald right now is “Cost of home dream in Auckland – 19 incomes. Only six months ago, the NZ Herald published an infographic which showed that a median house costs 6.9 times the annual median household income in Auckland. It’s enough to make anyone confused.

The new article says:

“It would take 19 median incomes in Auckland to buy a home for the city’s median house price.

In the 1,119,195 Census forms filled out for Auckland, the median annual income was $29,600, a Herald analysis found.”

I checked with the Stats NZ Census figures (Excel spreadsheet) and found the $29,600 figure is for the usually resident population count aged 15 years and over. In other words, this includes everyone who is not in paid employment: all the students, retirees, parents who are staying at home, those on benefits and not working etc.

Using Statistics New Zealand’s income survey data for the June 2013 quarter (Excel spreadsheet), the median earnings for people in paid employment was $45,864. This figure is only from those earning wages and salaries and/or self-employment income.

Strictly speaking, the median house price we’re comparing to should be for the same period but for now, I’m using the June 2013 median Auckland house price from the Real Estate Institute (PDF): $555,000.

This means the statement could be revised to:

“It would take 12 median incomes in Auckland to buy a home for the city’s median house price.”

However, this misses the point that the accepted method is to look at median household incomes. Statistics New Zealand recommends a more complex calculation:

The ratio of housing cost to income is often used as a way of measuring affordability. Here, the ratio is calculated as housing cost as a proportion of disposable household income (income after tax). A housing cost to income ratio of 25 percent has been used as a threshold for the purpose of comparing groups. This threshold is widely used both nationally and internationally.

Again, using Statistics New Zealand’s income survey data for the June 2013 quarter, the median household income was $70,616 for the Auckland region (NZ.STAT tool).

This means the statement could be revised to:

“It would take 7.9 median household incomes in Auckland to buy a home for the city’s median house price.”

Comparing simple figures from New Zealand with overseas without taking into consideration tax and the cost of living really isn’t meaningful. Further, the mixing of means and medians means that they are not comparing like with like…

It’s easy to use figures to make things seem much worse than they actually are.
December 6, 2013

If New Zealand were a village of 100 people ….

… according to the 2013 Census figures,

  • 51 would be female, 49 male.
  • 70 would be European, 14 Maori and 11 Asian.
  • 24 would have been born overseas
  • 21 would have a tertiary qualification
  • 4 would be unemployed.
  • 4 would earn over $100,000

Statistics New Zealand has done a nice graphic of the above, too. Full 2013 Census info available here.


Reports about young women and binge-drinking: a caution

Local media have been proclaiming that younger women are binge-drinking themselves into oblivion, (examples here and here),  many of these stories leaning on Canadian journalist and recovering alcoholic Ann Dowsett Johnston’s book Drink: The Intimate Relationship Between Women and Alcohol.  She says the percentage of college students who binge drink, using the measure of consuming five or more drinks in one sitting, was nearly 45% in 2011, and repeated this in a recent Wall Street Journal item called The New Face of Risky Drinking is Female.

However, there is an editor’s note at the bottom of her piece (that probably should be at the top), pointing out that Johnston got her compelling  figure by combining the results  of two separate studies carried out in different years.

The  non-profit, non-partisan Statistical Assessment Service (STATS) in the US points out that a basic tenet of Statistics 101 is that one should never directly compare survey results that come from different populations or that were provided from surveys taken with different methods, even if the surveys are angling for the same kind of data.  Surveys can return different results for a variety of reasons, from the time of year in which they are administered, to the population from which participants are chosen, and even to how the questions are asked. In this case, it says, both surveys  have systematic biases that come from their survey methods, which in turn makes direct comparisons problematic. See its useful analysis of the situation here.


December 5, 2013

My head hurts. I need my 61st cup of coffee.

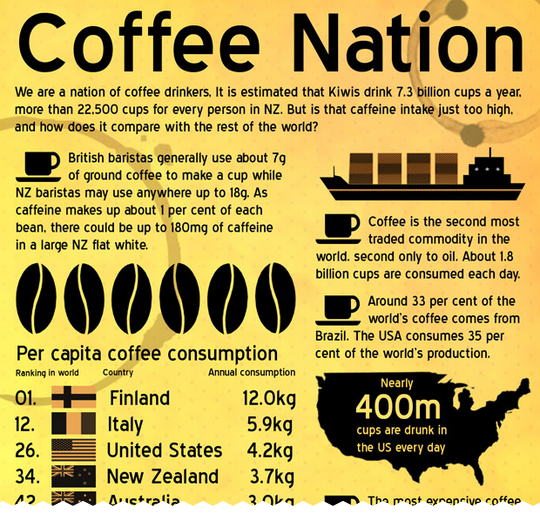
I was sent a link by Whale Oil to this “awesome” infographic over on the NZ Herald:

coffee-infographic

For a while, I just couldn’t figure out how on earth they calculated that Kiwis each drink an average of 22,500 cups a year, which equates to over 61 cups of coffee a day!

The 3.7kg of coffee a year figure in the infographic comes from Wikipedia.

However, if you Google “coffee facts New Zealand”, the third result is this page which contains those figures of 7.3 billion cups of year and 22,500 cups per person. The page appears to have been written back in 2009. I guess this is how research is done these days.

Update: The infographic has been edited to remove those figures.

December 3, 2013

Silliness on both sides in the Waikato fluoride stoush

The anti-fluoride Fluoride Action Network has accused the Waikato Times of reversing the results of an online poll that asked whether people supported the council’s move to defer re-fluoridating the city’s water supply until a High Court legal challenge  is decided.

What the Waikato Times did or didn’t do is immaterial. Folks, the paper ran a self-selecting online poll, which makes its results utterly meaningless.

The best poll we have on this is October’s non-binding referendum. It showed that nearly 70% of Hamilton voters favoured water fluoridation.

November 29, 2013

Boris: not good enough

The Mayor of London, Boris Johnson, on equality:

‘It is surely relevant to a conversation about equality that as many as 16 per cent of our species have an IQ below 85,’ before facetiously asking the audience if anyone had a low IQ.

Now, there are lots of problems with the over-intepretation of IQ as a predictor of economic success.  There are problems with the definition of IQ from factor analysis: positive correlations between test results will lead to an apparent single factor explaining them, even when this about as untrue as possible.

But that’s not the most egregious statistical point. IQ, because it’s a hypothetical reconstruction, not a directly measured thing, doesn’t have any intrinsic values.  When you design tests to estimate intelligence, you can choose to scale the mean and spread of the distribution to be whatever you like. The people who designed IQ chose to set the mean at 100 and the standard deviation at 15.  That doesn’t tell you anything about how variable intelligence is between people, it’s just a choice of scaling, part of the definition of IQ.

Boris’s observation that 16% of people have an IQ below 85, then, is absolutely content-free. It’s like saying our schools are bad because 50% are below the median, or that NZ rugby teams aren’t very good because only one of them holds the Ranfurly Shield. The fact that more than 1 in 7 people is below the 16th percentile is, actually, not at all relevant to a conversation about equality.

November 26, 2013

Briefly

  • UK government “Behavioural Insights Team” wins a government innovation award for using randomisation to test more effective tax reminder letters.
  • David Spiegelhalter is Unhappy with the UK Press Complaints Commission
  • Crowdsourcing‘ gives fast, detailed interpretation of satellite images from Philippines, to provide information about typhoon damage.
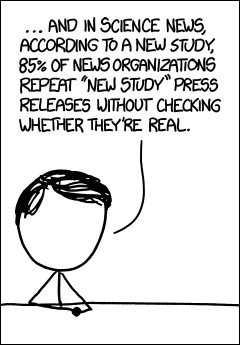
  • XKCD

(not that bloggers are necessarily any better)

November 23, 2013

Official statistics

Government statistics of an unusual kind, from CNTV, via Blood & Treasure

They’re local officials from remote Qingshuihe County in Xinjiang Uyghur Autonomous Region who don’t have time to even blink as they each count about 10,000 sheep a day. They’re here to make sure there’s never gridlock on the sheep highway through the river valley and the pastures aren’t grazed bald.


November 22, 2013

Briefly