Posts filed under General (3156)

November 11, 2013

Data-based journalism

Data journalism can range from ordinary journalism carried out with enough numeracy to use published data, to informative and insightful displays of information, to analysis, searching and linkage that wouldn’t be possible without computers.

The Herald and Keith Ng have an example of the last type: an analysis of New Zealand’s property records to find property owned by MPs but not declared in the Register of Pecuniary Interests. Property ownership records let you find out who owns a particular piece of land. They aren’t set up to let you go the other way and ask what property is owned by a particular individual, but computers can easily solve that sort of problem by brute force. There are other complications, since land might well be owned by a trust, not by the MP personally; these increase the effort, but don’t make it impossible.  It doesn’t seem that the omissions in reporting violate the law — if the MPs were really trying to hide their holdings, they’d do a much better job — but it exposes a loophole.

This sort of search requires doing things to large, probably messy databases, but it also requires manual verification of all the findings, and the involvement of someone who can ask public figures for explanations — if the Herald asks questions and they don’t get answers, that’s news.

November 10, 2013

Data visulisation (with cartoons and video)

From Fresh Spectrum,

The natural constraints of a paper journal didn’t give me an opportunity to dive into the practical side of the subject, but that’s why it’s nice to have a blog. This post is the first in a series I have planned on data visualization. Call it an introduction to interactivity, hope you like it.

The basic reason for interactivity: not everyone wants the same numbers


Typhoon Haiyan context

There are reports that as many as 10,000 people may have died on the Philippine island of Leyte on Friday, drowned in the storm surge or killed by collapsing buildings.

Leyte is roughly comparable in size and population to the Auckland Region (about 40% larger). Fewer than 8000 people died in Auckland in all of 2012.

A disaster

November 7, 2013

Just wrong enough to sound convincing

From Saturday Morning Breakfast Cereal: The top six reasons your infographic is just wrong enough to sound convincing

smbc-infog

Are we headed for universal genome screening at birth?

From the Genetic Literacy Project:

“Up till now, newborn screening has not been done by looking directly at an infant’s genes. Instead researchers check a tiny drop of blood taken from a baby’s heel for certain biochemical markers. These markers indirectly reveal the presence of abnormalities that can be treated effectively early in life.

“That indirect approach could change, depending on the results of four new pilot projects funded by the US National Institutes of Health. The projects are studying whether extending newborn screening to studying the genes themselves makes medical—and ethical—sense.”

Read the whole post here.


November 5, 2013

Briefly

November 1, 2013

Science journalism training

A new Australian website with information for journalists about good science journalism

The bulk of journalists entering undergraduate and postgraduate courses in journalism come from an arts and humanities background and can find reporting complex science stories a challenge.

To address this challenge, an expert working group—comprised of some of Australia’s top science journalists and science communicators—published a report in 2011 with recommendations to support journalists who report science. 

One of the recommendations in the report—Science and the media: From ideas to action—was to “Develop a unit on reporting research that can be incorporated into undergraduate journalism courses“.

The group felt that the accuracy of reporting on key science issues could be improved if journalists are given some basic training in reporting on research findings during their undergraduate degree. This could include training on how to assess the credibility of experts, understanding the peer review process and making sense of scientific reports and basic statistics. This training is applicable across a wide spectrum of news stories and would be beneficial for all journalists not just those wanting to work on a science round.

They currently have six modules:


(via the NZ Science Media Centre)

What matters about numbers in the news

From Felix Salmon at Reuters

Let’s say that you saw various news reports about an event, and that different words were used to describe the weather: some said it was “cold”, others “brisk”, others “frosty”, others “wintry”, and so on. You wouldn’t raise an eyebrow: you’d see that they were all describing the same thing, in slightly different language, and you wouldn’t demand an explanation for the “discrepancy”. Well, numbers in news articles behave like words: they’re trying to describe the state of the world. That’s why the NYT has banned the use of “record” or “largest” unless inflation is taken into account. What matters is not the mathematical relationship between abstract numbers, but rather the state of the world that is being described.

Go and read the whole thing.

October 31, 2013

A statistic for the Day of the Dead

Remember the shootings at Sandy Hook elementary school in Newtown, Connecticut last December?

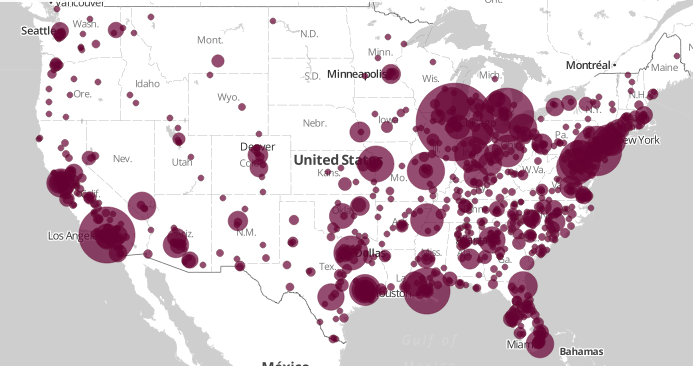
Since then, Slate magazine has been collecting news reports of gun deaths in the US. Here’s a map.

gundeaths


Actually, that’s a map of just the 1000 locations with the most deaths.

As of today, they have 10,001 deaths with the place and the name of victim known. That’s going to be an underestimate, since some don’t make the news. And since the number doesn’t include suicides, who make up about 60% of gun deaths in the US according to the CDC.  These mostly aren’t mass shootings, so they don’t attract international attention, but there are about as many gun deaths as car deaths in the US.

It’s not simply a matter of number of guns: the US has about 3.5 times the number of guns per capita as New Zealand, but about seven times the gun death rate per capita (nearly ten times the rate if you don’t include suicides).  It may be more that for a lot of people in the US, an important reason to own a gun is so that you would be able shoot another person with it if the circumstances arose. In a recent survey by Pew Research, 48% of gun owners gave self-protection as their main reason for owning a gun, and 79% said owning a gun made them feel safer. I can’t find figures for NZ, but I’d expect hunting and target shooting to be more common reasons here.

October 30, 2013

Briefly

  • The Legatum Prosperity Index ranks countries on a range of domains including economy, health, governance, social capital.  In their 2013 report NZ comes in 5th, and the top country in the Asia/Pacific.   Apparently, about a quarter of Kiwis believe there is widespread business or government corruption, and this is less than the figure almost everywhere else (Denmark is the exception)
  • A post on risk communication in the recent UK storm, from Ross Anderson, a computer security expert.
  • I have heard people comparing the UK storm to the recent Wellington storm, which didn’t cause any deaths despite stronger winds. Note that the UK storm killed roughly  one in twenty million of the UK population. In Wellington the same mortality rate would be about 0.01 people.
  • The Herald tells us Texting, reading magazines, eating and applying makeup are among the top 10 driver distractions, an AA Insurance survey has found.”  Looking at the press release, AA asked about twelve distractions. Eleven of them ended up in the top ten, so the list can’t be very sensitive to respondent opinion.