Posts filed under Research (206)

April 18, 2016

Being precise

regional1

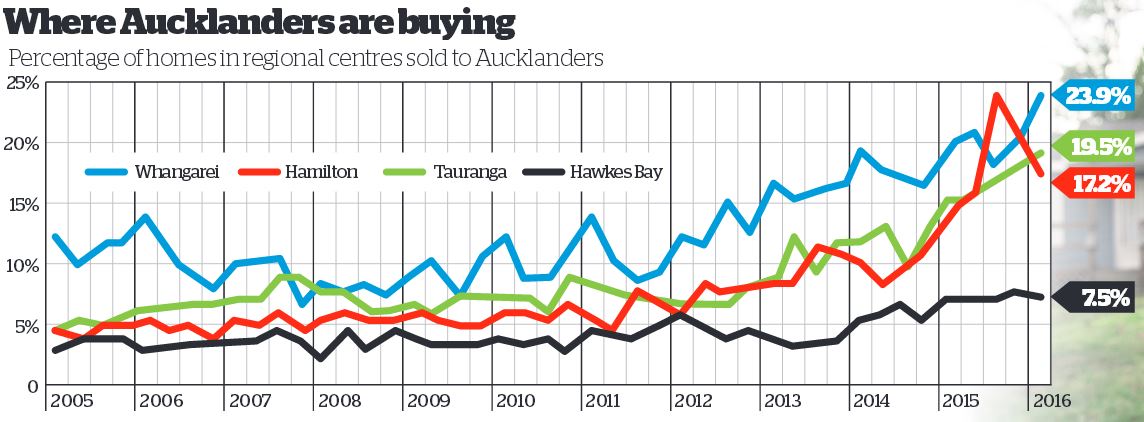
There are stories in the Herald about home buyers being forced out of Auckland by house prices, and about the proportion of homes in other regions being sold to Aucklanders.  As we all know, Auckland house prices are a serious problem and might be hard to fix even if there weren’t motivations for so many people to oppose any solution.  I still think it’s useful to be cautious about the relevance of the numbers.

We don’t learn from the story how CoreLogic works out which home buyers in other regions are JAFAs — we should, but we don’t. My understanding is that they match names in the LINZ title registry.  That means the 19.5% of Auckland buyers in Tauranga last quarter is made up of three groups

  1. Auckland home owners moving to Tauranga
  2. Auckland home owners buying investment property in Tauranga
  3. Homeowners in Tauranga who have the same name as a homeowner in Auckland.

Only the first group is really relevant to the affordability story.  In fact, it’s worse than that. Some of the first group will be moving to Tauranga just because it’s a nice place to live (or so I’m told).  Conversely, as the story says, a lot of the people who are relevant to the affordability problem won’t be included precisely because they couldn’t afford a home in Auckland.

For data from recent years the problem could have been reduced a lot by some calibration to ground truth: contact people living at a random sample of the properties and find out if they had moved from Auckland and why.  You might even be able to find out from renters if their landlord was from Auckland, though that would be less reliable if a property management company had been involved.  You could do the same thing with a sample of homes owned by people without Auckland-sounding names to get information in the other direction.  With calibration, the complete name-linkage data could be very powerful, but on its own it will be pretty approximate.
 

April 17, 2016

Evil within?

The headlineSex and violence ‘normal’ for boys who kill women in video games: study. That’s a pretty strong statement, and the claim quotes imply we’re going to find out who made it. We don’t.

The (much-weaker) take-home message:

The researchers’ conclusion: Sexist games may shrink boys’ empathy for female victims.

The detail:

The researchers then showed each student a photo of a bruised girl who, they said, had been beaten by a boy. They asked: On a scale of one to seven, how much sympathy do you have for her?

The male students who had just played Grand Theft Auto – and also related to the protagonist – felt least bad for her. with an empathy mean score of 3. Those who had played the other games, however, exhibited more compassion. And female students who played the same rounds of Grand Theft Auto had a mean empathy score of 5.3.

The important part is between the dashes: male students who related more to the protagonist in Grand Theft Auto had less empathy for a female victim.  There’s no evidence given that this was a result of playing Grand Theft Auto, since the researchers (obviously) didn’t ask about how people who didn’t play that game related to its protagonist.

What I wanted to know was how the empathy scores compared by which game the students played, separately by gender. The research paper didn’t report the analysis I wanted, but thanks to the wonders of Open Science, their data are available.

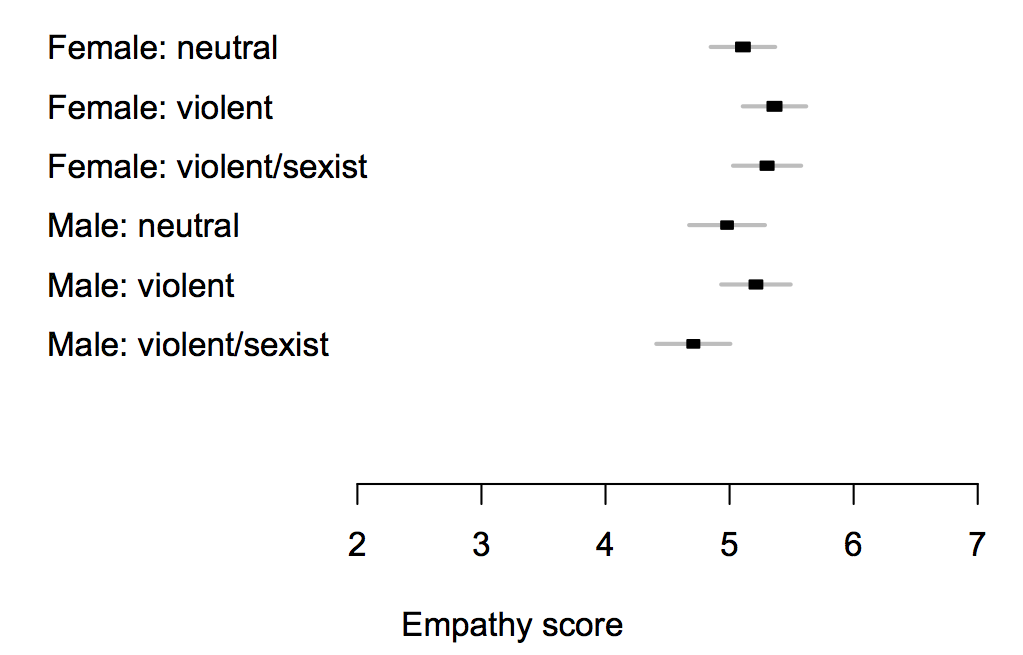
If you just compare which game the students were assigned to (and their gender), here are the means; the intervals are set up so there’s a statistically significant difference between two groups when their intervals don’t overlap.

gtamean

The difference between different games is too small to pick out reliably at this sample size, but is less than half a point on the scale — and while the ‘violent/sexist’ games might reduce empathy, there’s just as much evidence (ie, not very much) that the ‘violent’ ones increase it.

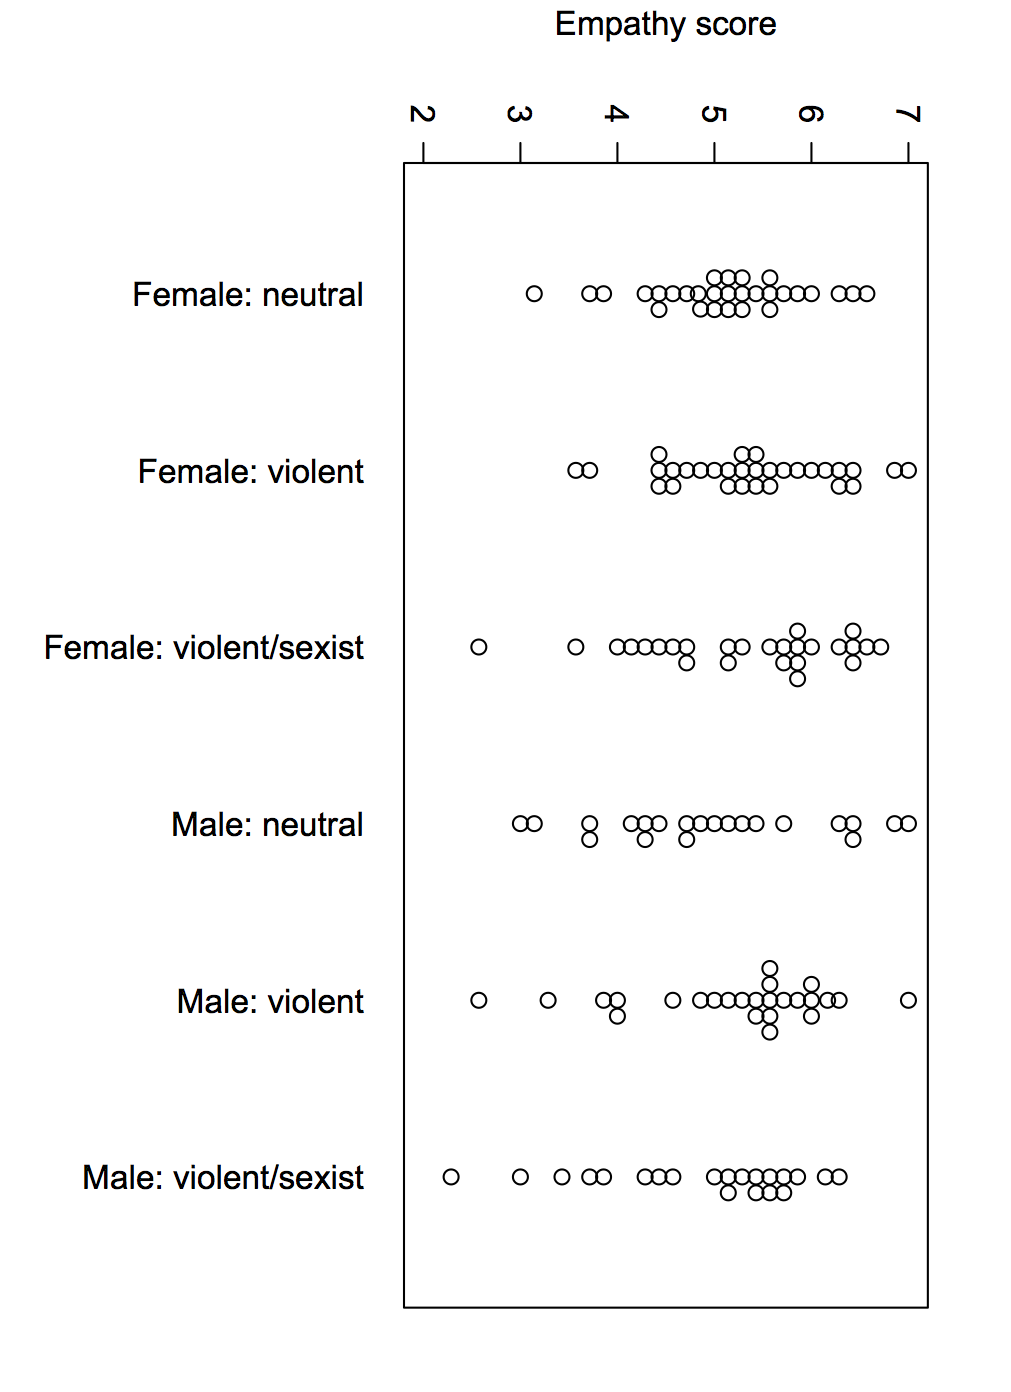
Here’s the complete data, because means can be misleading

gtaswarm

The data are consistent with a small overall impact of the game, or no real impact. They’re consistent with a moderately large impact on a subset of susceptible men, but equally consistent with some men just being horrible people.

If this is an issue you’ve considered in the past, this study shouldn’t be enough to alter your views much, and if it isn’t an issue you’ve considered in the past, it wouldn’t be the place to start.

March 24, 2016

The fleg

Two StatsChat relevant points to be made.

First, the opinion polls underestimated the ‘change’ vote — not disastrously, but enough that they likely won’t be putting this referendum at the top of their portfolios.  In the four polls for the second phase of the referendum after the first phase was over, the lowest support for the current flag (out of those expressing an opinion) was 62%. The result was 56.6%.  The data are consistent with support for the fern increasing over time, but I wouldn’t call the evidence compelling.

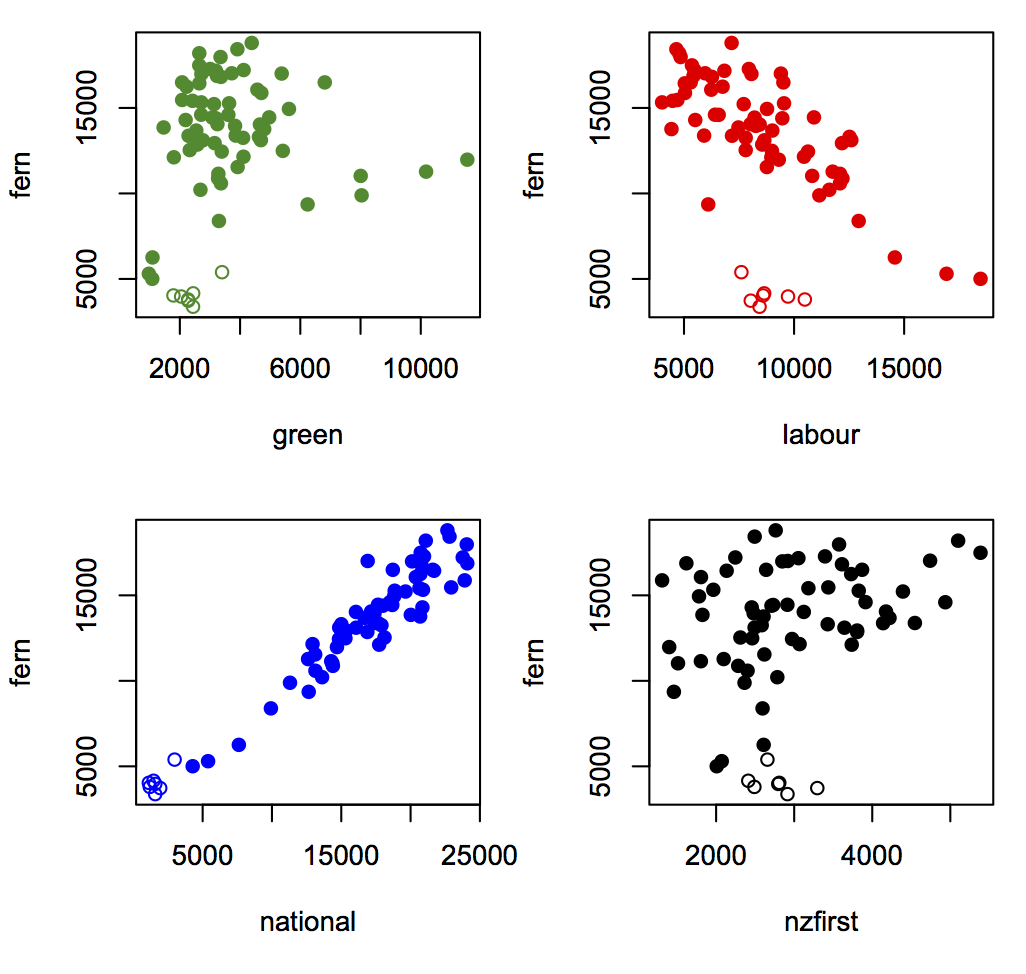
Second, the relationship with party vote. The Herald, as is their wont, have a nice interactive thingy up on the Insights blog giving results by electorate, but they don’t do party vote (yet — it’s only been an hour).  Here are scatterplots for the referendum vote and main(ish) party votes (the open circles are the Māori electorates, and I have ignored the Northland byelection). The data are from here and here.

fleg

The strongest relationship is with National vote, whether because John Key’s endorsement swayed National voters or whether it did whatever the opposite of swayed is for anti-National voters.

Interestingly, given Winston Peters’s expressed views, electorates with higher NZ First vote and the same National vote were more likely to go for the fern.  This graph shows the fern vote vs NZ First vote for electorates divided into six groups based on their National vote. Those with low National vote are on the left; those with high National vote are on the right. (click to embiggen).
winston

There’s an increasing trend across panels because electorates with higher National vote were more fern-friendly. There’s also an increasing trend within each panel, because electorates with similar National vote but higher NZ First vote were more fern-friendly.  For people who care, yes, this is backed up by the regression models.


Two cheers for evidence-based policy

Daniel Davies has a post at the Long and Short and a follow-up post at Crooked Timber about the implications for evidence-based policy of non-replicability in science.

Two quotes:

 So the real ‘reproducibility crisis’ for evidence-based policy making would be: if you’re serious about basing policy on evidence, how much are you prepared to spend on research, and how long are you prepared to wait for the answers?

and

“We’ve got to do something“. Well, do we? And equally importantly, do we have to do something right now, rather than waiting quite a long time to get some reproducible evidence? I’ve written at length, several times, in the past, about the regrettable tendency of policymakers and their advisors to underestimate a number of costs; the physical deadweight cost of reorganisation, the stress placed on any organisation by radical change, and the option value of waiting. 

March 9, 2016

Not the most literate?

The Herald (and/or the Otago Daily Times) say

 New Zealand is the fifth most literate country in the world.

and

New Zealand ranked higher than Germany (9), Canada (10), the US (11), UK (14) and Australia (15).

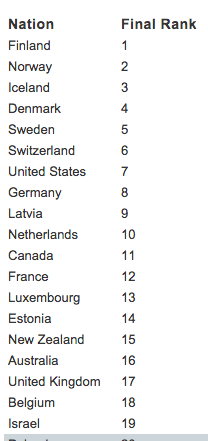
Newshub had a similar story and the NZEI welcomed the finding.  One of the nice things about the Herald story is it provides a link. If you follow that link, the ratings look a bit different.

literacy

There are five other rankings in addition to the “Final Rank”, but none of them has NZ at number five.

lit2

So, where did the numbers come from? It can’t be a mistake at the Herald, because Newshub had the same numbers (as did Finland Todayand basically everyone except the Washington Post)

Although nobody links, I did track down the press release. It has the ranks given by the Herald, and it has the quotes they used from the creator of the ranking.  The stories would have been written before the site went live, so the reporters wouldn’t have been able to check the site even if it had occurred to them to do so.  I have no idea how the press release managed to disagree with the site itself, and while it would be nice to see corrections published, I won’t hold my breath.


Underlying this relatively minor example is a problem with the intersection of ‘instant news’ and science that I’ve mentioned before.  Science stories are often written before the research is published, and often released before it is published. This is unnecessary except for the biggest events: the science would be just as true (or not) and just as interesting (or not) a day later.

At least the final rank still shows NZ beating Australia.

February 28, 2016

How I met your mother

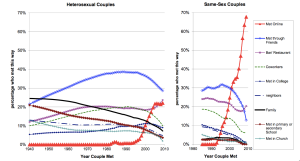
Via Jolisa Gracewood on Twitter, a graph from Stanford sociologist Michael Rosenfeld on how people met their partners (click to embiggen)

met

Obviously the proportion who met online has increased — in the old days there weren’t many people on line. It’s still dramatic how fast the change happened, considering that ‘the year September never ended’, when AOL subscribers gained access to Usenet, was only 1993.  It’s also notable how everything else except ‘in a bar or restaurant’ has gone down.

Since this is StatsChat you should be asking how they got the data: it was a reasonably good survey. There’s a research paper, too (PDF).

You should also be worrying about the bump in ‘online’ in the mid-1980s. It’s ok. The paper says “This bump corresponds to two respondents. These two respondents first met their partners in the 1980s without the assistance of the Internet, and then used the Internet to reconnect later”


January 25, 2016

Meet Statistics summer scholar Eva Brammen

photo_brammenEvery summer, the Department of Statistics offers scholarships to a number of students so they can work with staff on real-world projects. Eva, right, is working on a sociolinguistic study with Dr Steffen Klaere. Eva, right,  explains:

“How often do you recognise the dialect of a neighbour and start classifying them into a certain category? Sociolinguistics studies patterns and structures in spoken language to identify some of the traits that enable us to do this kind of classification.

“Linguists have known for a long time that this involves recognising relevant signals in speech, and using those signals to differentiate some speakers and group others. Specific theories of language predict that some signals will cluster together, but there are remarkably few studies that seriously explore the patterns that might emerge across a number of signals.

“The study I am working on was carried out on Bequia Island in the Eastern Caribbean. The residents of three villages, Mount Pleasant, Paget Farm and Hamilton, say that they can identify which village people come from by their spoken language. The aim of this study was to detect signals in speech that tied the speaker to a location.

“One major result from this project was that the data are sometimes insufficient to answer the researchers’ questions satisfactorily. So we are tapping into the theory of experimental design to develop sampling protocols for sociolinguistic studies that permit researchers to answer their questions satisfactorily.

“I am 22 and come from Xanten in Germany. I studied Biomathematics at the Ernst-Moritz-Arndt-University in Greifswald, and have just finished my bachelor degree.

“What I like most about statistics is its connection with mathematical theory and its application to many different areas. You can work with people who aren’t necessarily statisticians.

“This is my first time in New Zealand, so with my time off I am looking forward to travelling around the country. During my holidays I will explore Northland and the Bay of Islands. After I have finished my project, I want to travel from Auckland to the far south and back again.”

January 21, 2016

Meet Statistics summer scholar David Chan

David ChanEvery summer, the Department of Statistics offers scholarships to a number of students so they can work with staff on real-world projects. David, right, is working on the New Zealand General Social Survey 2014 with Professor Thomas Lumley and Associate Professor Brian McArdle of Statistics, and  Senior Research Fellow Roy Lay-Yee and Professor Peter Davis from COMPASS, the Centre of Methods and Policy Application in the Social Sciences. David explains:

“My project involves exploring the social network data collected by the New Zealand General Social Survey 2014, which measures well-being and is the country’s biggest social survey outside the five-yearly census. I am essentially profiling each respondent’s social network, and then I’ll investigate the relationships between a person’s social network and their well-being.

“Measurements of well-being include socio-economic status, emotional and physical health, and overall life satisfaction. I intend to explore whether there is a link between social networks and well-being. I’ll then identify what kinds of people make a social network successful and how they influence a respondent’s well-being.

“I have just completed a conjoint Bachelor of Music and Bachelor of Science, majoring in composition and statistics respectively.  When I started my conjoint, I wasn’t too sure why statistics appealed to me. But I know now – statistics appeals to me because of its analytical nature to solving both theoretical and real-life problems.

“This summer, I’m planning to hang out with my friends and family. I’m planning to work on a small music project as well.”


January 19, 2016

Rebooting your immune system?

OneNews had a strange-looking story about multiple sclerosis tonight, with lots of footage of one British guy who’d got much better after treatment, and some mentions of an ongoing trial. With the trial still going on, it wasn’t clear why there was publicity now, or why it mostly involved just one patient.

I Google these things so you don’t have to.

So. It turns out there was a new research paper behind the publicity. There is an international trial of immune stem cell transplant for multiple sclerosis, which plans to follow patients for five years after treatment. The research paper describes what happened for the first three years.

As the OneNews story says, there has been a theory for a long time that if you wipe out someone’s immune system and start over again, the new version wouldn’t attack the nervous system and the disease would be cured. The problem was two-fold. First, wiping out someone’s immune system is an extraordinarily drastic treatment — you give a lethal dose of chemotherapy, and then rescue the patient with a transplanted immune system. Second, it didn’t work reliably.

The researcher behind the current trial believes that the treatment would work reliably if it was done earlier — during one of the characteristic remissions in disease progress, rather than after all else fails. This trial involves 25 patients, and so far the results are reasonably positive, but three years is really to soon to tell whether the benefits are worth the treatment. Even with full follow-up of this uncontrolled study it probably won’t be clear exactly who the treatment is worthwhile for.

Why the one British guy? Well,

The BBC’s Panorama programme was given exclusive access to several patients who have undergone the stem cell transplant.

The news story is clipped from a more in-depth current-affairs programme. That BBC link also shows a slightly worrying paranoid attitude from the lead researcher

He said: “There has been resistance to this in the pharma and academic world. This is not a technology you can patent and we have achieved this without industry backing.”

That might explain pharma, but there’s no real reason for the lack of patents to be a problem for academics. It’s more likely that doctors are reluctant to recommend ultra-high-dose chemotherapy without more concrete evidence. After all, it was supposed to work for breast cancer and didn’t, and it was theorised to work for HIV and doesn’t seem to. And at least in the past it didn’t work reliably for multiple sclerosis.

All in all, I think the OneNews story was too one-sided given the interim nature of the data and lack of availability of the treatment.  It could also have said a bit more about how nasty the treatment is.  I can see it being fine as part of a story in a current affairs programme such as Panorama, but as TV news I think it went too far.

January 11, 2016

Meet Statistics summer scholar Christopher Nottingham

Chris NottinghamEvery summer, the Department of Statistics offers scholarships to a number of students so they can work with staff on real-world projects. Christopher, right, is working with Associate Professor David Scott on All Blacks-related data. Christopher explains:

“My project is aimed at predicting the career lengths of current and future All Blacks based on data from all of the past All Blacks. This project will be useful as it will aid the planning within the All Blacks camp.

“This coming year, I will be studying a research-based MSc in Statistics. My thesis is in the area of quantitative fisheries science and will involve translating ADMB code into STAN code.

“Statistics appeals to me because of its diversity. For example, one day you could be analysing fisheries data, and the next, data relating to the All Blacks.

“In my spare time I enjoying walks along the beach, sailing and cycling around the waterfront with my wife.”