May 26, 2017

In memoriam Alastair Scott

AlastairScott4-560x373(Alastair didn’t contribute directly to StatsChat, but he was a major contributor to this being a department that would take it seriously.)

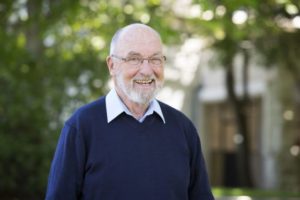
In memoriam: Alastair Scott, Emeritus Professor of Statistics (1939-2017).

Alastair Scott, one of the finest statisticians New Zealand has produced, died in Auckland, New Zealand on Thursday, May 25. He served the University of Auckland with distinction from 1972 to 2005.

His research was characterised by deep insight and he made pioneering contributions across a wide range of statistical fields. Alastair was acknowledged, in particular, as a world leader in survey sampling theory and the development of methods to efficiently obtain and analyse data from medical studies. His methods are applied in a wide range of areas, notably in public health. Beyond research, he contributed prolifically to the statistical profession in academia, government, and society.

Alastair was a Fellow of the Royal Society of New Zealand, the American Statistical Association, the Institute of Mathematical Statistics, the Royal Statistical Society, and an honorary life member of the New Zealand Statistical Association. In November last year, Alastair was awarded the Royal Society of New Zealand’s Jones Medal, which recognised his lifetime contribution to the mathematical sciences.

Alastair gained his first degrees at the University of Auckland: BSc in Mathematics in 1961 and MSc in Mathematics in 1962. After a period at the New Zealand Department of Scientific and Industrial Research, he pursued a PhD in Statistics at the University of Chicago, graduating in 1965. He then worked at the London School of Economics from 1965-1972.

Alastair returned to New Zealand in 1972 to a post in what was then the Department of Mathematics and Statistics at the University of Auckland; he and wife Margaret had decided that they wanted to raise their children, Andrew and Julie, in New Zealand. Throughout his career, Alastair was regularly offered posts at prestigious universities overseas, but turned them down. However, he held visiting positions at Bell Labs, the universities of North Carolina, Wisconsin, and UC Berkeley in the US, and at the University of Southampton in the UK.

In 1994, the University’s statistics staff, led by Professor George Seber, had a very amicable divorce from the Department of Mathematics and Statistics, and Alastair became the head of the new Department of Statistics. He helped set the tone for the department that still exists – hard-working, but welcoming, and social. The Department of Statistics is now the largest such school in Australasia.

In 2005, Alastair officially retired. A conference in Auckland that year in his honour attracted the largest concentration of first-rank international statisticians in New Zealand in one place at one time. Alastair kept an office in the department and continued writing and advising, coming into work almost every day.

Alastair Scott was an influential teacher and generous mentor to several generations of statisticians who valued his sage advice coupled with his trademark affability. Alastair had a full life professionally and personally. He was a wonderful teacher, mentor, colleague, and friend. We will all miss him greatly and we extend our sincere condolences to Margaret, Andrew and Julie, and his family, friends, and colleagues all over the world.


May 23, 2017

Super 18 Predictions for Round 14

Team Ratings for Round 14

The basic method is described on my Department home page.

Here are the team ratings prior to this week’s games, along with the ratings at the start of the season.

Current Rating Rating at Season Start Difference
Hurricanes 18.33 13.22 5.10
Crusaders 14.42 8.75 5.70
Highlanders 11.19 9.17 2.00
Lions 9.87 7.64 2.20
Chiefs 8.46 9.75 -1.30
Blues 3.12 -1.07 4.20
Brumbies 1.66 3.83 -2.20
Stormers 1.04 1.51 -0.50
Sharks 1.00 0.42 0.60
Waratahs -0.33 5.81 -6.10
Jaguares -4.04 -4.36 0.30
Bulls -5.55 0.29 -5.80
Force -9.93 -9.45 -0.50
Reds -10.32 -10.28 -0.00
Cheetahs -10.95 -7.36 -3.60
Kings -12.44 -19.02 6.60
Rebels -15.37 -8.17 -7.20
Sunwolves -17.26 -17.76 0.50


Performance So Far

So far there have been 102 matches played, 79 of which were correctly predicted, a success rate of 77.5%.
Here are the predictions for last week’s games.

Game Date Score Prediction Correct
1 Chiefs vs. Crusaders May 19 24 – 31 -5.80 TRUE
2 Stormers vs. Blues May 19 30 – 22 1.10 TRUE
3 Hurricanes vs. Cheetahs May 20 61 – 7 30.40 TRUE
4 Force vs. Highlanders May 20 6 – 55 -12.80 TRUE
5 Sunwolves vs. Sharks May 20 17 – 38 -13.30 TRUE
6 Kings vs. Brumbies May 20 10 – 19 -10.30 TRUE
7 Lions vs. Bulls May 20 51 – 14 16.50 TRUE
8 Waratahs vs. Rebels May 21 50 – 23 17.40 TRUE


Predictions for Round 14

Here are the predictions for Round 14. The prediction is my estimated expected points difference with a positive margin being a win to the home team, and a negative margin a win to the away team.

Game Date Winner Prediction
1 Blues vs. Chiefs May 26 Chiefs -1.80
2 Reds vs. Force May 26 Reds 3.10
3 Sunwolves vs. Cheetahs May 27 Cheetahs -2.30
4 Highlanders vs. Waratahs May 27 Highlanders 15.50
5 Rebels vs. Crusaders May 27 Crusaders -25.80
6 Bulls vs. Hurricanes May 27 Hurricanes -19.90
7 Sharks vs. Stormers May 27 Sharks 3.50
8 Jaguares vs. Brumbies May 27 Brumbies -1.70
9 Lions vs. Kings May 28 Lions 25.80


NRL Predictions for Round 12

Team Ratings for Round 12

The basic method is described on my Department home page.

Here are the team ratings prior to this week’s games, along with the ratings at the start of the season.

Current Rating Rating at Season Start Difference
Broncos 7.78 4.36 3.40
Storm 7.07 8.49 -1.40
Sharks 6.10 5.84 0.30
Raiders 4.86 9.94 -5.10
Sea Eagles 3.25 -2.98 6.20
Roosters 3.13 -1.17 4.30
Cowboys 1.65 6.90 -5.30
Dragons 1.48 -7.74 9.20
Panthers 0.45 6.08 -5.60
Titans -1.68 -0.98 -0.70
Eels -2.44 -0.81 -1.60
Bulldogs -3.05 -1.34 -1.70
Rabbitohs -4.05 -1.82 -2.20
Warriors -5.59 -6.02 0.40
Wests Tigers -8.31 -3.89 -4.40
Knights -12.69 -16.94 4.20


Performance So Far

So far there have been 88 matches played, 50 of which were correctly predicted, a success rate of 56.8%.
Here are the predictions for last week’s games.

Game Date Score Prediction Correct
1 Sharks vs. Cowboys May 18 18 – 14 8.80 TRUE
2 Warriors vs. Dragons May 19 14 – 30 -0.70 TRUE
3 Broncos vs. Wests Tigers May 19 36 – 0 16.60 TRUE
4 Titans vs. Sea Eagles May 20 10 – 30 2.00 FALSE
5 Eels vs. Raiders May 20 16 – 22 -3.30 TRUE
6 Knights vs. Panthers May 21 20 – 30 -9.60 TRUE
7 Bulldogs vs. Roosters May 21 18 – 24 -1.90 TRUE
8 Rabbitohs vs. Storm May 21 6 – 14 -7.50 TRUE


Predictions for Round 12

Here are the predictions for Round 12. The prediction is my estimated expected points difference with a positive margin being a win to the home team, and a negative margin a win to the away team.

Game Date Winner Prediction
1 Rabbitohs vs. Eels May 26 Rabbitohs 1.90
2 Warriors vs. Broncos May 27 Broncos -9.40
3 Sharks vs. Bulldogs May 27 Sharks 12.60
4 Raiders vs. Roosters May 28 Raiders 5.20


May 22, 2017

How rich do you feel

From Scott Macleod, in a Stat of the Week nomination

The NZ Herald claims that a person earning the median NZ salary of USD $33,500 (equivalent) is the 55 millionth richest person in the world by income.

However, this must be wrong.

There are 300 million people in the USA alone, and their median income is higher than ours. This means that the average New Zealander wouldn’t even be the 55 millionth richest person in the USA, let alone the world.

Basically, yes, but it’s not quite as simple as that.  That median NZ salary looks like what you get if you multiply the NZ median “weekly personal income from salary and wages among those receiving salary and wages” (eg here) by 52, which would be appropriate for people receiving salary or wage income 52 weeks per year. The median personal income for NZ will be quite a lot lower, and the median personal income for the US is also lower: about USD30,240.

Even so, there are about 250 million adults (by the definition used) in the US, and nearly half of them have higher personal income than USD33500, so that still comes to over 100 million people. And that’s without counting Germany or the UK — or cities such as  Beijing and Shanghai that have more people with incomes that high than New Zealand does.  And that’s also assuming the web page doesn’t do currency conversions — which it looks from the code as if it’s trying to.

The CARE calculator must indeed be wrong, or using an unusual definition of income, or something. Unfortunately, the code for how it does the calculation is hidden; they say “After calculating the distribution of income, we then use a statistical model to estimate your rank.” 

As a cross-check, Pew Global also has a web page based on World Bank data.  It doesn’t let you put in your own cutpoints, but it says 7% of the world’s population had more than $50/day to live on in 2011.  The CARE web page thinks it’s more like 4.7% now.  The agreement does seem to be better at lower incomes, too — the estimates will be more accurate for people who aren’t going to use the calculator than for people who are.


Stat of the Week Competition: May 20 – 26 2017

Each week, we would like to invite readers of Stats Chat to submit nominations for our Stat of the Week competition and be in with the chance to win an iTunes voucher.

Here’s how it works:

  • Anyone may add a comment on this post to nominate their Stat of the Week candidate before midday Friday May 26 2017.
  • Statistics can be bad, exemplary or fascinating.
  • The statistic must be in the NZ media during the period of May 20 – 26 2017 inclusive.
  • Quote the statistic, when and where it was published and tell us why it should be our Stat of the Week.

Next Monday at midday we’ll announce the winner of this week’s Stat of the Week competition, and start a new one.

(more…)

May 20, 2017

Bright sunshiny day

Q: Isn’t Study suggests we need this first-thing in the morning a perfect example of click-bait?

A: Impressive. And what is this?

Q: This is daylight.

A: Makes sense.  And fits with the picture of someone stretching after getting out of bed.

Q: Does it fit the research?

A: Um.  Not so much. (link)

Q: Not people?

A: No, it was people. It’s just it was light exposure in office buildings.

Q: And these buildings weren’t where people slept?

A: No, that would be potentially inappropriate. It was where they worked.

Q: But giving people more light helped with sleep and depression?

A: “the study did not include a lighting intervention”

Q: So they compared people who had offices with windows and natural light to everyone else?

A: Basically.

Q: And there was a difference in how much sleep they got?

A: No.

Q: In whether they woke up a lot?

A: Not really. The ‘sleep efficiency’ was pretty much the same.

Q: In what, then?

A: In how long they took to fall asleep.

Q: And the depression and stress?

A: Well, the differences were statistically detectable, but they weren’t all that big.

Q: But wouldn’t you expect people with windows in their offices to be happier?

A: Yes. It’s a bit surprising how small the differences were in this study.

Q: So the headline is a bit exaggerated?

A: It’s worse than that. The headline says the research is about what you should have been doing, but it’s actually about what your employer should be doing.

May 17, 2017

Briefly

  • From the NY Times: In a survey of geographical knowledge and attitudes to North Korea, Americans who can tell their arse from their elbow are more likely to favour diplomacy.  This is different from the Agrabah question, because survey participants aren’t being lied to.
  • Perceptions of bias — more precisely, claims about perceptions of bias — are very different between Democrats and Republicans in the US, according to analysis at 538.  Democrats are likely to say they think whites and Christians don’t get discriminated against much but blacks, Muslims, immigrants, gays & lesbians do. For all the groups, about a third of Republicans say they think there’s a lot of discrimination.
  • Difficulties with doing randomised experiments on social issues, from the Brookings Institution.  One of the big problems is that there isn’t good theory to allow the results of an experiment to be generalised, in contrast to drug trials where we have a pretty reasonable idea of what it means when a drug does well in a randomised trial population.  A lot of the difficulties do generalise to public health interventions, though. On a related note, economist Noah Smith talks about the role of theory and experiment in economics and in science.
  • I wrote last year about judges interrupting each other in the US Supreme Court and whether it depended on gender — the analysis in the media had ignored how much each judge talked.  There’s now an analysis with more variables (and now the right link), and the gender difference looks stronger.
May 16, 2017

Super 18 Predictions for Round 13

Team Ratings for Round 13

The basic method is described on my Department home page.

Here are the team ratings prior to this week’s games, along with the ratings at the start of the season.

Current Rating Rating at Season Start Difference
Hurricanes 16.70 13.22 3.50
Crusaders 14.56 8.75 5.80
Highlanders 9.02 9.17 -0.10
Lions 8.64 7.64 1.00
Chiefs 8.54 9.75 -1.20
Blues 3.53 -1.07 4.60
Brumbies 1.74 3.83 -2.10
Stormers 0.63 1.51 -0.90
Sharks 0.54 0.42 0.10
Waratahs -0.91 5.81 -6.70
Jaguares -4.04 -4.36 0.30
Bulls -4.32 0.29 -4.60
Force -7.76 -9.45 1.70
Cheetahs -9.53 -7.36 -2.20
Reds -10.32 -10.28 -0.00
Kings -12.52 -19.02 6.50
Rebels -14.79 -8.17 -6.60
Sunwolves -16.80 -17.76 1.00


Performance So Far

So far there have been 94 matches played, 71 of which were correctly predicted, a success rate of 75.5%.
Here are the predictions for last week’s games.

Game Date Score Prediction Correct
1 Blues vs. Cheetahs May 12 50 – 32 16.90 TRUE
2 Brumbies vs. Lions May 12 6 – 13 -2.30 TRUE
3 Crusaders vs. Hurricanes May 13 20 – 12 -3.50 FALSE
4 Rebels vs. Reds May 13 24 – 29 -0.40 TRUE
5 Bulls vs. Highlanders May 13 10 – 17 -9.70 TRUE
6 Kings vs. Sharks May 13 35 – 32 -11.30 FALSE
7 Jaguares vs. Force May 13 6 – 16 10.10 FALSE


Predictions for Round 13

Here are the predictions for Round 13. The prediction is my estimated expected points difference with a positive margin being a win to the home team, and a negative margin a win to the away team.

Game Date Winner Prediction
1 Chiefs vs. Crusaders May 19 Crusaders -2.50
2 Stormers vs. Blues May 19 Stormers 1.10
3 Hurricanes vs. Cheetahs May 20 Hurricanes 30.20
4 Force vs. Highlanders May 20 Highlanders -12.80
5 Sunwolves vs. Sharks May 20 Sharks -13.30
6 Kings vs. Brumbies May 20 Brumbies -10.30
7 Lions vs. Bulls May 20 Lions 16.50
8 Waratahs vs. Rebels May 21 Waratahs 17.40


NRL Predictions for Round 11

Team Ratings for Round 11

The basic method is described on my Department home page.

Here are the team ratings prior to this week’s games, along with the ratings at the start of the season.

Current Rating Rating at Season Start Difference
Storm 7.03 8.49 -1.50
Sharks 6.54 5.84 0.70
Broncos 6.27 4.36 1.90
Raiders 4.62 9.94 -5.30
Roosters 2.76 -1.17 3.90
Sea Eagles 1.55 -2.98 4.50
Cowboys 1.21 6.90 -5.70
Panthers 0.41 6.08 -5.70
Dragons 0.27 -7.74 8.00
Titans 0.01 -0.98 1.00
Eels -2.20 -0.81 -1.40
Bulldogs -2.68 -1.34 -1.30
Rabbitohs -4.01 -1.82 -2.20
Warriors -4.38 -6.02 1.60
Wests Tigers -6.81 -3.89 -2.90
Knights -12.65 -16.94 4.30


Performance So Far

So far there have been 80 matches played, 43 of which were correctly predicted, a success rate of 53.8%.
Here are the predictions for last week’s games.

Game Date Score Prediction Correct
1 Bulldogs vs. Cowboys May 11 14 – 30 2.50 FALSE
2 Dragons vs. Sharks May 12 14 – 18 -2.50 TRUE
3 Wests Tigers vs. Rabbitohs May 12 8 – 28 4.50 FALSE
4 Panthers vs. Warriors May 13 36 – 28 9.00 TRUE
5 Storm vs. Titans May 13 36 – 38 12.90 FALSE
6 Sea Eagles vs. Broncos May 13 14 – 24 0.50 FALSE
7 Knights vs. Raiders May 14 34 – 20 -18.70 FALSE
8 Roosters vs. Eels May 14 48 – 10 3.20 TRUE


Predictions for Round 11

Here are the predictions for Round 11. The prediction is my estimated expected points difference with a positive margin being a win to the home team, and a negative margin a win to the away team.

Game Date Winner Prediction
1 Sharks vs. Cowboys May 18 Sharks 8.80
2 Warriors vs. Dragons May 19 Dragons -0.70
3 Broncos vs. Wests Tigers May 19 Broncos 16.60
4 Titans vs. Sea Eagles May 20 Titans 2.00
5 Eels vs. Raiders May 20 Raiders -3.30
6 Knights vs. Panthers May 21 Panthers -9.60
7 Bulldogs vs. Roosters May 21 Roosters -1.90
8 Rabbitohs vs. Storm May 21 Storm -7.50


May 15, 2017

Stat of the Week Competition: May 13 – 19 2017

Each week, we would like to invite readers of Stats Chat to submit nominations for our Stat of the Week competition and be in with the chance to win an iTunes voucher.

Here’s how it works:

  • Anyone may add a comment on this post to nominate their Stat of the Week candidate before midday Friday May 19 2017.
  • Statistics can be bad, exemplary or fascinating.
  • The statistic must be in the NZ media during the period of May 13 – 19 2017 inclusive.
  • Quote the statistic, when and where it was published and tell us why it should be our Stat of the Week.

Next Monday at midday we’ll announce the winner of this week’s Stat of the Week competition, and start a new one.

(more…)