Budget visualisation
Keith Ng has his annual interactive graphic of budget changes up at Public Address, and will soon have a graphic showing how overall forecasts have changed over time.
[update] And Harkanwal Singh has his version up at the Herald
Keith Ng has his annual interactive graphic of budget changes up at Public Address, and will soon have a graphic showing how overall forecasts have changed over time.
[update] And Harkanwal Singh has his version up at the Herald
There’s a Stat-of-the-Week nomination for a Dominion Post article that I haven’t seen, because Stuff has had the good sense not to put it online. The press release is on Scoop, and from what our correspondent says, if you’ve read that, you’ve read the story. It’s about sex at the office, based on a ridiculously small sample selected from members of a dating website. Since the dating website in question makes a lot of how different its members are from typical people, representativeness is not likely. Also, their infographic disagrees with the text of the release in at least one place.
That’s all standard. What’s interesting is the comparison of proportion of men and women who have had sex in various situations. Now, for the heterosexual majority, we have a basic accounting constraint in play. The office-sex survey says 20% of men and 3% of women have got it on in a conference room and 15% of men and 2% of women have done so in a storage room. If these numbers were true there would be only three explanations: there are a lot more gay men around than other data suggest, and they really like the office; the few women who have sex at the office do so with many different men; or we have a Clintonesque definitional problem where the vast majority of the women involved don’t think what they did was sex. More likely, it’s just evidence that the numbers are meaningless.
We’ve seen this problem before, but at least this is one problem the Herald’s story about holiday romance based on an Expedia press release avoided.
[Update: 538 now has an intro to the story explaining the mistakes and apologising. Good for them.]
So, at fivethirtyeight.com there’s this story on mapping kidnappings in Nigeria using data from GDELT, the sort of thing data journalism is supposed to be good at. GDELT automatically extracts information from news stories to build a huge global database.
On Twitter, Erin Simpson, whose about.me page says she is “a leading specialist in the intersection of intelligence, data analysis, irregular warfare, and illicit systems – with an emphasis on novel research designs,” — and who has worked on the GDELT parser — is Not Happy.
Thanks to Storify, here are three summaries of what she says, but a lot of it can be boiled down to one point:
In conclusion: VALIDATE YOUR FREAKING DATA. It’s not true just because it’s on a goddamn map.
(via @LewSOS)
The basic method is described on my Department home page. I have made some changes to the methodology this year, including shrinking the ratings between seasons.
Here are the team ratings prior to this week’s games, along with the ratings at the start of the season.
| Current Rating | Rating at Season Start | Difference | |
|---|---|---|---|
| Roosters | 9.26 | 12.35 | -3.10 |
| Bulldogs | 8.21 | 2.46 | 5.70 |
| Rabbitohs | 7.98 | 5.82 | 2.20 |
| Sea Eagles | 6.93 | 9.10 | -2.20 |
| Cowboys | 4.73 | 6.01 | -1.30 |
| Storm | 0.74 | 7.64 | -6.90 |
| Broncos | 0.39 | -4.69 | 5.10 |
| Panthers | -0.21 | -2.48 | 2.30 |
| Titans | -0.28 | 1.45 | -1.70 |
| Warriors | -0.61 | -0.72 | 0.10 |
| Knights | -1.93 | 5.23 | -7.20 |
| Sharks | -4.72 | 2.32 | -7.00 |
| Wests Tigers | -5.91 | -11.26 | 5.40 |
| Dragons | -8.08 | -7.57 | -0.50 |
| Eels | -8.63 | -18.45 | 9.80 |
| Raiders | -9.66 | -8.99 | -0.70 |
So far there have been 72 matches played, 39 of which were correctly predicted, a success rate of 54.2%.
Here are the predictions for last week’s games.
| Game | Date | Score | Prediction | Correct | |
|---|---|---|---|---|---|
| 1 | Roosters vs. Wests Tigers | May 09 | 30 – 6 | 18.60 | TRUE |
| 2 | Cowboys vs. Broncos | May 09 | 27 – 14 | 7.80 | TRUE |
| 3 | Warriors vs. Raiders | May 10 | 54 – 12 | 7.80 | TRUE |
| 4 | Titans vs. Rabbitohs | May 10 | 18 – 40 | 0.10 | FALSE |
| 5 | Storm vs. Sea Eagles | May 10 | 22 – 19 | -2.90 | FALSE |
| 6 | Knights vs. Panthers | May 11 | 10 – 32 | 7.90 | FALSE |
| 7 | Dragons vs. Bulldogs | May 11 | 6 – 38 | -7.50 | TRUE |
| 8 | Eels vs. Sharks | May 12 | 42 – 24 | -3.20 | FALSE |
Here are the predictions for Round 10. The prediction is my estimated expected points difference with a positive margin being a win to the home team, and a negative margin a win to the away team.
| Game | Date | Winner | Prediction | |
|---|---|---|---|---|
| 1 | Rabbitohs vs. Storm | May 16 | Rabbitohs | 11.70 |
| 2 | Broncos vs. Titans | May 16 | Broncos | 5.20 |
| 3 | Eels vs. Dragons | May 17 | Eels | 4.00 |
| 4 | Sharks vs. Wests Tigers | May 17 | Sharks | 5.70 |
| 5 | Cowboys vs. Roosters | May 17 | Roosters | -0.00 |
| 6 | Raiders vs. Panthers | May 18 | Panthers | -4.90 |
| 7 | Bulldogs vs. Warriors | May 18 | Bulldogs | 13.30 |
| 8 | Sea Eagles vs. Knights | May 19 | Sea Eagles | 13.40 |
The basic method is described on my Department home page. I have made some changes to the methodology this year, including shrinking the ratings between seasons.
Here are the team ratings prior to this week’s games, along with the ratings at the start of the season.
| Current Rating | Rating at Season Start | Difference | |
|---|---|---|---|
| Crusaders | 9.32 | 8.80 | 0.50 |
| Sharks | 5.19 | 4.57 | 0.60 |
| Chiefs | 4.59 | 4.38 | 0.20 |
| Brumbies | 4.38 | 4.12 | 0.30 |
| Waratahs | 3.05 | 1.67 | 1.40 |
| Bulls | 2.70 | 4.87 | -2.20 |
| Hurricanes | 2.13 | -1.44 | 3.60 |
| Blues | -0.45 | -1.92 | 1.50 |
| Stormers | -0.92 | 4.38 | -5.30 |
| Force | -1.70 | -5.37 | 3.70 |
| Highlanders | -2.23 | -4.48 | 2.30 |
| Cheetahs | -3.56 | 0.12 | -3.70 |
| Reds | -4.10 | 0.58 | -4.70 |
| Rebels | -5.24 | -6.36 | 1.10 |
| Lions | -6.17 | -6.93 | 0.80 |
So far there have been 81 matches played, 54 of which were correctly predicted, a success rate of 66.7%.
Here are the predictions for last week’s games.
| Game | Date | Score | Prediction | Correct | |
|---|---|---|---|---|---|
| 1 | Chiefs vs. Blues | May 09 | 32 – 20 | 6.80 | TRUE |
| 2 | Rebels vs. Hurricanes | May 09 | 15 – 25 | -2.40 | TRUE |
| 3 | Highlanders vs. Lions | May 10 | 23 – 22 | 9.00 | TRUE |
| 4 | Brumbies vs. Sharks | May 10 | 16 – 9 | 2.60 | TRUE |
| 5 | Cheetahs vs. Force | May 10 | 16 – 23 | 3.50 | FALSE |
| 6 | Bulls vs. Stormers | May 10 | 28 – 12 | 4.70 | TRUE |
| 7 | Reds vs. Crusaders | May 11 | 29 – 57 | -6.90 | TRUE |
Here are the predictions for Round 14. The prediction is my estimated expected points difference with a positive margin being a win to the home team, and a negative margin a win to the away team.
| Game | Date | Winner | Prediction | |
|---|---|---|---|---|
| 1 | Hurricanes vs. Highlanders | May 16 | Hurricanes | 6.90 |
| 2 | Crusaders vs. Sharks | May 17 | Crusaders | 8.10 |
| 3 | Reds vs. Rebels | May 17 | Reds | 3.60 |
| 4 | Stormers vs. Force | May 17 | Stormers | 4.80 |
| 5 | Cheetahs vs. Brumbies | May 17 | Brumbies | -3.90 |
| 6 | Waratahs vs. Lions | May 18 | Waratahs | 13.20 |
From the Herald
Housing Minister Nick Smith has revealed that Government held data on the proportion of New Zealand homes owned by offshore buyers, which he says is very low compared to other countries.
It turns out that the Government actually has data on the proportion of rental landlords who are overseas. Not the proportion of all homes, and not even the proportion of all rental homes. And even then, the proportion is based on whether the landlords are currently offshore, not whether they were offshore at the time of purchase, which is the topic of controversy (as the Herald does note).
It’s hard to do anything about the landlords vs rentals difference, but if the proportion of rentals owned offshore was also 11%, that would translate to about 4% of New Zealand homes, based on the home ownership figures from the Census.
Two new(ish) interactive visualisations
Q: Did you see “Cocaine now on tap in British homes” in the Herald
A: Yes.
Q: Is it true?
A: Not so as you’d notice.
Q: Didn’t they find traces of cocaine in drinking water?
A: Up to a point.
Q: You mean no?
A: I mean they found traces of the chemical that cocaine gets broken down into
Q: And is that a drug?
A: Not really. It was one component of an unsuccessful treatment for back pain. It is restricted, because it can be turned into cocaine.
Q: How much of this stuff did they find?
A: Almost none. A few nanograms per litre
Q: What’s that in real numbers? If it was really cocaine, how long would it take you to get one dose if you drank eight glasses of water a day like the doctors recommend?
A: That isn’t actually what the doctors recommend.
Q: Well, then, “like the doctors don’t recommend?”
A: Several centuries.
Q: How can they detect such tiny amounts?
A: They use liquid chromatography to separate out each chemical, and then mass spectroscopy to basically count the molecules.
Q: Ok, impressed now. The story also mentions “significant amounts of caffeine”. What does that mean?
A: It means “insignificant amounts”, about a million times lower concentration than in a cup of decaffeinated coffee.
Q: At least this is new, though?
A: The same agency reported finding the cocaine metabolite in drinking water in 2011, based on measurements in 2009-10. (PDF, Table 6)
Q: Why is there a video of a drug bust in Spain embedded in the story?
A: Because technology.
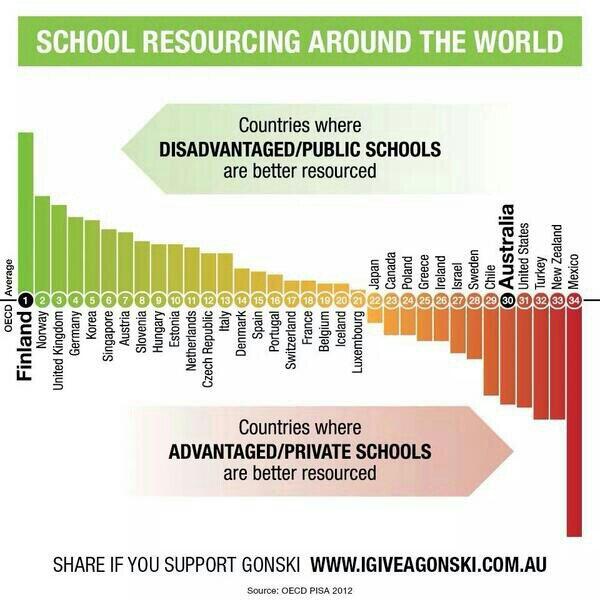
Attention conservation notice: I have to write this post because I’ve spent too much time on it otherwise. You don’t have to read it.
There was an episode of “Yes, Prime Minister” where the term “Human Resource Rich Countries” was being posed as a replacement for “Less Developed Countries”, meaning “poor”. “Resources” is a word that can mean lots of different things, which is why I spent more time than was strictly sensible investigating the following graph
The graph appeared in my Twitter feed last Monday. It’s originally from a campaign to give Australia a school funding model a bit more like NZ’s decile system, as recommended by a national review panel, so it is disturbing to see New Zealand almost at the bottom of the world.
Tens of thousands of well-off pensioners are claiming up to half a billion dollars in superannuation every year.
With government debt at more than $60 billion, critics say the wealthy are asking their children and grandchildren to fund their so-called retirement.
Ministry of Social Development figures revealed more than 26,000 people with total income of more than $70,000 a year claimed superannuation last year. At current rates, this could add up to $570m a year before tax..
From last year in the Herald via me
Imagine the public outrage if it were discovered that more than 80,000 New Zealanders were receiving wages, salaries and investment incomes of more than $6 billion a year, but were also receiving a benefit from the Government.
…
Income figures this week from Statistics NZ show more than 80,000 New Zealanders over the age of 65 receive wages, salaries and investment returns of more than $6.5 billion a year while claiming NZ Super.
The benefits to those 80,000-plus seniors are costing poorer taxpayers at least $1.3 billion a year. Many of these beneficiaries will be retired judges, politicians, chief executives, doctors, diplomats and lawyers who are well able to look after themselves.
It seems the problem is only half as bad now, without any policy changes. Either that, or people really don’t know where they would like to draw the line.
Recent comments