January 6, 2014

In the deep midwinter

It’s cold in the United States at the moment. Very cold. Temperatures in places where lots of people live are down below -20C (before worrying about the wind chill).This isn’t just hypothermia weather, this is ‘exposed skin freezes in minutes’ weather, and hasn’t been seen on such a large scale for decades. So why isn’t this evidence against global warming?

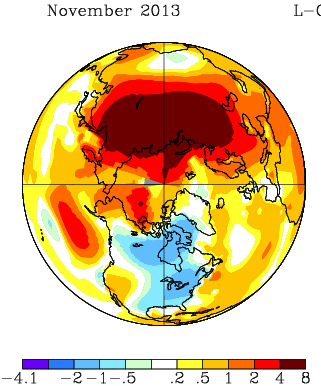
It will be a month or two before we have the global data, but the severe cold snaps in recent years have been due to cold air being in unusual places, rather than to the world being colder that week. For example, November 2013 was also cold in the North America, but it was warm in northern Russia; the cold had just moved (map from NASA).
nmaps


The cold spells in Europe in recent years have been matched by warm spells in Greenland and northeast Canada. You don’t hear about these as much, because hardly anyone lives there.  The ‘polar vortex‘ being described on the US news is an example of the same thing: cold air that usually stays near the pole has moved down to places where people live. That suggests the global temperature anomaly maps for December/January will show warmer-than-usual conditions in other parts of the far northern hemisphere.

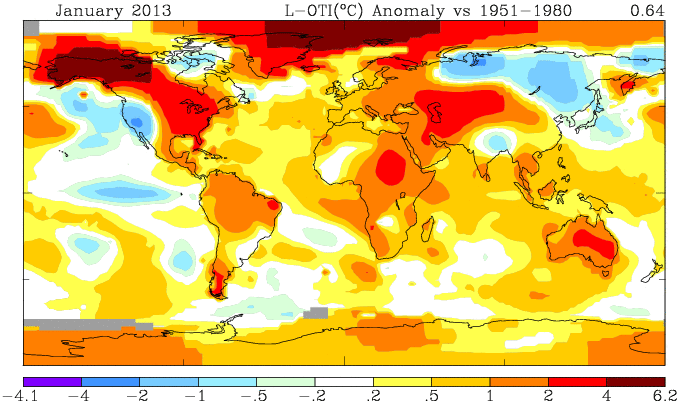
For contrast, look at the heat wave in Australia last January, when the Bureau of Meteorology had to find a new colour to depict really, really, really hot. This map is from the same NASA source (just a different projection)
nmaps-oz


Not only was all of Australia hot, the ocean south of Australia was warmer than typical. This wasn’t a case of cold air from the Southern Ocean failing to reach Australia, which causes heat waves in Melbourne several times a year. It doesn’t look like a case of just moving heat around.

No single weather event can provide any meaningful evidence for or against global warming. What’s important for honest scientific lobbying is whether this sort of event is likely to become more common as a result. The Australian heat waves definitely are. The situation is less clear for the US winter cold: the baseline temperatures will go up, which will mitigate future cold snaps, but there is some initial theoretical support for the idea that warming of the Arctic Ocean increases the likelihood that polar vortices will wander off into inhabited areas.


[note: you can also see in the Jan 2013 picture that the warm winter in the US was partly balanced by cold in Siberia that you didn’t hear so much about]
January 5, 2014

But does it work?

The Public Accounts Committee of the British House of Commons has just released a report on access to clinical trial information, especially in the context of stockpiling the influenza anti-viral, Tamiflu, for use in future pandemics. Their summary says

The Department of Health (the Department) spent £424 million on stockpiling Tamiflu, an antiviral medicine used in the treatment of influenza, for use in a pandemic, but had to write off £74 million of its Tamiflu stockpile as a result of poor record-keeping by the NHS.

There is a lack of consensus over how well Tamiflu works, in particular whether it reduces complications and mortality. Discussions over this issue among professionals have been hampered because important information about clinical trials is routinely and legally withheld from doctors and researchers by manufacturers. This longstanding regulatory and cultural failure impacts on all of medicine, and undermines the ability of clinicians, researchers and patients to make informed decisions about which treatment is best. There are also concerns about the information made available to the National Institute for Health and Care Excellence (NICE) which assesses a medicine’s clinical and cost–effectiveness for use in the NHS.

The information from the clinical trials is, finally, being released: the director of the Cochrane Library says (at AllTrials)

The Cochrane Collaboration – who gained full access to all documents held by European regulators – discovered that many large trials on Tamiflu have not reported results and that for many more trials only partial information was available. Cochrane is now receiving full clinical study reports from Roche. This new information is being assessed by the twelve international researchers who make up the Cochrane Collaboration neuraminidase team, funded by the National Institute of Health Research. They are close to submitting the updated evidence for peer review. The findings will for the first time provide what the PAC calls for, ‘independent scrutiny of a medicine’s effectiveness.’ 

Tamiflu is one of the charismatic megafauna of the publication bias problem: it’s not that research into influenza is especially bad, it’s that this is one issue where it’s possible to make governments take notice.

January 4, 2014

Briefly

The basic statistical question is “Compared to what?”

  • Compared to what? Mark Kleiman If you ignore the benefits of [cannabis] legalization, it looks like a pretty bad idea. If you ignore the costs, it looks like a pretty good idea.
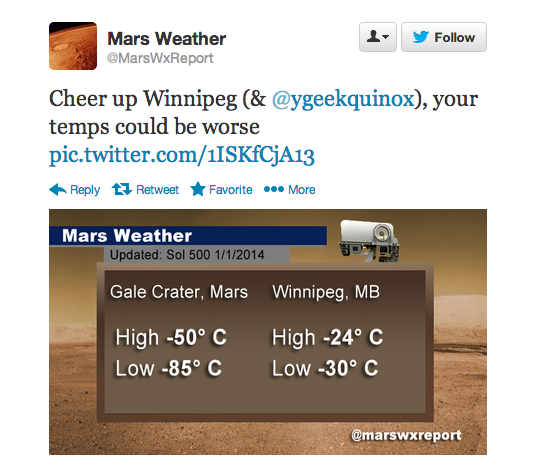
  • Compared to what? What’s wrong with this comparisonmars
  • We criticize the Herald and the Fairfax papers a lot, but it could be much worse

This year, the Mail reported that disabled people are exempt from the bedroom tax; that asylum-seekers had “targeted” Scotland; that disabled babies were being euthanised under the Liverpool Care Pathway; that a Kenyan asylum-seeker had committed murders in his home country; that 878,000 recipients of Employment Support Allowance had stopped claiming “rather than face a fresh medical”; that a Portsmouth primary school had denied pupils water on the hottest day of the year because it was Ramadan; that wolves would soon return to Britain; that nearly half the electricity produced by windfarms was discarded. All these reports were false.

and that doesn’t include any of their science/health stories that ended up on StatsChat via the local media.

Blowing in the wind

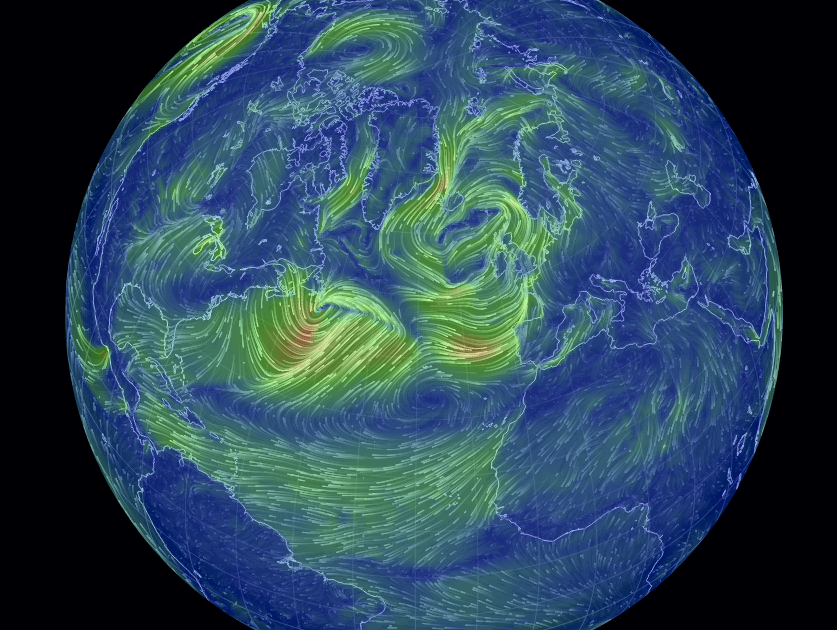
From Cameron Beccario, an interactive visualisation of wind speeds around the world, with your choice of projection, and winds at levels from ground up to the stratosphere.

earth

January 2, 2014

Toll, poll, and tolerance.

The Herald has a story that  has something for everyone.  On the front page of the website it’s labelled “Support for lower speed limit“, but when you click through it’s actually about the tighter tolerance (4km/h, rather than 10km/h) for infringement notices being used on the existing speed limits.

The story is about a real poll, which found about 2/3 support for the summer trial of tighter speed limits. Unfortunately, the poll seems to have had really badly designed questions. Either that, or the reporting is jumping to unsupportable conclusions:

The poll showed that two-thirds of respondents felt that the policy was fair because it was about safety. Just 29 per cent said that it was unfair and was about raising revenue.

That is, apparently the alternatives given for respondents combined both whether they approved of the policy and what they thought the reason was.  That’s a bad idea for two reasons. Firstly, it confuses the respondents, when it’s hard enough getting good information to begin with. Secondly, it pushes them towards an answer.   The story is decorated with a bogus clicky poll, which has a better set of questions, but, of course, largely meaningless results.

The story also quotes the Police Minister attributing a 25% lower death toll during  the Queen’s Birthday weekends to the tighter tolerance

“That means there is an average of 30 people alive today who can celebrate Christmas who might not otherwise have been,” Mrs Tolley said.

We’ve looked at this claim before. It doesn’t hold up. Firstly, there has been a consistently lower road toll, not just at holiday weekends.  And secondly, the Ministry of Transport says that driving too fast for the conditions is a only even one of the contributing factors in 29% of fatal crashes, so getting a 25% reduction in deaths just from tightening the tolerance seems beyond belief.  To be fair, the Minister only said the policy “contributed” to the reduction, so even one death prevented would technically count, but that’s not the impression being given.

What’s a bit depressing is that none of the media discussion I’ve seen of the summer campaign has asked what tolerance is actually needed, based on accuracy of speedometers and police speed measurements. And while stories mention that the summer campaign is a trial run to be continued if it is successful, no-one seems to have asked what the evaluation criteria will be and whether they make sense.

(suggested by Nick Iversen)

January 1, 2014

Pretty things

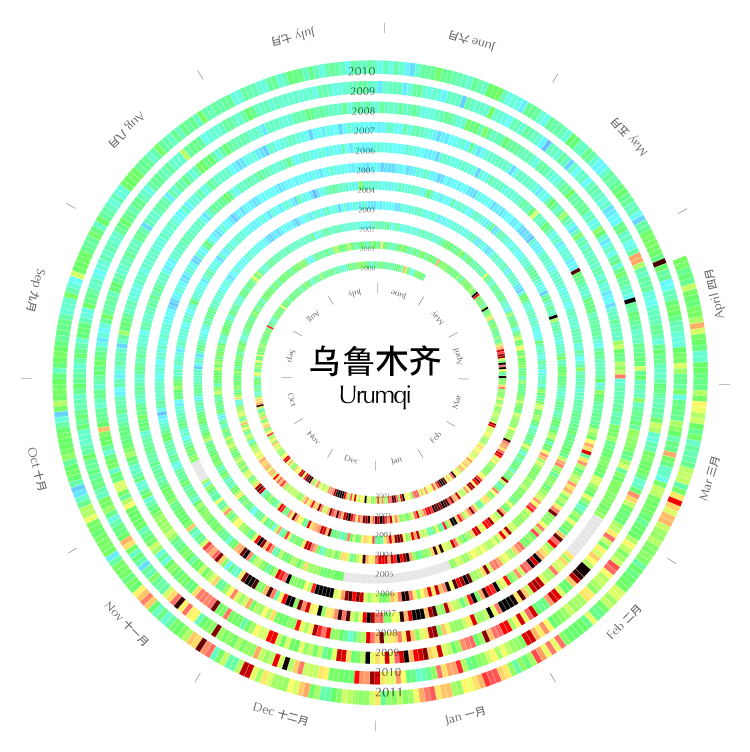
1. Xiaoji Chen (陈晓霁) has graphs of air pollution in some cities in China, spiralling to show the seasons

Urumqi


2. The Cooper-Hewitt collection at the Smithsonian lets you search by colour, with up to five representative colours for each piece

colorsearch


I found this from Chris McDowall’s page that summarises a set of photos by their dominant colours.

tomatocolourtomato


There’s a lot of information loss in reducing a photo to four or five pixels, but finding good ways to reduce information is exactly what statistics is about

I can haz public opinion?

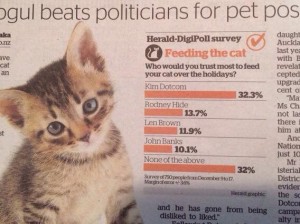
Usually it’s a problem for opinion polls that respondents tend to answer based on political or group affiliation rather than their actual opinion about the real issue.  Today’s Herald has a poll where that’s basically the point. This is a real poll, not one of those bogus clicky things, but the question was “Who would you trust most to feed you cat over the holidays?”

. cat

Now, to start with, just over half of NZ households do not haz cat, so the question is pretty meaningless for them. Even for the 48% with feline overlords,  the answers supplied didn’t include anyone you might actually get to feed your cat over the holidays. (And isn’t the kitten in the photo a bit young to be left alone like that?)

The choices were one MP (out of 121), one big-city mayor (out of, say, four to six), one internet celebrity (out of an indeterminate set), and one former MP and climate-change denier. No women. No-one on the paper’s New Zealanders of the Year list. Unsurprisingly, one in three of the people they managed to get to answer the question looked at the options and said something along the lines of “Do not want”. 

It’s unusual for a statistician to say this, but sometimes getting a properly representative sample doesn’t really help all that much. The one person on the list who is actually known for his commitment to animal welfare came last.

(picture via @ChrisKeall)

December 31, 2013

Problems with genetic testing

Genetic testing has had a lot of overmarketing — even the most obvious poster-child application in clinical medicine, setting doses of warfarin, has been disappointing in clinical trials. Here are two recent pieces you might want to read

In a New York Times story, a journalist had her DNA tested by three companies.  The level of agreement was not, shall we say, ideal

After my tests had been sent, I braced myself for the revelations about my DNA. It took about two months to receive all the results, and when I did, the discrepancies were striking.

23andMe said my most elevated risks — about double the average for women of European ethnicity — were for psoriasis and rheumatoid arthritis, with my lifetime odds of getting the diseases at 20.2 percent and 8.2 percent. But according to Genetic Testing Laboratories, my lowest risks were for — you guessed it — psoriasis (2 percent) and rheumatoid arthritis (2.6 percent).

If you actually work with genome-wide disease data it’s not surprising that the predictions are neither accurate nor consistent, but that isn’t the impression the industry is promoting.

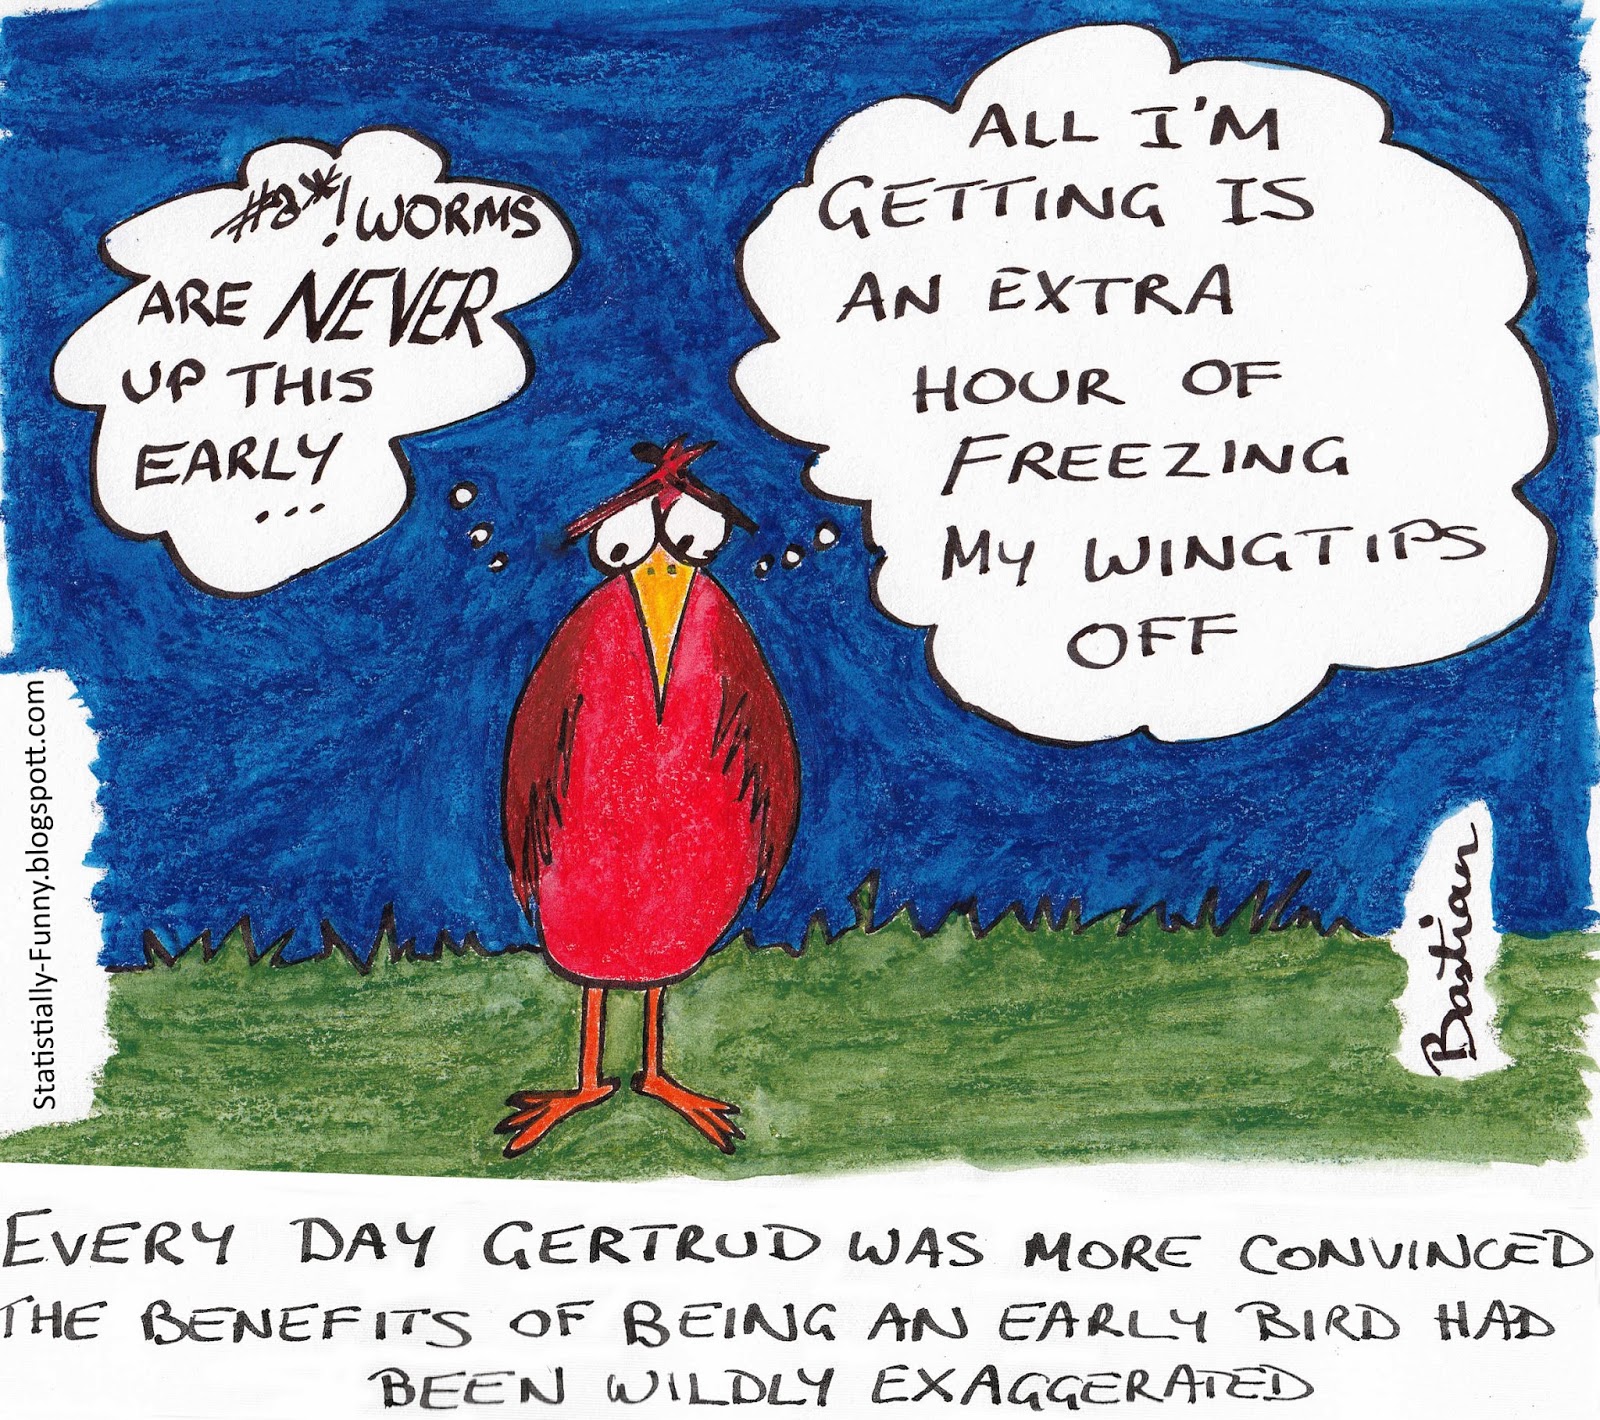
Hilda Bastian drew this cartoon at Statistically Funny

Early-bird

heading a general post about the problems with early-detection programs.

There’s a general bias in favour of screening and early detection, because it seems obviously good. And, in fact, there’s a standard mathematical result that the value of information can’t be negative. But the key assumptions in this result are that you know what information you’ve got and that you can just ignore the result if you want to. It doesn’t apply to real-life medical testing.

Meet Manasi Parulekar, Statistics Summer Scholar

Every year, the Department of Statistics offers summer scholarships to a number of students so they can work with our staff on real-world projects. We’ll be profiling them on Stats Chat. 

Manasi is working with Dr Yannan Jiang on a project titled Bariatric surgery and diabetic retinopathy progression. She explains:

“Bariatric surgery is an effective method to achieve rapid weight reduction along with a sustained remission of type 2 diabetesManasi (T2D). However, the effect of the surgery on the progression of diabetes retinopathy (DR) – retinal damage that can lead to loss of vision in both the short and long term – is not documented.

“It is hypothesised that bariatric surgery could be associated with a worsening of DR. In this project, I will be working together with Debbie Chen, a medical student from the Faculty of Medical and Health Sciences, under the joint supervision of Dr Rinki Murphy and Dr Yannan Jiang, to assess the impact of bariatric surgery on DR among patients with T2D.

“This research is very useful, as the results will be used to create the first retinal screening protocols for those having undergone bariatric surgery. So we’ll be creating guidelines to channel limited resources and identify those most at risk.

“I have completed a Bachelor of Science majoring in Psychology and Pharmacology and a Graduate Diploma in Statistics. In 2014 I will be doing my Honours in Statistics.

“Statistics excites me as it is an incredibly diverse field that is applicable to almost everything we do. It is fun to be able to break down large datasets to find patterns and solve problems to get a better understanding of the world around us. The Department of Statistics at the University of Auckland has made the experience especially enjoyable as the lecturers are friendly and approachable and the administration staff are very helpful, creating a great environment in which to learn.

“Over the summer, I will be relaxing by drawing, catching up with family and friends – and I am spending two weeks in India around New Year.”


December 30, 2013

Diversification

There’s a story on NPR news about college advertising brochures.

Pippert and his researchers looked at more than 10,000 images from college brochures, comparing the racial breakdown of students in the pictures to the colleges’ actual demographics. They found that, overall, the whiter the school, the more diversity depicted in the brochures, especially for certain groups.

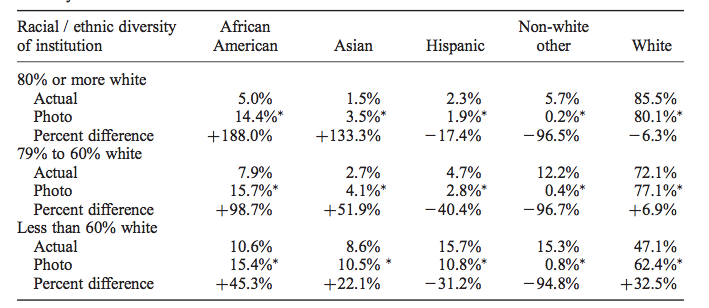
When you look at the research paper it turns out that’s not quite right. The main data table (Table 3) is

diversity

What it shows is that the proportion of African-American students in photos in the brochure is actually pretty much constant, regardless of the proportion at the university. It’s the exaggeration that increases for whiter campuses.  It would have been nice to see this in a graph (and also perhaps see White+Asian pooled), but sociology doesn’t routinely do graphs (Kieran Healy has a paper trying to get them to)

Interestingly, the 15% or so proportion of African-American students in photos is above the proportion in the population as a whole (12.4%), but is very close to the proportion in the 16-19 age band, which includes the target audience for these brochures. That may well be just a coincidence, since there’s enough geographical variation that basically no-one is exposed to what the US population proportion looks like.