January 14, 2014

Meet Bor-Kuan Song, Statistics summer scholar

Every year, the Department of Statistics at the University of Auckland offers summer scholarships to a number of students so they can work with our staff on real-world projects.  Hongbin is working with Dr. Steffen Klaere on a project called Comparing and visualising measures of biodiversity. Bor-Kuan (below) explains:

“Our project is about acquiring and modifying data on biodiversity in New Zealand and possibly combining them into a visualisation in the form of maps. We will try look into the interaction between and within New Zealand birds, plants and soil compositions. Bor-Kuan Song “As technology develops and the availability of web storage space increases, it becomes easier to compare data from different sources. This presents an opportunity to assess the biodiversity in the NZ ecosystem, and have a better understanding of it.

“I’m studying a Bachelor of Science majoring in Statistics and Computer Science, and I’ve already finished a Bachelor of Music majoring in accordion performance. I’m into maths as well and have done most of the Stage II maths courses. My goal is to do actuarial studies, and so statistics, and, in part, computer science, will be a big part of it.”

The dangers of better measurement

An NPR News story on back pain and its treatment

One reason invasive treatments for back pain have been rising in recent years, Deyo says, is the ready availability of MRI scans. These detailed, color-coded pictures that can show a cross-section of the spine are a technological tour de force. But they can be dangerously misleading.

This MRI shows a mildly herniated disc. That's the sort of thing that looks abnormal on a scan but may not be causing pain and isn't helped by surgery.

This MRI shows a mildly herniated disc. That’s the sort of thing that looks abnormal on a scan but may not be causing pain and isn’t helped by surgery.

“Seeing is believing,” Deyo says. “And gosh! We can actually see degenerated discs, we can see bulging discs. We can see all kinds of things that are alarming.”

That is, they look alarming. But they’re most likely not the cause of the pain.

Health food research marketing

The Herald has a story about better ways to present nutritional information on foods

“Our study found that those who were presented with the walking label were most likely to make healthier consumption choices, regardless of their level of preventive health behaviour,” Ms Bouton said.

“Therefore, consumers who reported to be unhealthier were likely to modify their current negative behaviour and exercise, select a healthier alternative or avoid the unhealthy product entirely when told they would need to briskly walk for one hour and 41 minutes to burn off the product.

“The traffic light system was found to be effective in deterring consumers from unhealthy foods, while also encouraging them to consume healthy products.”

This sounds good. And this is a randomised experiment, which is an excellent feature.

However, it’s just an online survey of 591 people, about a hypothetical product, so what it actually found was that the labelling system was effective in deterring people from saying they would buy unhealthy foods, encouraging them to say they would consume healthy products and made them more likely to say they would exercise. That’s not quite so good. It’s a lot easier to get people to say they are going to eat better, exercise more, and lose weight that to get them to actually do it.

Another interesting feature is that this new research has appeared on the Herald website before. In October 2012 there was a story based on the first 220 survey responses

Not only were people more likely to exercise when they saw such labels, they also felt more guilty, Ms Bouton said.

“My findings showed that the exercise labelling was significantly more effective in both chocolate and healthier muesli bars in encouraging consumers to exercise after consumption.

“It increased the likelihood of having higher feelings of guilt after consumption and was more likely to stop [the participant] consuming the chocolate bar with the exercise labelling.”

The 2012 story still didn’t raise the issue of what people said versus actual behaviour, but it did get an independent opinion, who pointed out that calories aren’t the only purpose of food labelling.

More importantly, the stories and the two press releases are all the information I could find online about the research. There don’t seem to be any more details either published or in an online report. It’s good to have stories about scientific research, and this sort of experiment is an important step in thinking about food labelling, but the stories are presenting stronger conclusions that can really be supported by a single unpublished online survey.

January 13, 2014

Meet Savannah Post, Statistics summer scholar

Every year, the Department of Statistics offers summer scholarships to a number of students so they can work with our staff on real-world projects. We’ll be profiling them on Stats Chat.

Savannah is working with Professor Alan Lee on a project called Modelling criminal sentencing. Savannah explains:

Savannah Post

“The aim of my project is to identify the factors that are influencing sentencing outcomes in our justice system. Sentencing outcomes include both the type of punishment which is handed down – anything from a discharge without conviction to imprisonment – and also the length of the sentence imposed.

“In an ideal situation, the variation we see in sentencing outcomes should be explained purely by the crimes committed and the criminal history of the convicted person. Problems obviously arise when sentencing outcomes are influenced by illegitimate factors such as race. If race (or any other irrelevant factor) remains an influential factor in sentencing, even after the offending and criminal history have been taken into account, then certain groups in our society are being treated unfairly by the justice system, which is a major concern. The purpose of my research is to identify whether or not this is the case.

“This is useful research as the powers of the justice system are immense and criminal sentencing changes lives: not only the life of the person who is convicted but also the lives of that person’s family, friends and wider community. It’s absolutely essential that those powers are applied in the fairest way – without discrimination, in other words.

“I’ve just finished my third year of a BSc/LLB conjoint degree, so I have another two years to go. This is my second summer research project and I’m really enjoying the opportunity to experience another side of statistics.

“At the moment, I don’t have any clear ideas about where I’d like to go after finishing university, but I’m interested in the developing trend towards evidence-based policies in local and national government. I’m hoping to find an internship or something similar so that I can find out some more about the opportunities available.

“On a personal/academic level, the methodical and logical nature of statistics appeals to me. I also enjoy the combination of mathematical and interpretive skills that statistics requires. On another level, I think statistics is really important for society as a whole, because it can show us truths which would otherwise be obscured, either because the data is too overwhelming for us to comprehend or because our own prejudices have been influencing our perception of that data.

“I had a busy start to the summer, travelling to North America on a choir tour. It was loads of fun (but cold!), particularly since I had never been there before. Aside from my research, my plan for the rest of the summer is to relax and rejuvenate prior to hitting the books again in March.”

 

January 10, 2014

Why data isn’t enough

By a data enthusiast, Felix Salmon, writing at Wired

After disruption, though, there comes at least some version of stage three: over­shoot. The most common problem is that all these new systems—metrics, algo­rithms, automated decisionmaking processes—result in humans gaming the system in rational but often unpredictable ways. Sociologist Donald T. Campbell noted this dynamic back in the ’70s, when he articulated what’s come to be known as Campbell’s law: “The more any quantitative social indicator is used for social decision-making,” he wrote, “the more subject it will be to corruption pressures and the more apt it will be to distort and corrupt the social processes it is intended to monitor.”

Meet Mengdan Yu, Statistics summer scholar

Every year, the Department of Statistics offers summer scholarships to a number of students so they can work with our staff on real-world projects. We’ll be profiling them on Stats Chat.

Mengdan (below) is working with Jessica McLay on a project titled The simario R package. She explains:

Mengdan Yu

“The simario R package is a collection of R functions for performing dynamic microsimulation developed by  COMPASS (the Centre of Methods and Policy Application in the Social Sciences at the University of Auckland). Dynamic microsimulation is used to test ‘what if?’ situations.  The starting point of the simulation is a set of attributes for each unit (usually individual) and the attributes (variables) are simulated or updated in annual steps.  User-specified modifications can be made on the variables at the start or any point during simulation in order to see the effects on output attributes of interest.

“A simple demonstration microsimulation model (demo model) using the simario R functions was created two years ago, but the focus since then has been on developing a complicated microsimulation model called Modelling the Early Life Course (MELC).  Compared to the demo model, the MELC model uses newer versions of the simario functions and has had a lot of additional functionality built in.

“What I’m doing for my summer project is ensuring that the newer versions of the simario functions  work properly with the demo model and extend the demo microsimulation model.  The extension includes adding more variables to the system, showcasing the different ways variables can be simulated over time and including more of the functionality that is currently in MELC but not in the demo model.  I will also be checking the documentation for all the functions in the simario package to make it ready to publish as an official R package.

“This is useful research as dynamic microsimulation is increasingly used, especially in government, to help in making policy decisions.  There are a number of programming languages used to create microsimulation models, including those based on C++, C#, SAS, and Java.  However, given the prominence of the R language, a package for microsimulation in R could prove useful and helpful to analysts attempting microsimulation.  The demo model in conjunction with an article (to be written later by COMPASS) will show how to put the functions together to create a working microsimulation model.

“This is my third year of a Bachelor of Science majoring in Statistics and Computer Science.  Initially, I chose statistics because I’m into calculating probabilities, and have been since I was a child. As I learned more about stats, especially analysing data by using software, I appreciated even more how useful the subject is in many areas. Studying statistics has improved my logic thinking and my ability to solve real-life problems with stats techniques.

“For the rest of the summer, I’d like to do something relaxing: hang out with my friends, sleep at home and watch dramas so I can be positive and energetic for next semester.”


January 9, 2014

Infographic of the week

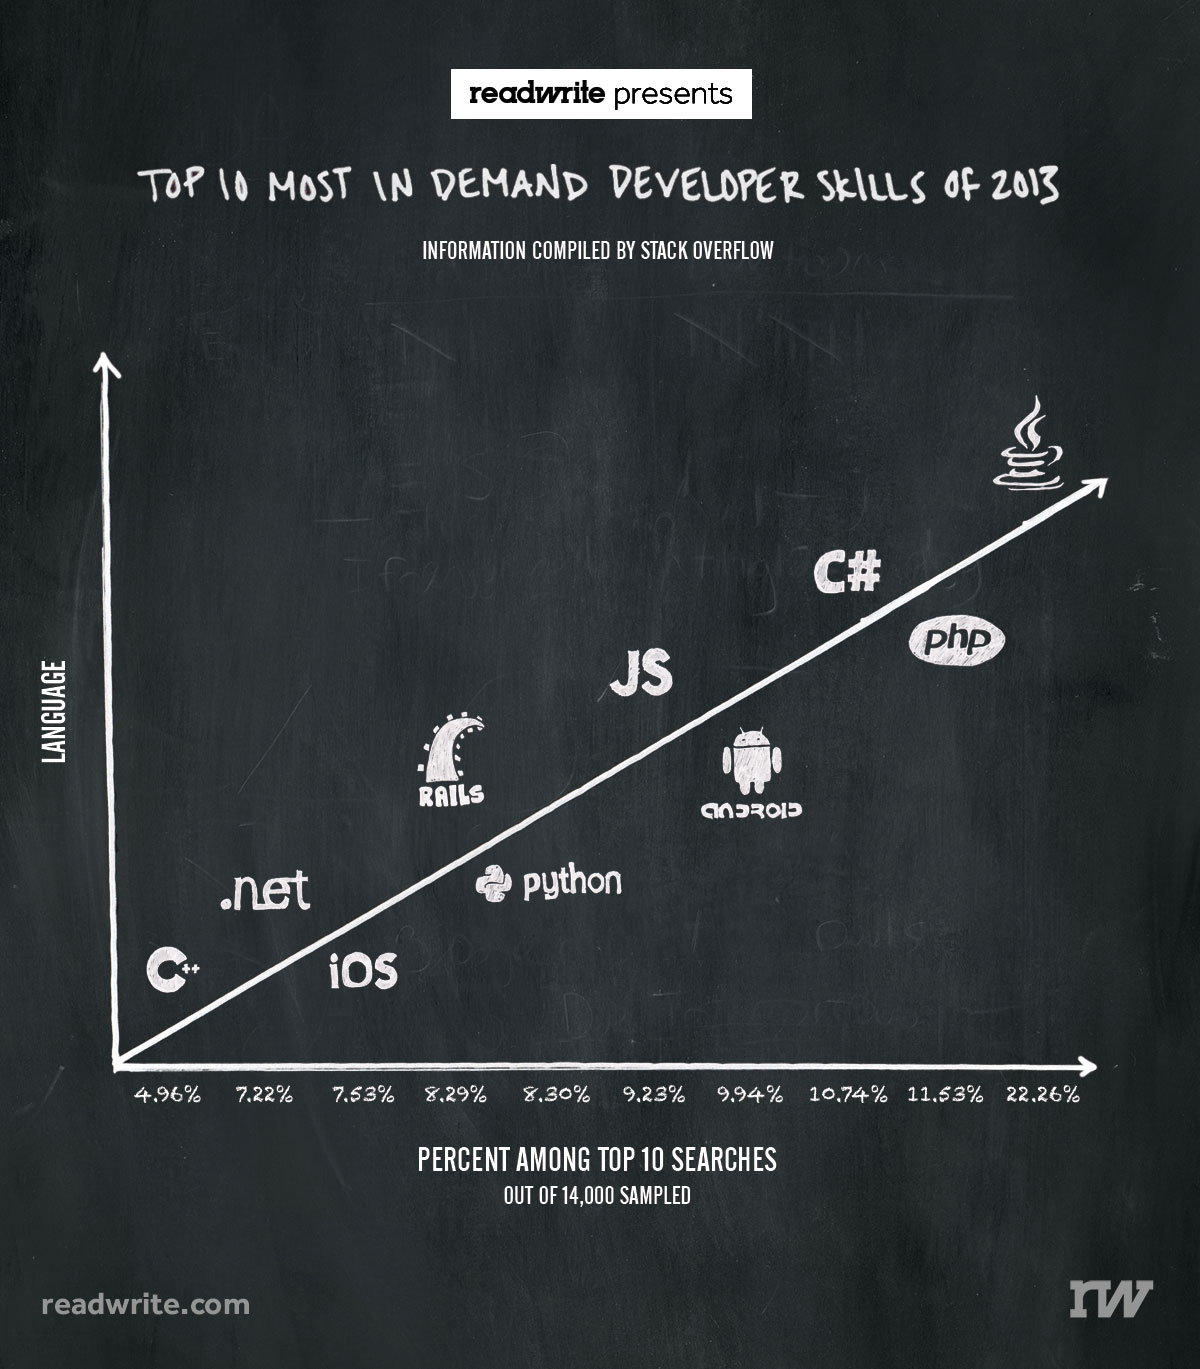
Via @keith_ng, this masterpiece showing that more searches for help lead to more language. Or something.

badlang

It’s not, sadly, unusual to see numbers being used just for ordering, but in this case the numbers don’t even agree with the vertical ordering.  And several of them aren’t, actually, languages. And the headline is just bogus.

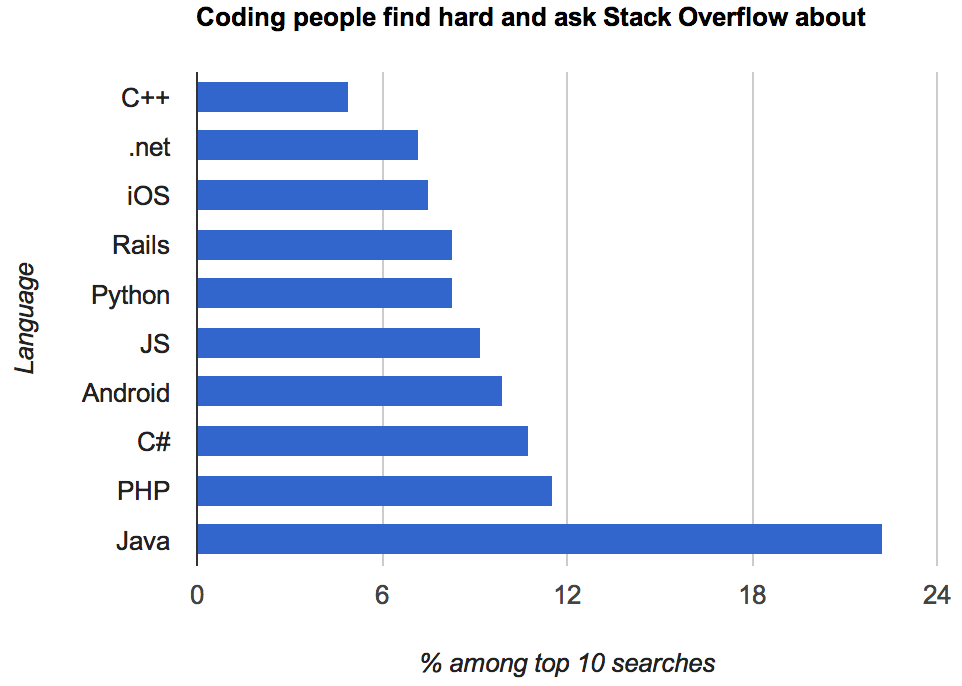
This version, by Kevin Marks (@kevinmarks), at least is accurate and readable.

oklang

but it’s hard to tell how much of Java’s dominance is due to it being popular versus being confusing.

Adam Bard has data on the most popular languages on the huge open-source software repository GitHub. This isn’t quite the right denominator, since Stack Overflow users aren’t quite the same population as GitHub users, but it’s something.  Assigning iOS, Android, and Rails, to Objective-C, Java, and Ruby respectively, and scaling by GitHub popularity, we find that C# has the most StackOverflow queries per GitHub commit; Objective-C and Java have about two-thirds as many.  In the end, though, this data isn’t going to tell you much about either high-demand programming skills or the relative friendliness of different programming languages.


Heat wave in Greenland

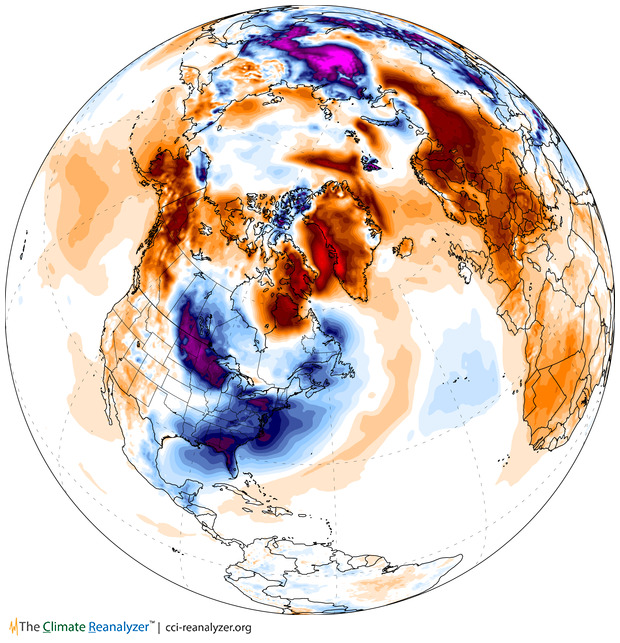
Following up on Monday’s post, here is the estimated surface air temperature anomaly yesterday over North American and the Arctic, from the site Climate Reanalyzer

T2_anom_satellite1


“Anomaly” means this is the temperature relative to the 1980-2000 average for the time of year. The US midwest and east cost are cold, as is Siberia, but Greenland, northern Europe, and most of Russia are hot.  The northern hemisphere as a whole is half a degree above average, and the Arctic is 1.7 degrees above.

This picture still requires weather models to combine weather-station and satellite measurements and extrapolate them across the globe. That’s done by NOAA’s Global Forecast System, which is a fairly uncontroversial piece of modeling.

January 7, 2014

NZ electoral visualisations

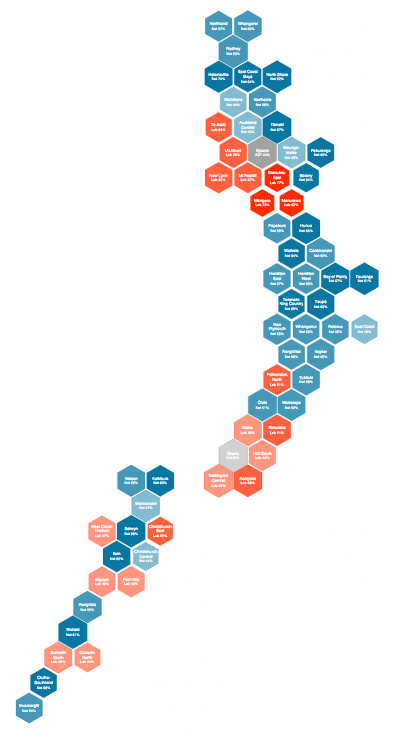
The first post at the new Hindsight blog is on Chris McDowall’s hexagonal maps of NZ political geography.

hexmap


He also has some slides describing the construction of another visualisation, relating party vote to deprivation index.

How dangerous is the rest of the world?

Both Stuff and the Herald have stories today based on MFAT statistics on consular assistance provided for deaths and accidents overseas.  The basic message is that deaths overseas are increasing.

Both sites have interactive graphics: Stuff has a clicky map, and the Herald has barplots where you can select a country. A very nice feature of the Herald story is that they have more data, and a link to let you download it. They got the data under the Official Information Act, which is an impressive-sounding way of saying they asked MFAT for it (as Graeme Edgeler has pointed out, even ringing up some departmental office and asking what time they’re open is an Official Information Act request.)deaths

From the extended data it’s clear that consular assistance for deaths is up a lot over time. That’s a much bigger increase than the number of trips overseas, and the increase looks pretty similar if you exclude Australia, which is unrepresentative because so many Kiwis actually live there. I don’t have any real idea why this is happening, and apparently neither do the journalists.

It’s interesting to look at how dangerous foreign travel is based on these data.  For Thailand, the story in Stuff quotes 115000 trips and 18 deaths in the 9 months to September 2013. That gives a mortality rate of 0.16 per 1000 trips. The annual mortality rate for New Zealand as a whole is 6.8 per 1000 people per year, but travellers tend to be younger and healthier than average. For twentysomethings, the annual mortality rate is about 0.6 per 1000 per year, so the average trip uses up at most 3 months worth of mortality risk — travelling to Thailand is dangerous, but not very dangerous.   Even then, we can’t be sure that it’s Thailand that is dangerous: other contributing explanations could be that people do riskier things while they are there, or that the sort of people who travel to Thailand are prone to taking more risks.  The figure for all countries is about half that for Thailand, though it’s less reliable because of the difficulty in knowing how to handle Australia.

The figures for deaths while travelling should be fairly reliable — I’d expect most deaths of travellers to require some consular assistance — but the figures for accidents are obviously less complete. That didn’t stop Stuff saying

But according to the figures, deaths far outnumber accidents and injuries for New Zealanders across the globe.

The phrase “according to the figures” is doing a lot of work in that sentence, if you want to be able to say it with a straight face.


Update: Luis Apiolaza tracked down data(XLS) on deaths of visitors to NZ. Mortality is about 0.05-0.07 per 1000 trips. Visitors are safer here than we are abroad.