September 11, 2013

Where’s my tram

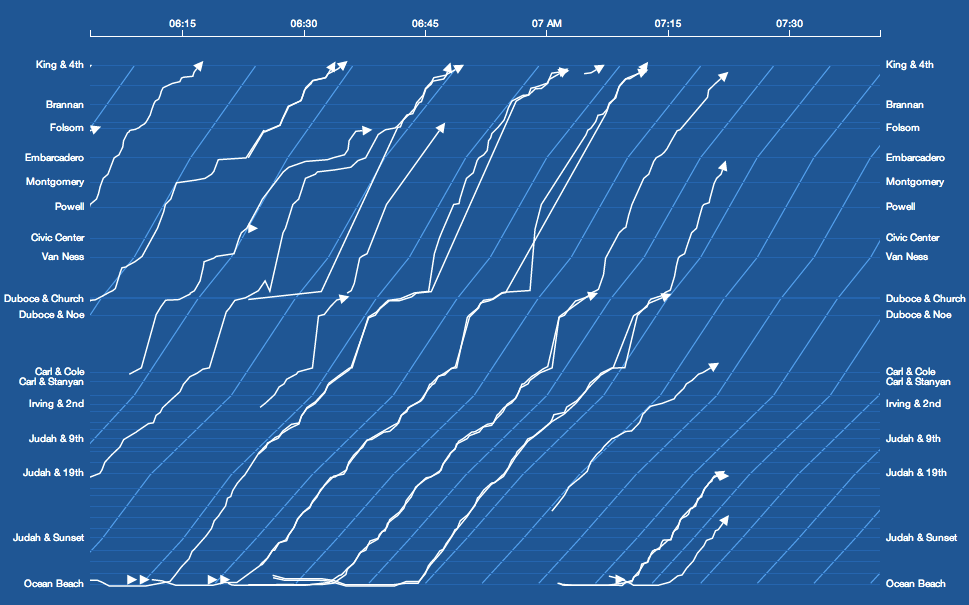
A live visualisation of  locations for a light-rail system in San Francisco. The diagonal lines show the timetable schedule, so you can see speed as well as lateness

sfbus


Something like this for Auckland buses would be neat, but, sadly, the bus location data are secret.

September 10, 2013

ITM Cup Predictions for Round 5

I have now been able to assemble the data for predicting the ITM Cup. The success figures stated below are what would have been achieved had I started predicting in Round 1. The parameters for this season’s predictions were chosen without considering any results from this year and the method is purely algorithmic once the parameters have been chosen.

Team Ratings for Round 5

Here are the team ratings prior to Round 5, along with the ratings at the start of the season. I have created a brief description of the method I use for predicting rugby games. Go to my Department home page to see this.

Here are the team ratings prior to this week’s games, along with the ratings at the start of the season.

Current Rating Rating at Season Start Difference
Canterbury 24.16 23.14 1.00
Wellington 10.98 6.93 4.00
Auckland 9.27 9.02 0.20
Counties Manukau 1.52 4.36 -2.80
Waikato 0.84 5.25 -4.40
Tasman -0.03 -6.29 6.30
Taranaki -1.08 3.92 -5.00
Bay of Plenty -3.10 -1.96 -1.10
Hawke’s Bay -4.36 -6.72 2.40
Otago -5.53 -4.44 -1.10
North Harbour -7.65 -7.43 -0.20
Northland -8.08 -8.26 0.20
Manawatu -9.84 -8.97 -0.90
Southland -10.38 -11.86 1.50


Performance So Far

So far there have been 30 matches played, 24 of which were correctly predicted, a success rate of 80%.

Here are the predictions for last week’s games.

Game Date Score Prediction Correct
1 Auckland vs. Counties Manukau Sep 04 22 – 20 11.00 TRUE
2 Bay of Plenty vs. Canterbury Sep 05 18 – 48 -21.40 TRUE
3 Southland vs. Waikato Sep 06 20 – 16 -8.80 FALSE
4 Tasman vs. Otago Sep 06 49 – 16 5.60 TRUE
5 Taranaki vs. Auckland Sep 07 15 – 51 -0.10 TRUE
6 Hawke’s Bay vs. Counties Manukau Sep 07 24 – 27 -1.10 TRUE
7 Manawatu vs. North Harbour Sep 08 15 – 12 2.20 TRUE
8 Northland vs. Wellington Sep 08 10 – 30 -13.50 TRUE


Predictions for Round 5

Here are the predictions for Round 5. The prediction is my estimated expected points difference with a positive margin being a win to the home team, and a negative margin a win to the away team.

Game Date Winner Prediction
1 Taranaki vs. Hawke’s Bay Sep 11 Taranaki 7.80
2 Wellington vs. Bay of Plenty Sep 12 Wellington 18.60
3 Manawatu vs. Southland Sep 13 Manawatu 5.00
4 North Harbour vs. Tasman Sep 13 Tasman -3.10
5 Waikato vs. Auckland Sep 14 Auckland -3.90
6 Canterbury vs. Otago Sep 14 Canterbury 34.20
7 Counties Manukau vs. Taranaki Sep 15 Counties Manukau 7.10
8 Hawke’s Bay vs. Northland Sep 15 Hawke’s Bay 8.20


Currie Cup Predictions for Round 6

Team Ratings for Round 6

Here are the team ratings prior to Round 6, along with the ratings at the start of the season. I have created a brief description of the method I use for predicting rugby games. Go to my Department home page to see this.

Here are the team ratings prior to this week’s games, along with the ratings at the start of the season.

Current Rating Rating at Season Start Difference
Western Province 3.03 4.47 -1.40
Lions 2.50 -1.22 3.70
Sharks 2.48 3.24 -0.80
Cheetahs -1.71 -2.74 1.00
Blue Bulls -2.75 0.59 -3.30
Griquas -5.70 -6.48 0.80


Performance So Far

So far there have been 15 matches played, 7 of which were correctly predicted, a success rate of 46.7%.

Here are the predictions for last week’s games.

Game Date Score Prediction Correct
1 Griquas vs. Lions Sep 07 32 – 38 0.50 FALSE
2 Blue Bulls vs. Cheetahs Sep 07 26 – 10 4.40 TRUE
3 Western Province vs. Sharks Sep 07 25 – 19 8.50 TRUE


Predictions for Round 6

Here are the predictions for Round 6. The prediction is my estimated expected points difference with a positive margin being a win to the home team, and a negative margin a win to the away team.

Game Date Winner Prediction
1 Cheetahs vs. Lions Sep 13 Cheetahs 3.30
2 Griquas vs. Sharks Sep 14 Sharks -0.70
3 Blue Bulls vs. Western Province Sep 14 Blue Bulls 1.70


NRL Predictions for Finals Week 1

Team Ratings for Finals Week 1

Here are the team ratings prior to this week’s games, along with the ratings at the start of the season. I have created a brief description of the method I use for predicting rugby games. Go to my Department home page to see this.

Current Rating Rating at Season Start Difference
Roosters 11.27 -5.68 17.00
Storm 10.28 9.73 0.60
Sea Eagles 7.75 4.78 3.00
Cowboys 6.88 7.05 -0.20
Rabbitohs 6.08 5.23 0.80
Knights 4.33 0.44 3.90
Bulldogs 4.19 7.33 -3.10
Titans 2.11 -1.85 4.00
Sharks 1.61 -1.78 3.40
Warriors -0.89 -10.01 9.10
Panthers -2.57 -6.58 4.00
Broncos -5.15 -1.55 -3.60
Dragons -8.18 -0.33 -7.90
Raiders -10.23 2.03 -12.30
Wests Tigers -11.37 -3.71 -7.70
Eels -19.87 -8.82 -11.00


Performance So Far

So far there have been 192 matches played, 116 of which were correctly predicted, a success rate of 60.42%.

Here are the predictions for last week’s games.

Game Date Score Prediction Correct
1 Broncos vs. Bulldogs Sep 05 16 – 11 -7.30 FALSE
2 Rabbitohs vs. Roosters Sep 06 12 – 24 2.14 FALSE
3 Dragons vs. Warriors Sep 07 19 – 10 -5.73 FALSE
4 Storm vs. Titans Sep 07 23 – 22 15.58 TRUE
5 Cowboys vs. Wests Tigers Sep 07 50 – 22 21.44 TRUE
6 Sea Eagles vs. Panthers Sep 08 26 – 38 21.52 FALSE
7 Knights vs. Eels Sep 08 54 – 6 23.87 TRUE
8 Raiders vs. Sharks Sep 08 18 – 38 -4.18 TRUE


Predictions for Finals Week 1

Here are the predictions for Finals Week 1. The prediction is my estimated expected points difference with a positive margin being a win to the home team, and a negative margin a win to the away team.

Game Date Winner Prediction
1 Rabbitohs vs. Storm Sep 13 Rabbitohs 0.30
2 Sharks vs. Cowboys Sep 14 Cowboys -0.80
3 Roosters vs. Sea Eagles Sep 14 Roosters 3.50
4 Bulldogs vs. Knights Sep 15 Bulldogs 4.40


Excellence in statistical reporting award

I missed this when it came out in early August. Alan Schwarz, of the New York Times, has won this year’s award for excellence in statistical reporting, from the American Statistical Association.

He’s probably best known for his reporting on concussion and brain injury in footballers, which was a finalist for the Pulitzer Prize in 2011. Similar issues are now being raised in rugby.

Tell us what you really think

From the Herald (and originally the Daily Mail)

People who bottle up their feelings are at least a third more likely to die young than those who regularly express what they’re thinking.

Not what the study says — there is a hazard ratio of 1.35 but even the researchers only claim this is a 3 year reduction in life expectancy and they don’t say anything about how likely people are to die young.

But when the researchers looked at specific causes of death they discovered that the risks increased by 47 per cent for heart disease and 70 per cent for cancer.

This was a fairly small study, with only 34 heart disease deaths and 37 cancer deaths, and the authors make it pretty clear the evidence for heart disease was too weak even for them to be comfortable — they say

Findings for CVD death were in a direction and of a magnitude consistent with prior work though they did not reach statistical significance.

How do I know all this? Well the story doesn’t give the names of any of the researchers, let alone link, but it does give the journal name and it turns out the paper appeared only a month ago, so it didn’t take too much work.

Assuming the correlation is real, it could still easily be due to other factors.  The researchers deliberately didn’t attempt any control for health risks, in case these were due to emotion suppression. For example, they didn’t distinguish smokers and non-smokers, because of the concern that smoking might be due to emotion suppression.  They didn’t even ask if people already had a cancer diagnosis at the start of the study.

The story does quote an independent expert. Well, sort of.

London-based business psychologist Voula Grand said: “It has long been thought that cancers are partly the result of suppressed emotions.

Judging from their web sites about cancer prevention, neither the American Cancer Society nor Cancer Research UK seems to know about this. They might be more reliable than the Daily Mail.
 

Marking predictions to market

A couple of weeks ago, I wrote about a Sydney Morning Herald story on new electorate-specific robopolls and their surprising predictions. Tim Colebatch at the SMH wrote

Uh-huh. Lonergan’s own national poll reports only a 2 per cent swing against Labor. Yet in the three seats it polled individually, it found an average swing of 10 per cent. That’s huge, far bigger than we have seen in any Federal election since 1943.

and I was similarly dubious.

We now have the facts: the national (two-party preferred) swing against Labour is just over 3%, and the swing in Kevin Rudd’s seat of Griffith, one of the three specifically polled and predicted to have a swing of 10.5%, was 5.42%. The other two seats mentioned in the story as polled by Lonergan were Forde (robopoll swing 8.5%, actual swing 2.5%) and Lindsay (robopoll swing 11%, voters 3.9%)

It looks as though the robopoll skeptics were right. Even though the national swing was larger than the poll predicted, the swings in the target electorates were much smaller.

The data speaks for itself

Wednesday, Sept 4, NZ Herald, lead

Latest Auckland house price stats show a largely flat property market over the past five months and one economist says we may have seen the first sign of regional price pressure easing.

Monday, Sept 9, NZ Herald, lead

Rising New Zealand property values accelerated last month as the lack of listings in Canterbury and Auckland continue to overheat the market, 


September 9, 2013

Prevention vs cure

From Slate

The most important difference between the world today and 150 years ago isn’t airplane flight or nuclear weapons or the Internet. It’s lifespan. We used to live 35 or 40 years on average in the United States, but now we live almost 80. We used to get one life. Now we get two.

The medical developments in the story are important

  • Adrian’s lung spontaneously collapsed when he was 18.
  • Becky had an ectopic pregnancy that caused massive internal bleeding.
  • Carl had St. Anthony’s Fire, a strep infection of the skin that killed John Stuart Mill.*
  • Dahlia would have died delivering a child (twice) or later of a ruptured gall bladder.
  • David had an aortic valve replaced.
  • Hanna acquired Type 1 diabetes during a pregnancy and would die without insulin.
  • Julia had a burst appendix at age 14.
  • Katherine was diagnosed with pernicious anemia in her 20s. She treats it with supplements of vitamin B-12, but in the past she would have withered away.
  • Laura (that’s me) had scarlet fever when she was 2, which was once a leading cause of death among children but is now easily treatable with antibiotics.
  • Mitch was bitten by a cat  and had to have emergency surgery and a month of antibiotics or he would have died of cat scratch fever.

but also tend to emphasize treatment over cure.

For example,  St Anthony’s Fire and scarlet fever (both serious streptococcal infections) could kill, but only in a minority of cases. Type I diabetes and pernicious anemia used to be uniformly fatal, but Type I diabetes occurs in 1-25 per 100,000 and pernicious anemia in about 1 per 1000. Treatment of streptococcal infections was a breakthrough, and we should be really scared of the possibility than Strep. pyogenes finally learns how to beat penicillin, but they aren’t responsible for that much of the improvement in life expectancy.

Dehydration due to gastrointestinal disease, one of the really important killers of infants and children, isn’t mentioned, because the lack of it isn’t salient.  Hardly anyone says “I shouldn’t be alive now because I should have caught rotavirus or cholera at age 2 and died, but didn’t because of clean water, ”  but that’s probably the most important single change we have seen.

Prevention isn’t visible, but it’s still real.

—-ing good survey

From the Broadcasting Standards Authority, via @ColeyTangerina

Scope

  • Quantitative research to provide a monitor of the acceptability of the use of swear words, blasphemies and other expletives in broadcasting over time

Methodology

  • Administered national survey with 1,500 randomly selected individuals aged 18 years and over, stratified by region, age group, gender and ethnicity
  • Online methodology survey was the same approach as used in 2010. This is differentiated from the 1999 and 2005 surveys which made use of a face-to-face interview technique.

It’s pretty clear that the report is going to be unsuitable for some workplaces (that’s kind of the point) but the findings are interesting.  The ranking of unacceptability is not what I would have expected (I’m biased having lived in the US).

Of the 31 words they surveyed, in the context of a movie screening after 8:30pm with a criminal swearing at a police officer, the 27th is one that has been used on this blog (“bullshit”), with 20% unacceptability rating.  The worst-ranked word had  70% unacceptability.  Personally, I don’t think any of the words is unacceptable in that context, but there are several whose use would lower my opinion of the speaker.

They also looked at other scenarios, and the general conclusion seemed to be that it was worse not as bad for actors than for ‘real people’ to swear.