September 13, 2013

How dangerous are weddings?

According to the Herald, the ACC wants us to be careful about weddings — about getting injured at them, that is.

Weddings are supposed to be the happiest day of your life – try telling that to the hundreds of people who make ACC claims for injuries at ceremonies.

From tripping on the bride’s dress to swallowing the ring, nuptials can be surprisingly hazardous.

New figures show at least 600 people made claims to the ACC between 2010 and 2012.

So, how does the 600 claims over three years compare to what you’d expect from an average day?

The ACC accepted 1.7 million new claims last year, which gives about 0.4 claims per person per year, or about 0.001 per person per day.

There were about 20 000 marriages in New Zealand last year, so about 60 000 over 2010-2012, giving about 0.01 ACC claims per marriage.  The 600 reported claims would then be about what you’d expect if there were 10 person-days of exposure per marriage.

My experience is that wedding celebrations typically involve more than ten people, and, with setup and rehearsals, often more than one day.  It looks as though weddings, like Christmas, are actually safer than ordinary days.
What we die of

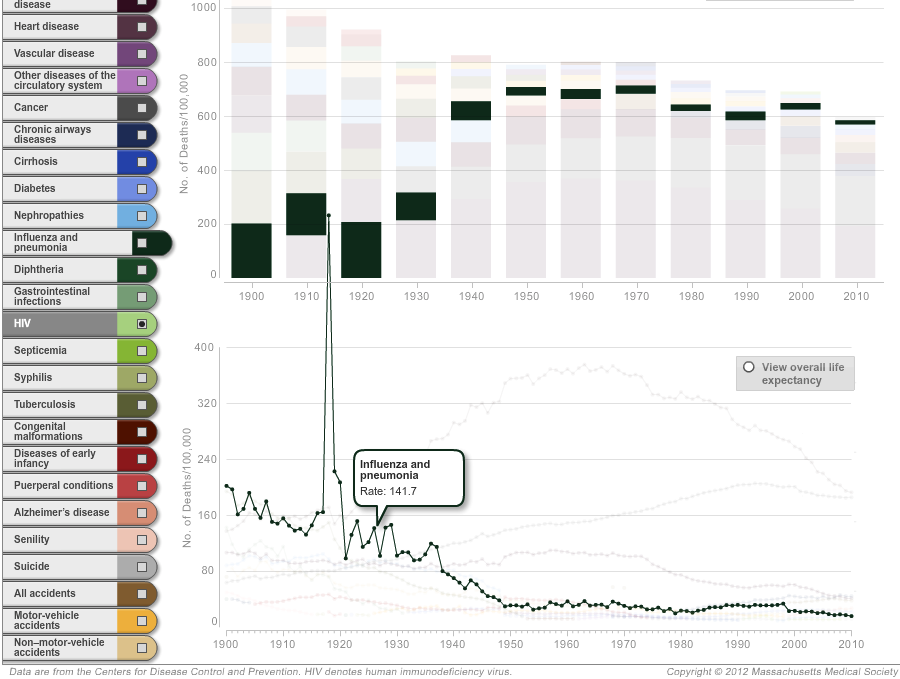
An interesting piece in Slate on longevity (via @juhasaarinen).  Unlike the typical story using life expectancy, it’s by someone who seems to understand what it means. There’s also an interactive graph of how causes of death have changed over time, which is notable for having the best use of a creative y-axis scale I’ve seen in a long time.

If you look at ‘influenza and pneumonia’, there is a general decrease with a dramatic spike in 1919. It’s so dramatic that it pops out of the top of the lower panel and spikes into the upper panel. This is the famous Spanish Flu pandemic — the same  rate in today’s New Zealand would mean over 25000 deaths.  Fortunately the three flu pandemics we’ve had since then have all been much less nasty.

flu


It’s also worth noting that nearly all the decline in infections as a major cause of death happened before antibiotics became widely available in the mid-1940s. That’s the reason I’m not really convinced that antibiotic resistances is going to kill us all, though it’s certainly worth avoiding.


Stats on Radio NZ

Last night’s edition of Our Changing World had two segments by University of Auckland statisticians called James.

Allison Ballance and James Russell talked about seabirds and rat eradication


Ruth Beran and James Curran talked about forensic statistics


Briefly

From this morning’s Twitter feed

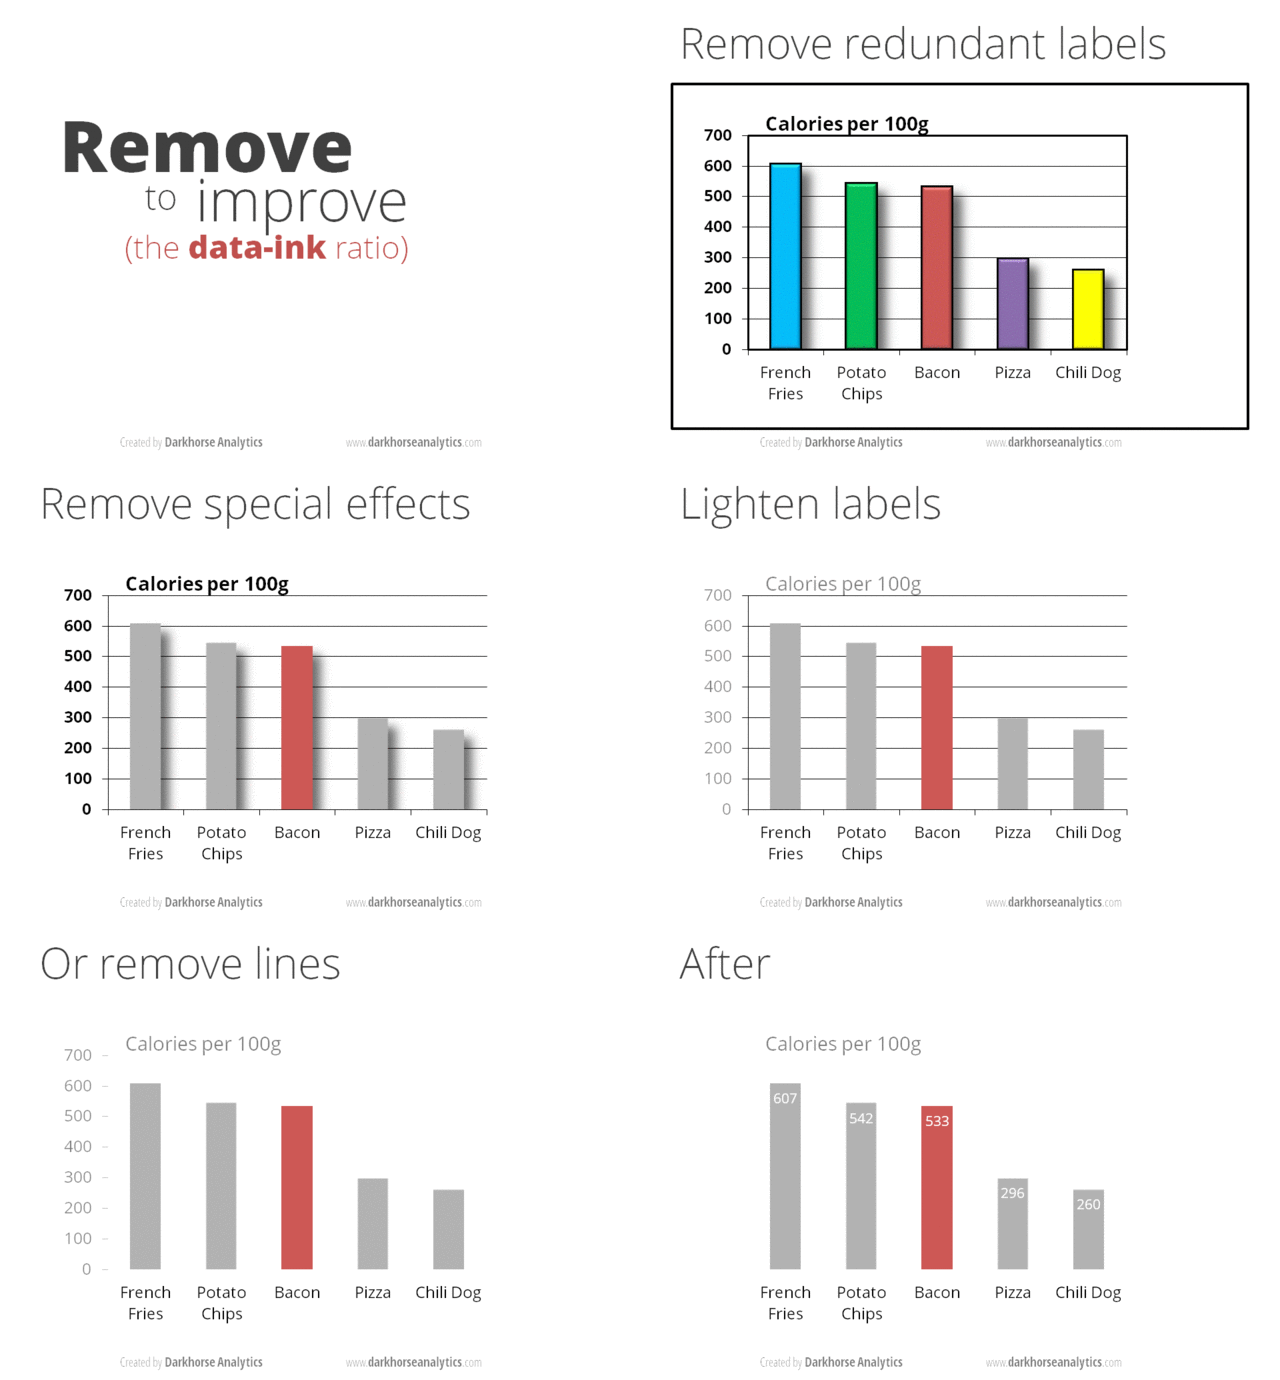
  • An animated GIF (click on it to wake it up) showing how to improve a barchart by removing junk. [from Darkhorse Analytics: Data looks better naked]

data-ink


  • Data journalism: how the data sausage gets made.  Jacob Harris describes how he collected and summarised data on meat recalls in the US
  • The Royal Statistical Society has repeated the simple maths test they gave politicians last year, this time for senior professionals and managers. Less than half of them could give the probability of getting two heads from tossing two coins.
  • However, the same Royal Statistical Society news item ends “The figures have been weighted and are representative of all GB adults (aged 18+)”. This seems to me to fall in the “not even wrong” category. The target group aren’t remotely representative of all British adults, and I’d be surprised if it was even possible to reweight them to the national age distribution.
  • Cathy O’Neill (mathbabe.org) asks why rankings of eg, cars or universities don’t allow the user to change priorities for different attributes (as the OECD Better Life Index does, for example)
September 12, 2013

Rape survey

The Herald had a story on Tuesday about a UN survey of men in nine areas in Asia/Oceania asking about rape and violence against women.  The story is pretty good, and actually has links to the articles in the medical journal Lancet.

Because of the wide publicity and the large scale of the survey I think it’s worth nailing down some of the details to make it harder to dismiss.  (more…)

September 11, 2013

Lottery calculations

Even so often, one of the NZ lottery jackpots gets to be unusually large and we see an increasing stream of search engine hits from people looking for ways to win.

Via @mapcaptenor, here’s an analysis of the USA’s Powerball lottery, with the conclusion

The one sentence takeaway: no matter how big the jackpot gets, you should only buy Powerball tickets for their entertainment value.

In fact, an economics argument can get you this conclusion much more easily. All the facts you have about the lottery are available to pretty much anyone in the country, as is the opportunity to buy tickets. Unless you think you are one of the top handful of smartest investors in New Zealand, you should assume that other people will draw the same conclusion as you about whether it’s worth buying tickets. If you think it’s worth buying, so will quite a lot of other people, and collectively you’ll buy up enough tickets to ensure that the expected benefit falls to nearly zero.


Was Göring a good father?

The Herald, like many other news sources worldwide, has picked up on a paper in the Proceedings of the National Academy of Sciences. Like the other glamorous top science journals, PNAS publishes some top-level science, and also some that is perhaps not quite up to the standard.

The story says that men with smaller testicles make better fathers, based on a fairly weak correlation in a relatively small sample of new fathers. As Dr Isis points out, this sample only included 9 dads who did more childcare than the mothers.

If you look at the paper (which you can’t, unless you have a subscription), you find that there was a moderately strong relationship between testosterone levels in the blood and the ‘parenting quality’ questionnaire. When the researchers compared men with similar levels of testosterone and similar working hours, there was no correlation between testicle size and parenting, but if testosterone and hours at work were ignored there was fairly weak evidence of a correlation between testicle size and parenting.  (The researchers presented their evidence using p-values, with p=0.08 , not up to usual standards. I think it would be unconvincing with other ways of measuring evidence as well)

The Discussion section of the paper starts out

Collectively, these data provide the most direct support to date that the biology of human males reflects a trade-off between mating and parenting effort.  

which is, apparently unintentionally,  a pretty damning criticism.

Oh, the post title? Anyone old and British should be able to explain it

New Zealand women in public life, by the numbers


Statistics New Zealand is marking 120 years of women’s suffrage with a nice little infograph (click to enlarge).


The graphics are a recent development, and long may they continue (and that the print media and teachers make the most of them). The last SNZ graphic I saw marked the birth of a certain baby called George, and looked at a range of facts and figures to do with child-rearing in New Zealand.


Some stats talks

If you’re in Palmerston Nth, next Tuesday 17th, James Curran is talking as part of the Royal Society’s 10×10 series of maths presentations around the country

Advances in science have allowed forensic practitioners to recover and quantify evidence from crime scenes in more ways than ever before. As a consequence, judges, lawyers, and juries struggle to decide or understand what the value of scientific evidence might be, and how it impacts on the case at hand. This talk will look at how statistics is being used to aid in the legal process.

And if you’re in Auckland on October 1, I’m presenting at Nerdnite again, (6:30 for 7pm, Nectar bar, above the Kingslander)

“The game of rock, paper, scissors was known in Asia millennia ago. At about the time of Captain Cook, a French political scientist discovered that it isn’t always possible to construct an ordering by considering things two at a time.  In the 1970s a statistician showed how to cheat at dice using this idea. The implications for experiments with a treatment group and a control group are still underappreciated.”


Cumulative totals tend to increase

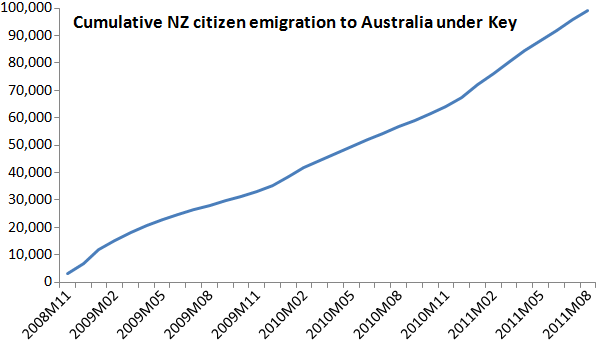
One of our early Stat-of-the-Week awards was for this graph from The Standard

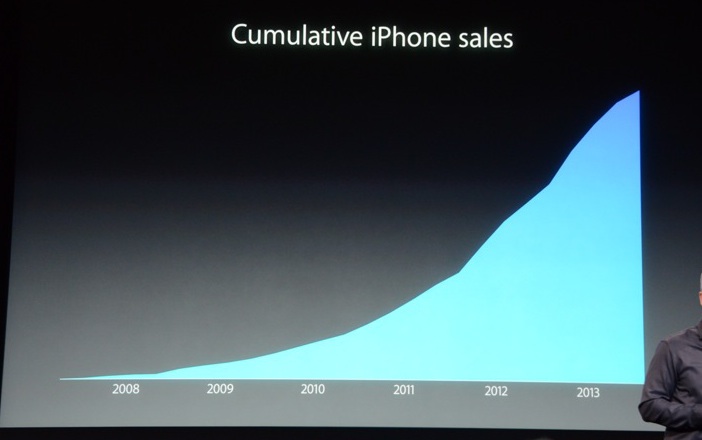
Among the problems is that the graph is cumulative, so it unavoidably goes up.  It’s a good choice if you want the impression of a relentless increase regardless of the data; not so good if you’re trying to inform.

Tim Cook, of Apple, did something similar with iPhone sales at the product release yesterday

iphone-sales

David Yanofsky, at Quartz, overlays the quarterly sales reports

iphone-quarterly


It’s clear that quarterly sales have been declining recently, although it’s also clear that each new iPhone leads to a sales surge.  The quarterly reports actually tell you something about the sales pattern; the cumulative reports really don’t.

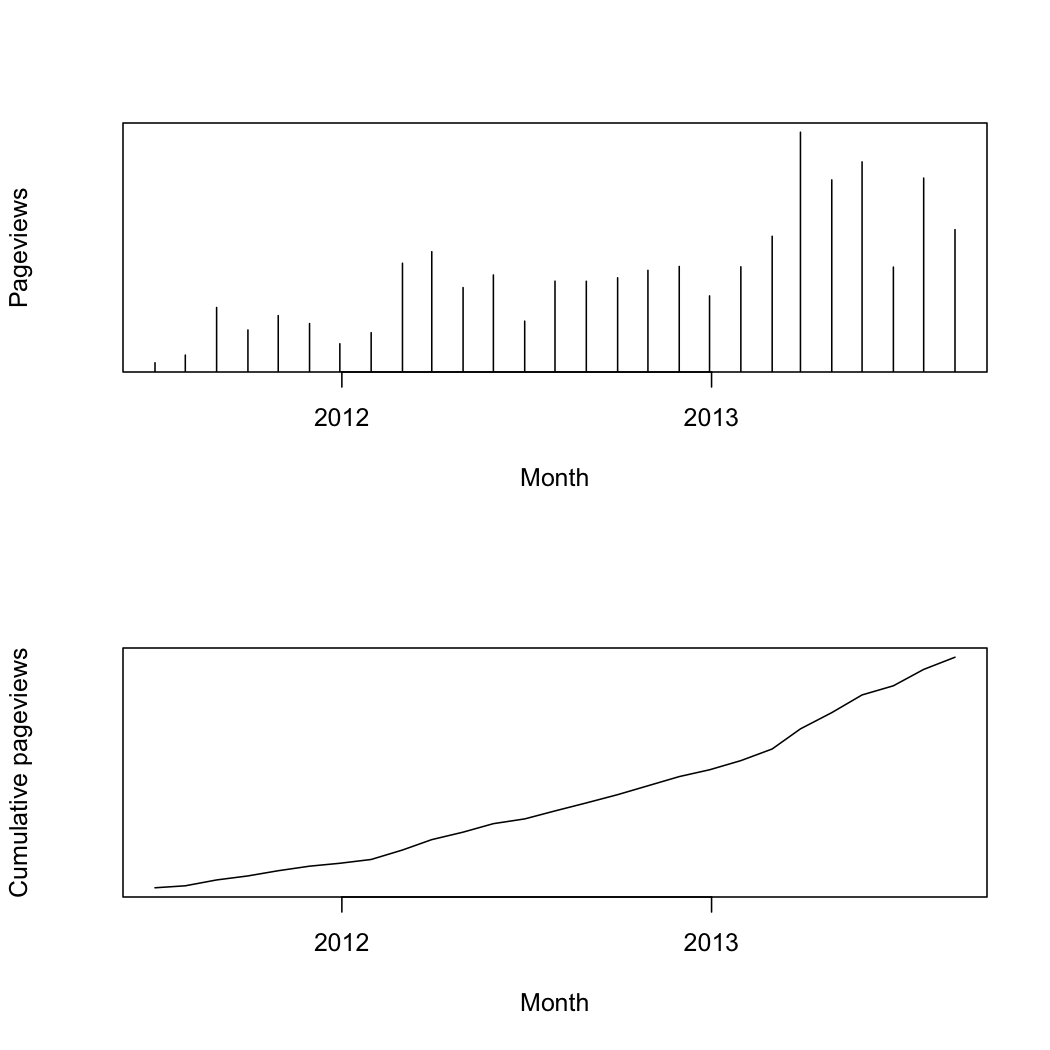
In the same way, although these two graphs of StatsChat page views contain the same information, the first one lets you see  patterns over time, such as the start of the rugby-prediction season, and the times I’m away. Cumulative charts are usually less useful and often misleading, whether deliberately or not.

pageviews