August 17, 2013
How to lie with barcharts
From the Guardian, a story about a barchart in the Sun portraying the cost of ‘green energy’
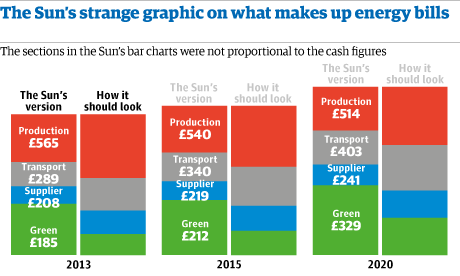
From the Guardian, a story about a barchart in the Sun portraying the cost of ‘green energy’
From a number of fields
So when one particular paper began to strain the servers, attracting hundreds if not thousands of downloads, the entire editorial board began to pay attention. “What,” they asked, “is so special about this paper on the ryanodine receptor of Caenorhabditis elegans?” (For those of you who don’t know, Caenorhabditis elegans is a very common and much-loved model animal—it’s a small, soil-living roundworm with some very useful features. Please don’t ask me what a ryanodine receptor is; I don’t know and I don’t really care.)
Unfortunately these are a little late this week. I simply forgot to do them until just now.
Here are the team ratings prior to Round 23, along with the ratings at the start of the season. I have created a brief description of the method I use for predicting rugby games. Go to my Department home page to see this.
| Current Rating | Rating at Season Start | Difference | |
|---|---|---|---|
| Roosters | 12.36 | -5.68 | 18.00 |
| Sea Eagles | 9.78 | 4.78 | 5.00 |
| Storm | 9.64 | 9.73 | -0.10 |
| Rabbitohs | 6.24 | 5.23 | 1.00 |
| Bulldogs | 4.30 | 7.33 | -3.00 |
| Knights | 4.10 | 0.44 | 3.70 |
| Cowboys | 2.93 | 7.05 | -4.10 |
| Titans | -0.89 | -1.85 | 1.00 |
| Sharks | -1.04 | -1.78 | 0.70 |
| Warriors | -1.18 | -10.01 | 8.80 |
| Broncos | -3.79 | -1.55 | -2.20 |
| Raiders | -4.98 | 2.03 | -7.00 |
| Dragons | -5.53 | -0.33 | -5.20 |
| Panthers | -8.35 | -6.58 | -1.80 |
| Wests Tigers | -11.19 | -3.71 | -7.50 |
| Eels | -16.13 | -8.82 | -7.30 |
So far there have been 160 matches played, 97 of which were correctly predicted, a success rate of 60.62%.
Here are the predictions for last week’s games.
| Game | Date | Score | Prediction | Correct | |
|---|---|---|---|---|---|
| 1 | Storm vs. Rabbitohs | Aug 09 | 26 – 8 | 5.37 | TRUE |
| 2 | Eels vs. Wests Tigers | Aug 09 | 26 – 22 | -1.56 | FALSE |
| 3 | Roosters vs. Raiders | Aug 10 | 28 – 22 | 25.80 | TRUE |
| 4 | Sharks vs. Knights | Aug 10 | 14 – 18 | 0.21 | FALSE |
| 5 | Sea Eagles vs. Warriors | Aug 11 | 27 – 12 | 15.57 | TRUE |
| 6 | Broncos vs. Dragons | Aug 11 | 26 – 24 | 7.30 | TRUE |
| 7 | Panthers vs. Cowboys | Aug 11 | 4 – 36 | -0.47 | TRUE |
| 8 | Bulldogs vs. Titans | Aug 12 | 16 – 26 | 14.61 | FALSE |
Here are the predictions for Round 23. The prediction is my estimated expected points difference with a positive margin being a win to the home team, and a negative margin a win to the away team.
| Game | Date | Winner | Prediction | |
|---|---|---|---|---|
| 1 | Rabbitohs vs. Sea Eagles | Aug 16 | Rabbitohs | 1.00 |
| 2 | Broncos vs. Eels | Aug 16 | Broncos | 16.80 |
| 3 | Raiders vs. Bulldogs | Aug 17 | Bulldogs | -4.80 |
| 4 | Cowboys vs. Titans | Aug 17 | Cowboys | 8.30 |
| 5 | Dragons vs. Sharks | Aug 17 | Dragons | 0.00 |
| 6 | Warriors vs. Panthers | Aug 18 | Warriors | 11.70 |
| 7 | Knights vs. Storm | Aug 18 | Storm | -1.00 |
| 8 | Wests Tigers vs. Roosters | Aug 19 | Roosters | -19.00 |
Nate Silver’s talk at the Joint Statistical Meetings a couple of weeks ago identified groupthink by insiders as a major threat to accurate journalism. It’s natural to believe the opinions of other intelligent, well-informed people, but if they are working from the same limited set of information as you, the fact that they agree with you is not actually good evidence that you’re right.
Tim Harford has a column this week arguing that diversity is important, for basically this reason. Even if, say, women or Maori or Asians or small-town farm boys aren’t actually better at decision-making, the simple fact that they have different starting points can lead to better decision-making by groups. It doesn’t have to, but it can. The New York Times also has a piece on this theme, by political scientist Scott Page.
An important empirical basis for the idea that diversity is, in itself, beneficial is the work of Solomon Asch on conformity. Asch found that even in very simple decisions, many people would follow an obviously-wrong choice made by enough other people. On the other hand, even a single non-conforming voice, and even one that was more wrong than the consensus, could free people to follow the evidence of their own eyes.
There’s a long tradition in law and ethics of thinking about how much harm to the innocent should be permitted in judicial procedures, and at what cost. The decision involves both uncertainty, since any judicial process will make mistakes, and consideration of what the tradeoffs would be in the absence of uncertainty. An old example of the latter is the story of Abraham bargaining with God over how many righteous people there would have to be in the notorious city of Sodom to save it from destruction, from a starting point of 50 down to a final offer of 10.
With the proposed new child protection laws, though, the arguments have mostly been about the uncertainty. The bills have not been released yet, but Paula Bennett says they will provide for protection orders keeping people away from children, to be imposed by judges not only on those convicted of child abuse but also ‘on the balance of probabilities’ for some people suspected of being a serious risk.
We’ve had two stat-of-the-week nominations for a blog post about this topic (arguably not ‘in the NZ media’, but we’ll leave that for the competition moderator). The question at issue is how many innocent people would end up under child protection orders if 80 orders were imposed each year.
The ‘balance of probabilities’ standard theoretically says that an order can be imposed (?must be imposed) if the probability of being a serious risk is more than 50%. The probability could be much higher than 50% — for example, if you were asked to decide on the balance of probabilities which of your friends are male, you will usually also be certain beyond reasonable doubt for most of them. On the other hand, there wouldn’t be any point to the legislation unless it is applied mostly to people for whom the evidence isn’t good enough even to attempt prosecution under current law, so the typical probabilities shouldn’t be that high.
Even if we knew the distribution of probabilities, we still don’t have enough information to know how many innocent people will be subject to orders. The probability threshold here is the personal partly-subjective uncertainty of the judge, so even if we had an exact probability we’d only know how many innocent people the judge thought would be affected, and there’s no guarantee that judges have well-calibrated subjective probabilities on this topic.
In fact, the judicial system usually rules out statistical prior information about how likely different broad groups of people are to be guilty, so the judge may well be using a probability distribution that is deliberately mis-calibrated. In particular, the judicial system is (for very good but non-statistical reasons) very resistant to using as evidence the fact that someone has been charged, even though people who have been charged are statistically much more likely to be guilty than random members of the population.
At one extreme, if the police were always right when they suspected people, everyone who turned up in court with any significant evidence against them would be guilty. Even if the evidence was only up to the balance of probabilities standard, it would then turn out that no innocent people would be subject to the orders. That’s the impression that Ms Bennett seems to be trying to give — that it’s just the rules of evidence, not any real doubt about guilt. At the other extreme, if the police were just hauling in random people off the street, nearly everyone who looked guilty on the balance of probabilities might actually just be a victim of coincidence and circumstance.
So, there really isn’t an a priori mathematical answer to the question of how many innocent people will be affected, and there isn’t going to be a good way to estimate it afterwards either. It will be somewhere between 0% and 100% of the orders that are imposed, and reasonable people with different beliefs about the police and the courts can have different expectations.
Dr Mark Apperley, from Uni of Waikato, with Phil O’Brien
“Big Data” isn’t just big, it’s unstructured.
(via Kate Hannah)
A beautiful map from the Cooper Center for Demographics at the University of Virginia, showing 300 million dots, one for each person in the United States, coloured by the census-reported race/ethnicity categories.
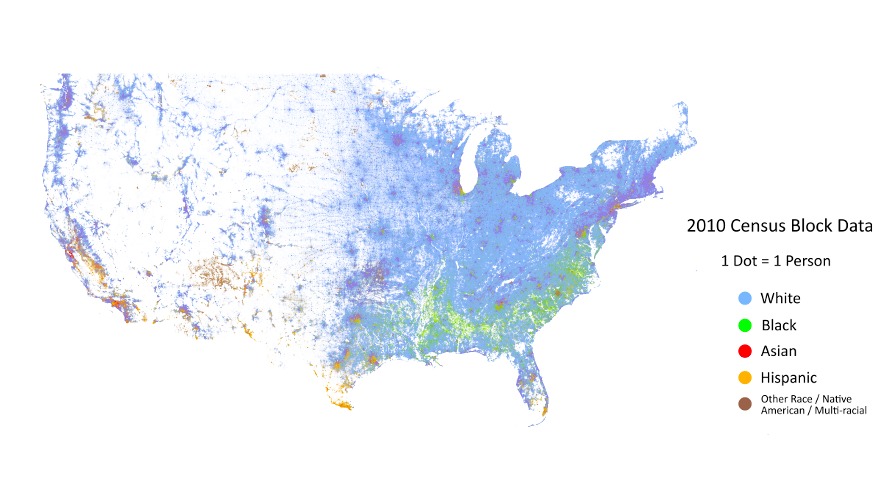
As we’ve pointed out before, the most obvious feature in the map is the change in population density across the north-south ‘dry line’, but it’s the other features that are of most interest. The larger black population across the south-east, and the greater diversity of the cities are obvious.
There’s also a zoomable version of the map for you to explore. Here’s part of Seattle, where I used to live, which is the purple splotch at the top left of the whole-US map
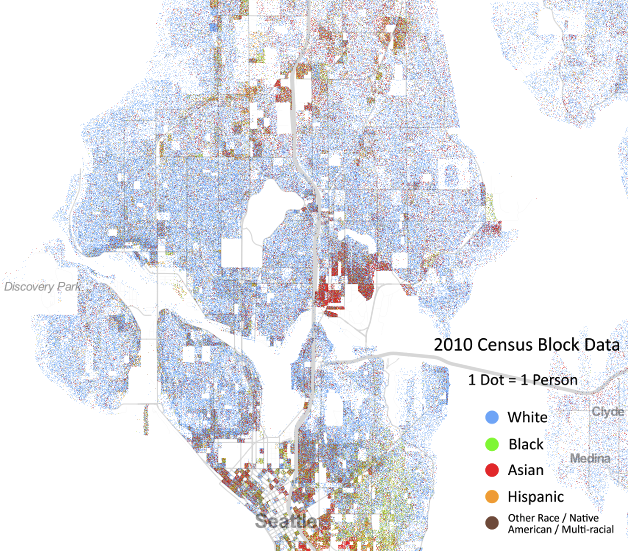
At this smaller scale there’s a lot more clumping by race, with black and Hispanic people living at the top and bottom of the map. Oh, and that odd-shaped spot in the middle? That’s the University of Washington, so those are university students.
(via Luis Apiolaza on Twitter)
The first week of the Currie Cup proved difficult to predict. I did note that last year was very difficult to predict as well.
Here are the team ratings prior to Round 2, along with the ratings at the start of the season. I have created a brief description of the method I use for predicting rugby games. Go to my Department home page to see this.
Here are the team ratings prior to this week’s games, along with the ratings at the start of the season.
| Current Rating | Rating at Season Start | Difference | |
|---|---|---|---|
| Blue Bulls | 11.05 | 0.87 | 10.20 |
| Griquas | 10.88 | -6.38 | 17.30 |
| Cheetahs | 5.97 | -3.10 | 9.10 |
| Western Province | -5.50 | 4.68 | -10.20 |
| Lions | -10.59 | -1.52 | -9.10 |
| Sharks | -13.96 | 3.30 | -17.30 |
So far there have been 3 matches played, 0 of which were correctly predicted, a success rate of 0%.
Here are the predictions for last week’s games.
| Game | Date | Score | Prediction | Correct | |
|---|---|---|---|---|---|
| 1 | Sharks vs. Griquas | Aug 09 | 30 – 32 | 17.20 | FALSE |
| 2 | Lions vs. Cheetahs | Aug 10 | 29 – 30 | 9.10 | FALSE |
| 3 | Western Province vs. Blue Bulls | Aug 10 | 24 – 24 | 11.30 | FALSE |
Here are the predictions for Round 2. The prediction is my estimated expected points difference with a positive margin being a win to the home team, and a negative margin a win to the away team.
| Game | Date | Winner | Prediction | |
|---|---|---|---|---|
| 1 | Sharks vs. Lions | Aug 16 | Sharks | 4.10 |
| 2 | Blue Bulls vs. Griquas | Aug 16 | Blue Bulls | 7.70 |
| 3 | Western Province vs. Cheetahs | Aug 17 | Cheetahs | -4.00 |
Today Stuff tells us that talcum powder, dogs, barbecues, fish oil, oral sex, and air travel cause cancer. The statistic on dogs is especially bizarre
Analysis of breast cancer cases by researchers at the University of Munich showed that 79.7 per cent of all breast cancer patients had regular contact with dogs before diagnosis. Only 4.4 per cent of the patients did not have pets at any time, compared to 57.3 per cent of a healthy control group. According to researchers, that’s a 29-fold increased risk for pet owners.
Given that the lifetime risk of breast cancer is roughly 10%, a 29-fold increase seems a bit improbable. That’s more than the increase in lung cancer risk caused by smoking, for example.
It’s interesting to track this one down. An obvious place to start is the “Kill or Cure?” website that collects Daily Mail stories about cancer. Back in 2007, the Mail reported what looks like the same story
Both dogs and humans carry the same virus that can induce cancer
Analysis of breast cancer cases by researchers at the University of Munich showed that patients with this type of cancer were significantly more likely to have kept a dog than a cat.
In fact, 79.7 per cent of all patients had intensive contact with dogs before they were diagnosed.
Only 4.4 per cent of the patients did not have pets at any time compared to 57.3 per cent of a healthy control group ? so there was a 29-fold increased risk for pet owners.
They didn’t link either, but the story looks like it comes from this publication (and if you can get to the full-text article you find that the numbers match).
The first thing to note is that the journal is Medical Hypotheses, notoriously “intended as a forum for unconventional ideas without the traditional filter of scientific peer review,
The second thing to note is the relative risk given in the abstract: 3.5, not 29. The number ’29’ does appear later in the paper, but even the authors aren’t prepared to defend it much.
The third thing to notice is what comparison was actually done
It became apparent that patients with breast carcinoma (N=69) owned significantly more often dogs but not cats compared to age matched female controls. We compared the frequencies of dog and pet ownership with data from public available statistics on women (N=1320) of the same age group in Bavaria.
That is, they asked a small number of patients with breast cancer about close contact with dogs, but used public statistics on pet ownership for the controls. Using different methods of obtaining information in cases and controls is a notorious way to come up with spurious results.
The theory was that dogs and humans shared a virus that caused breast cancer. There have been some reports of finding genetic material that looks like this virus in breast tumours, but other reports that did not, including an Australian research paper that looked very carefully.
Recent comments