August 7, 2013

NRL Predictions, Round 22

Team Ratings for Round 22

Here are the team ratings prior to Round 22, along with the ratings at the start of the season. I have created a brief description of the method I use for predicting rugby games. Go to my Department home page to see this.

Current Rating Rating at Season Start Difference
Roosters 14.34 -5.68 20.00
Sea Eagles 9.83 4.78 5.10
Storm 8.37 9.73 -1.40
Rabbitohs 7.50 5.23 2.30
Bulldogs 6.76 7.33 -0.60
Knights 3.68 0.44 3.20
Cowboys -0.22 7.05 -7.30
Sharks -0.62 -1.78 1.20
Warriors -1.24 -10.01 8.80
Broncos -3.26 -1.55 -1.70
Titans -3.35 -1.85 -1.50
Panthers -5.19 -6.58 1.40
Dragons -6.06 -0.33 -5.70
Raiders -6.96 2.03 -9.00
Wests Tigers -10.63 -3.71 -6.90
Eels -16.69 -8.82 -7.90


Performance So Far

So far there have been 152 matches played, 92 of which were correctly predicted, a success rate of 60.53%.

Here are the predictions for last week’s games.

Game Date Score Prediction Correct
1 Panthers vs. Roosters Aug 02 6 – 42 -9.79 TRUE
2 Knights vs. Broncos Aug 02 18 – 18 14.30 FALSE
3 Warriors vs. Sharks Aug 03 14 – 18 5.85 FALSE
4 Eels vs. Sea Eagles Aug 03 6 – 40 -19.03 TRUE
5 Cowboys vs. Rabbitohs Aug 03 30 – 12 -8.52 FALSE
6 Raiders vs. Storm Aug 04 4 – 68 2.46 FALSE
7 Titans vs. Wests Tigers Aug 04 36 – 6 7.22 TRUE
8 Dragons vs. Bulldogs Aug 05 20 – 39 -5.65 TRUE


Predictions for Round 22

Here are the predictions for Round 22. The prediction is my estimated expected points difference with a positive margin being a win to the home team, and a negative margin a win to the away team.

Game Date Winner Prediction
1 Storm vs. Rabbitohs Aug 09 Storm 5.40
2 Eels vs. Wests Tigers Aug 09 Wests Tigers -1.60
3 Roosters vs. Raiders Aug 10 Roosters 25.80
4 Sharks vs. Knights Aug 10 Sharks 0.20
5 Sea Eagles vs. Warriors Aug 11 Sea Eagles 15.60
6 Broncos vs. Dragons Aug 11 Broncos 7.30
7 Panthers vs. Cowboys Aug 11 Cowboys -0.50
8 Bulldogs vs. Titans Aug 12 Bulldogs 14.60


35% vs 300%

Stats Chat reader Elizabeth Paton-Simpson emailed us about what would have been a worthy Stat of the Week nomination. It’s from back in June, so isn’t eligible, but I wanted to share it with you:

Elizabeth wrote the following to the Sunday Star Times:

An item in the Sunday Star Times on 2 June was headlined: “Anaesthetics triple risk of dementia for elderly”. Likewise, the opening paragraph proclaimed: “Having a general anaesthetic may triple the risk of dementia in elderly patients, a study suggests.”

Trained to be sceptical of media claims, I read on and found reference only to a 35 percent increase. Checking the purported source revealed that the Sunday Star Times had altered the summary in The Times from “may increase … by a third” to “may triple”. So please tell Grandma she need not be alarmed – it’s just another example of journalistic innumeracy.

The Sunday Star Times responded:

Yes, you’re correct that the Times later corrected their article however we took their wire service copy which originally said “triple”. I’m sorry for any alarm this may have caused! And, of course, you are right that this should have been picked up in our subbing process.

Unfortunately, the statistic remains uncorrected elsewhere, such as The Australian.

Bogus poll on bogus shark documentary

Every year, the Discovery Channel has “Shark Week”, which is apparently their top-rated week of the year.  This year they led off with a programme about the extinct shark C. megalodon, which made the great white shark look like a guppy.

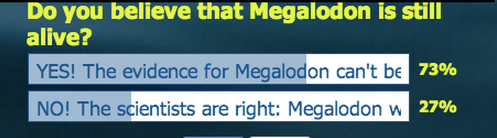
Unfortunately, they did a “Does Megalodon still exist?” programme.  The answer is, definitively, “No”, and to get any other answer you’d have to make up some evidence. That didn’t put them off.  Read Christie Wilcox (scientist) and Wil Wheaton (celebrity nerd) for more.

The excuse for putting this on StatsChat is below

bogusshark


I suppose it’s appropriate that they use a bogus poll to try to prove they fooled most of the people who trust them for science communication.

August 5, 2013

Stat of the Week Winner: July 27 – August 2 2013

Congratulations to Brendon Blue for his nomination of a the “10,000,000,000,000,000 times likely” statistic in last week’s Stat of the Week competition.

For a discussion on this, please refer to James Curran’s post: “10 quadrillion times more likely to have done it”.

Congratulations Brendon! Please add your nominations to this week’s competition.

Stat of the Week Competition: August 3 – 9 2013

Each week, we would like to invite readers of Stats Chat to submit nominations for our Stat of the Week competition and be in with the chance to win an iTunes voucher.

Here’s how it works:

  • Anyone may add a comment on this post to nominate their Stat of the Week candidate before midday Friday August 9 2013.
  • Statistics can be bad, exemplary or fascinating.
  • The statistic must be in the NZ media during the period of August 3 – 9 2013 inclusive.
  • Quote the statistic, when and where it was published and tell us why it should be our Stat of the Week.

Next Monday at midday we’ll announce the winner of this week’s Stat of the Week competition, and start a new one.

(more…)

August 2, 2013

A tax on hope?

An excellent long piece about lotteries, from the online magazine Nautilus.  There are many viewpoints presented, including one from the president of the Tennessee lottery corporation

Hargrove has an intuitive understanding of what drives her customers to play the game. She has a preternatural sense of where their psychological buttons are located and how to push them. She responded in a flash to my comment about the logical futility of playing the lottery. “If you made a logical investment choice, you’d play a different game,” she said, leaning forward for emphasis. “It’s not an investment. It’s entertainment. For a very small amount of money you might change your life. For $2 you can spend the day dreaming about what you would do with half a billion dollars—half a billion dollars!”

When  both payoffs and odds that are beyond any conceptual understanding you could do a simple expected-value calculation and label government lotteries as a tax on stupidity, but that framing assumes lottery players are calculating the expected payoff and just getting it wrong. Empirically, it seems to be more complicated than that.

Briefly

  • A good story in the Herald about a survey of health risk behaviour in NZ high-school students. Things are improving, as the story says. There’s even a link to the real research.  Pity about the headline.
  • Short free-access piece in the Listener on estimating and understanding risks of death.  There’s a longer cover story in the paid-access or squashed-tree versions, also by Mark Broatch.
  • The NZ Science Media Centre has a new edition of its Desktop Guide for Science Reporters. It’s also valuable for people reading science stories — especially those by journalists who haven’t read the guide.

The methods behind the statistics do matter

From the US 6th Circuit Court of Appeals (PDF), in a lawsuit alleging false advertising by a US law school, based on a low-quality survey of graduates

For example, the Employment Report for 2010 states that the “average starting salary for all graduates” was $54,796. On its face, the phrase “all graduates” means just that: all Cooley graduates—not just the ones who responded to the survey—made, on average, $54,796. One could assume that, because there were 934 graduates, the average starting salary for all 934 graduates was $54,796. The title of the document containing this statement is “Employment Report and Salary Survey.”  Therefore, it cannot be that the average starting salary of all 2010 graduates was $54,796, because the document, entitled “Employment Report and Salary Survey” (emphasis added) was not based on the responses of all of the Cooley graduates in 2010; rather, the document states that the number of 2010 graduates was 934, but the number of graduates with employment status known was 780. So, the “[a]verage starting salary for all graduates” would instead mean the average starting salary of graduates who responded to the survey and chose to include their salary information—not the average salary of all Cooley graduates in any given year.

We agree with the district court that this statistic is “objectively untrue,” but that the graduates’ reliance upon it was “also unreasonable,”  which dooms their fraudulent misrepresentation claim.

It’s not just statisticians who think you need to pay attention to where the numbers come from.

(via)

Facts are scared

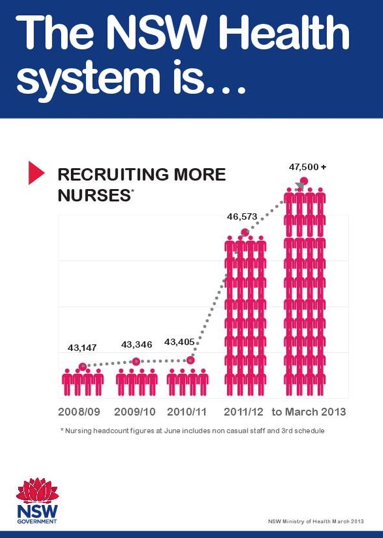
The Guardian blog section has the motto “Comment is free, but facts are sacred”.  Their Datablog is showing 16 examples of infographics that don’t exactly cast light on the facts, including

nurses

August 1, 2013

The machine that goes ‘ping’

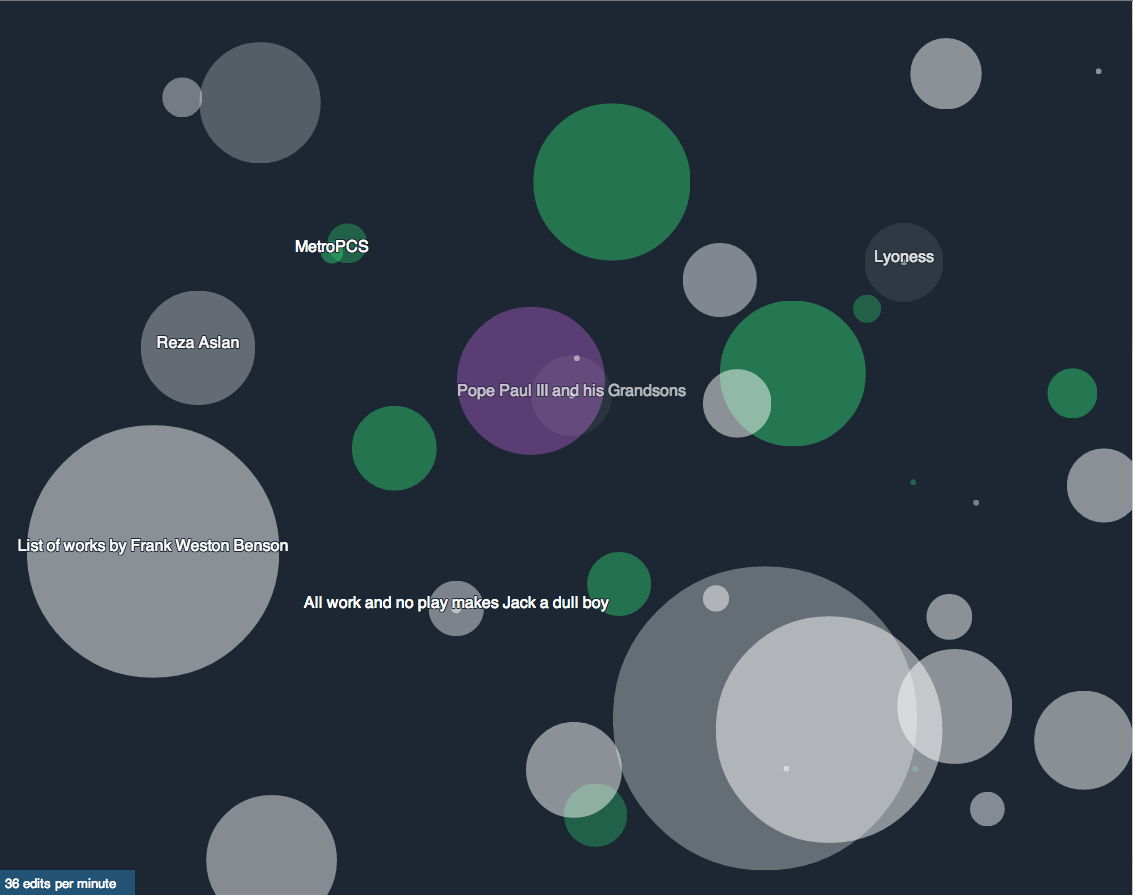
Listen to Wikipedia is an entrancingly pointless real-time display of edits to Wikipedia, with visual and audio, indicating additions and deletions, by registered or unregistered people or bots

ltw


(via @hildabast)