June 5, 2013

NRL Predictions, Round 13

Team Ratings for Round 13

Here are the team ratings prior to Round 13, along with the ratings at the start of the season. I have created a brief description of the method I use for predicting rugby games. Go to my Department home page to see this.

Current Rating Rating at Season Start Difference
Rabbitohs 9.55 5.23 4.30
Storm 7.39 9.73 -2.30
Roosters 6.08 -5.68 11.80
Sea Eagles 5.55 4.78 0.80
Panthers 2.25 -6.58 8.80
Knights 1.78 0.44 1.30
Sharks 1.05 -1.78 2.80
Raiders 0.43 2.03 -1.60
Titans 0.21 -1.85 2.10
Bulldogs 0.15 7.33 -7.20
Cowboys -0.71 7.05 -7.80
Dragons -3.15 -0.33 -2.80
Broncos -3.96 -1.55 -2.40
Warriors -4.71 -10.01 5.30
Wests Tigers -11.21 -3.71 -7.50
Eels -14.44 -8.82 -5.60


Performance So Far

So far there have been 92 matches played, 57 of which were correctly predicted, a success rate of 61.96%.

Here are the predictions for last week’s games.

Game Date Score Prediction Correct
1 Bulldogs vs. Dragons May 31 16 – 14 9.24 TRUE
2 Rabbitohs vs. Knights Jun 01 25 – 18 13.58 TRUE
3 Titans vs. Cowboys Jun 02 31 – 12 2.02 TRUE
4 Broncos vs. Warriors Jun 03 18 – 56 16.07 FALSE


Predictions for Round 13

Here are the predictions for Round 13. The prediction is my estimated expected points difference with a positive margin being a win to the home team, and a negative margin a win to the away team.

Game Date Winner Prediction
1 Eels vs. Roosters Jun 07 Roosters -16.00
2 Knights vs. Dragons Jun 08 Knights 9.40
3 Cowboys vs. Bulldogs Jun 08 Cowboys 3.60
4 Warriors vs. Sea Eagles Jun 09 Sea Eagles -5.80
5 Panthers vs. Wests Tigers Jun 09 Panthers 18.00
6 Storm vs. Sharks Jun 09 Storm 10.80
7 Raiders vs. Broncos Jun 10 Raiders 8.90


Super 15 Predictions, Round 17

Team Ratings for Round 17

This year the predictions have been slightly changed with the help of a student, Joshua Dale. The home ground advantage now is different when both teams are from the same country to when the teams are from different countries. The basic method is described on my Department home page.

Here are the team ratings prior to Round 17, along with the ratings at the start of the season.

Current Rating Rating at Season Start Difference
Crusaders 6.03 9.03 -3.00
Bulls 5.96 2.55 3.40
Chiefs 4.64 6.98 -2.30
Brumbies 3.54 -1.06 4.60
Sharks 2.26 4.57 -2.30
Stormers 1.11 3.34 -2.20
Waratahs 0.97 -4.10 5.10
Reds 0.17 0.46 -0.30
Hurricanes -1.55 4.40 -5.90
Blues -1.62 -3.02 1.40
Cheetahs -1.63 -4.16 2.50
Highlanders -5.35 -3.41 -1.90
Rebels -8.01 -10.64 2.60
Force -8.38 -9.73 1.40
Kings -12.93 -10.00 -2.90


Performance So Far

So far there have been 101 matches played, 68 of which were correctly predicted, a success rate of 67.3%.

Here are the predictions for last week’s games.

Game Date Score Prediction Correct
1 Crusaders vs. Waratahs May 31 23 – 22 10.60 TRUE
2 Brumbies vs. Hurricanes May 31 30 – 23 9.50 TRUE
3 Highlanders vs. Blues Jun 01 38 – 28 -3.40 FALSE
4 Reds vs. Rebels Jun 01 33 – 20 10.20 TRUE
5 Stormers vs. Kings Jun 01 19 – 11 18.20 TRUE
6 Cheetahs vs. Bulls Jun 01 25 – 30 -5.10 TRUE


Predictions for Round 17

Here are the predictions for Round 17. The prediction is my estimated expected points difference with a positive margin being a win to the home team, and a negative margin a win to the away team.

Game Date Winner Prediction
1 Brumbies vs. Rebels Jun 07 Brumbies 14.00
2 Force vs. Waratahs Jun 09 Waratahs -6.90


June 4, 2013

Survey respondents are lying, not ignorant

At least, that’s the conclusion of a new paper from the National Bureau of Economic Research.

It’s a common observation that some survey responses, if taken seriously, imply many partisans are dumber than a sack of hammers.  My favorite example is the 32% of respondents who said the Gulf of Mexico oil well explosion made them more likely to support off-shore oil drilling.

As Dylan Matthews writes in the Washington Post, though, the research suggests people do know better. Ordinarily they give the approved politically-correct answer for their party

In the control group, the authors find what Bartels, Nyhan and Reifler found: There are big partisan gaps in the accuracy of responses. …. For example, Republicans were likelier than Democrats to correctly state that U.S. casualties in Iraq fell from 2007 to 2008, and Democrats were likelier than Republicans to correctly state that unemployment and inflation rose under Bush’s presidency.

But in an experimental group where correct answers increased your chance of winning a prize, the accuracy improved markedly:

Take unemployment: Without any money involved, Democrats’ estimates of the change in unemployment under Bush were about 0.9 points higher than Republicans’ estimates. But when correct answers were rewarded, that gap shrank to 0.4 points. When correct answers and “don’t knows” were rewarded, it shrank to 0.2 points.

This is probably good news for journalism and for democracy.  It’s not such good news for statisticians.

Nonlinear time

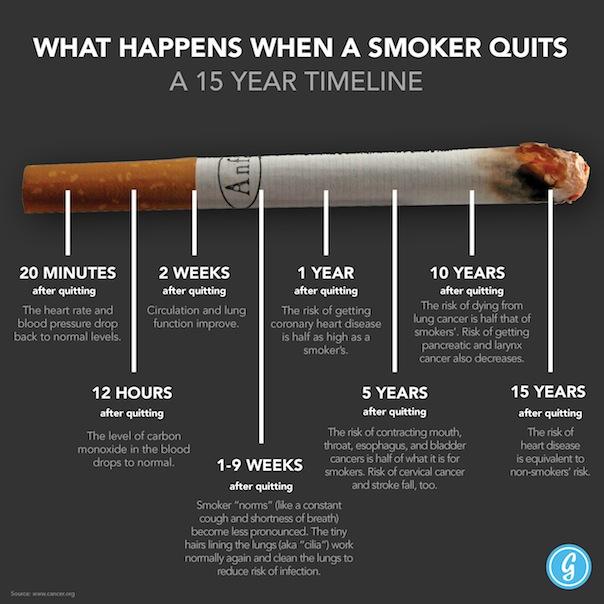
Allan Hansen sends in this infographic from Greatist, showing the benefits of quitting smoking

Smokers-Timeline-1

He points out the non-linear time scale — equally spaced intervals range from 20 minutes to five years.  It’s also a bit strange that time progresses in the opposite direction to the burning of the cigarette — perhaps it should have been flipped left to right.

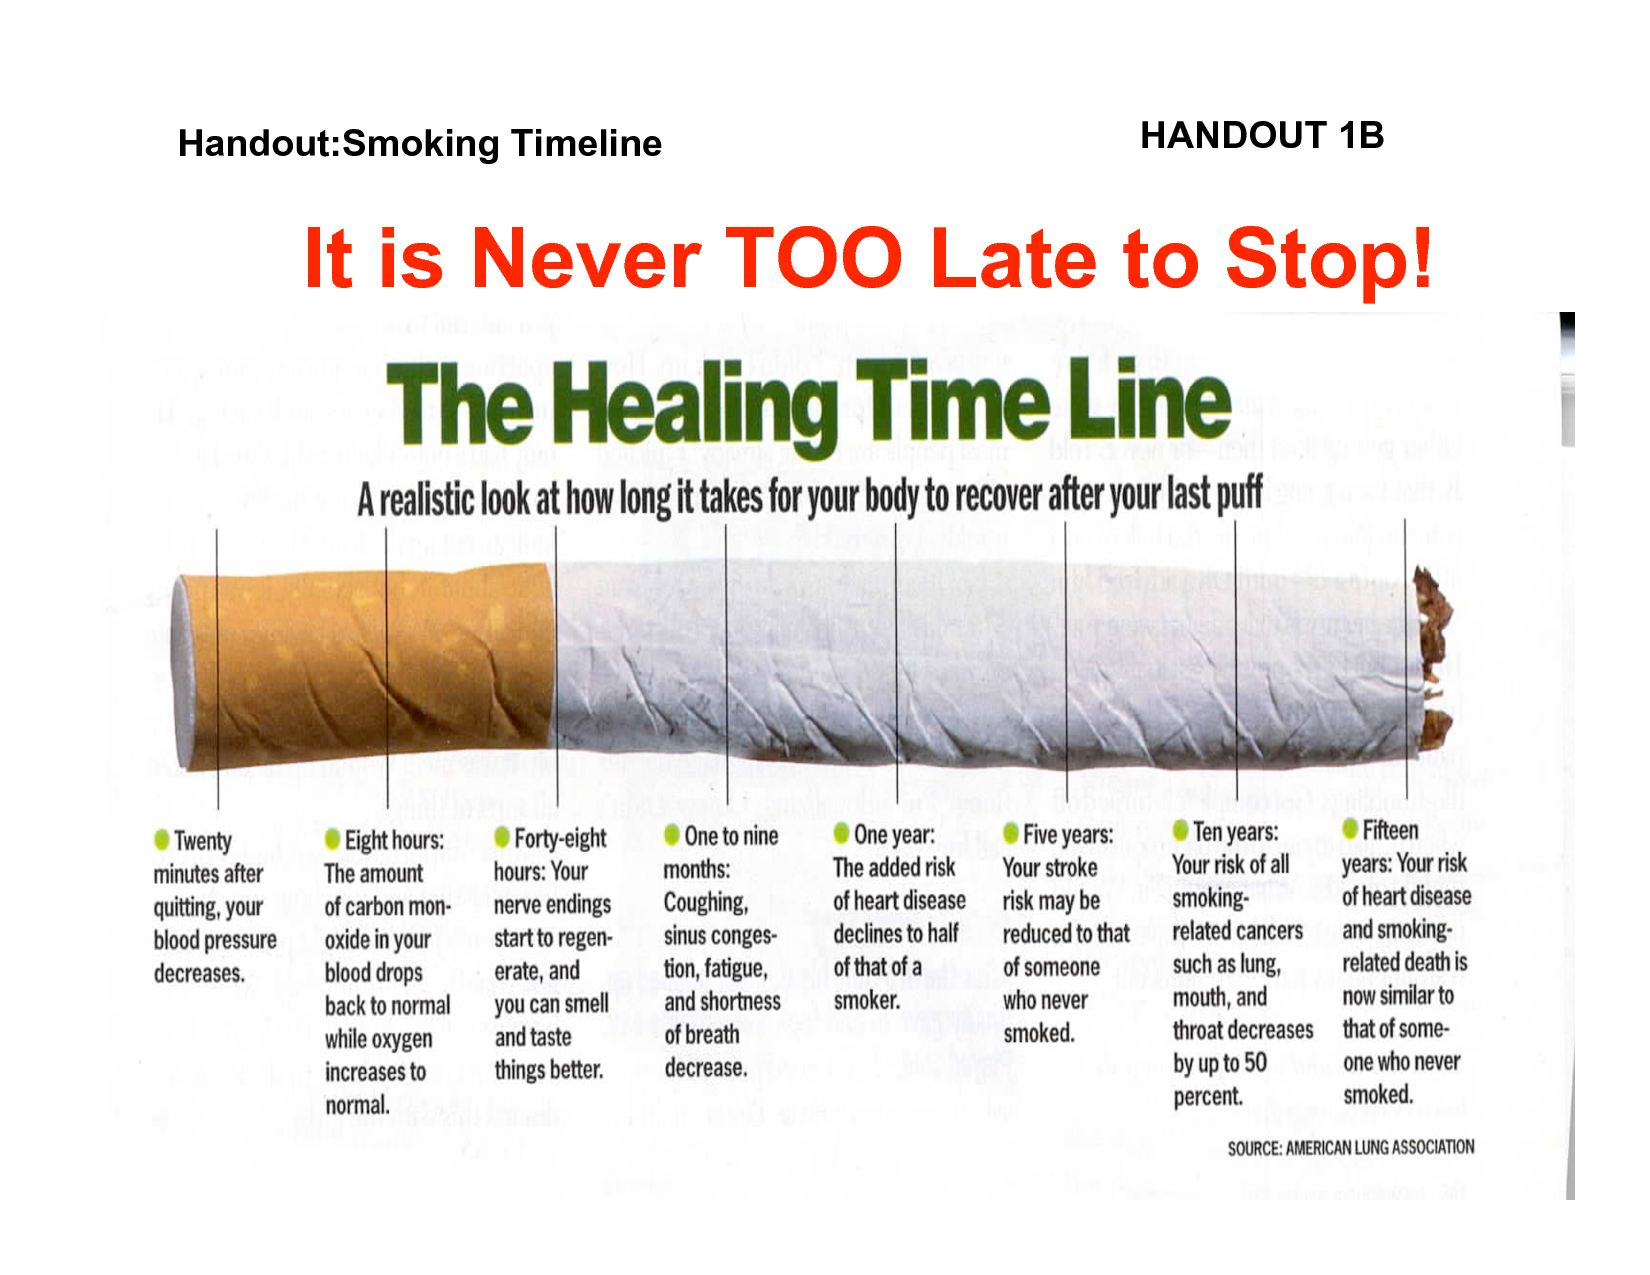
Other versions of this information are common, and they nearly all have the same nonlinear time scale

Smoking-timeline-2smoking_times-3smoking-timeline-4Smoke Timeline-5


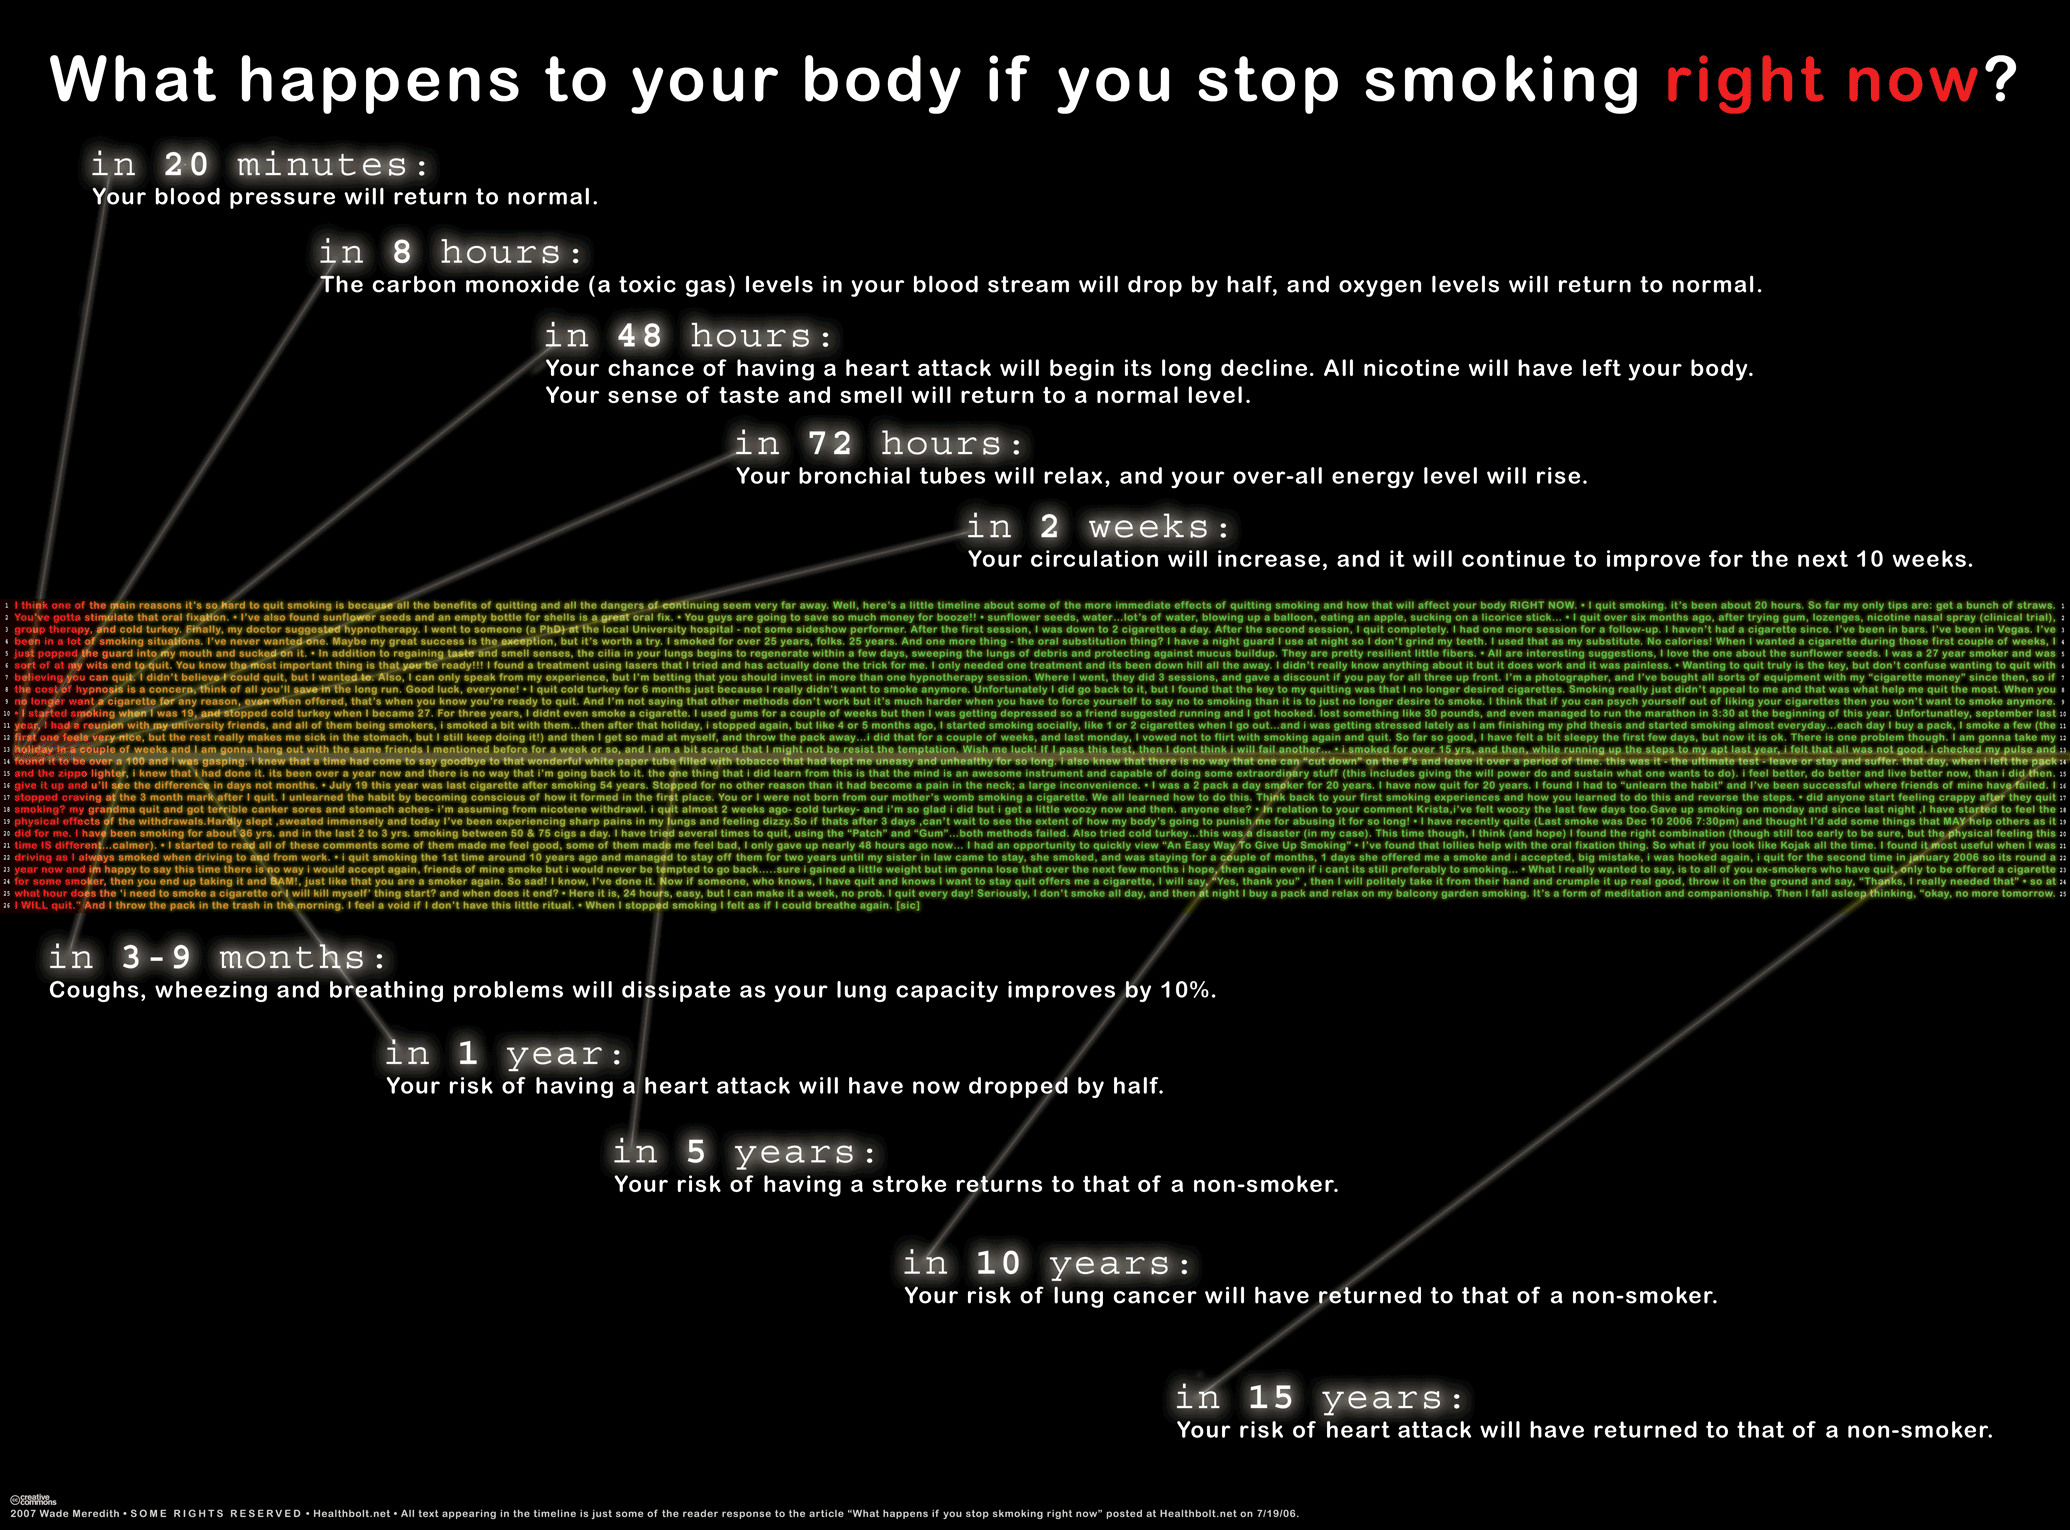
One notable exception is from Blisstree, where the evenly-spaced text is linked to accurately-scaled times by lines.  This graphic also avoids the direction-of-burning problem, using comments from former smokers as the background.

smoking_timeline_2070x1530

June 3, 2013

The research loophole

We keep going on here about the importance of publishing clinical trials.  Today (in Britain), the BBC program Panorama is showing a documentary about a doctor who has been running clinical trials of the same basic treatment regimen for twenty years, without publishing any results. And it’s not that these are trials that take a long time to run — the participants have advanced cancer. If the treatment was effective, it would have been easy to gather and publish convincing evidence by now, many times over.

These haven’t been especially good clinical trials by usual standards — not randomized, not controlled — and they have been anomalous in other ways as well. For example, patients participating in the trial are charged large sums of money for the treatment being tested (not just for other care), which is very unusual.  Unusual, but not illegal.  Without published evidence that the treatment works, it couldn’t be sold outside trials, but it’s still entirely legal to charge money for the treatment in research. It’s a bit like whaling.

According to the BBC, Dr Burzynski says it’s not his decision to keep the results secret

He said the medical authorities in the US would not let him release this information: “Clinical trials, phase two clinical trials, were completed just a few months ago. I cannot release this information to you at this moment.”

If true, that would be very unusual. I don’t know of any occasion when the FDA has restricted scientific publication of trial results, and it’s entirely routine to publish results for treatments that have not been approved or even where other research is still ongoing. The BBC also checked with the FDA:

But the FDA told us this was not true and he was allowed to share the results of his trials.

This is all a long way away from New Zealand, and we can’t even watch the documentary, so why am I mentioning it? Last year, the parents of an NZ kid were trying to raise money to send him to the Burzynski clinic, with the help of the Herald.   You can’t fault the parents for trying to buy hope at any cost, but you sure can fault the people selling it.

Wikipedia has pretty good coverage  if you want more detail.

Stat of the Week Competition: June 1 – 7 2013

Each week, we would like to invite readers of Stats Chat to submit nominations for our Stat of the Week competition and be in with the chance to win an iTunes voucher.

Here’s how it works:

  • Anyone may add a comment on this post to nominate their Stat of the Week candidate before midday Friday June 7 2013.
  • Statistics can be bad, exemplary or fascinating.
  • The statistic must be in the NZ media during the period of June 1 – 7 2013 inclusive.
  • Quote the statistic, when and where it was published and tell us why it should be our Stat of the Week.

Next Monday at midday we’ll announce the winner of this week’s Stat of the Week competition, and start a new one.

(more…)

June 2, 2013

Making data meaningful

A guide from the UN Economic Commission for Europe

  1. A guide to writing stories about numbers
  2. A guide to presenting statistics
  3. A guide to communicating with the media

And for local examples, check the @StatisticsNZ Twitter feed


[update: link fixed]

Submissions are for reading, not counting

The Herald, writing about Hamilton’s pending removal of fluoridation from their water supply

A Hamilton City Council tribunal examining the topic has re-ignited intense public debate on the issue, with 89 per cent of the 1,557 submissions made to it in favour of stopping fluoridation. In 2006, 70 per cent of residents who voted in a referendum backed fluoride.

This actually isn’t evidence or even a suggestion of a change in opinion. All we can tell from the numbers is that 1386 people now want fluoride removed.  Public submissions are useful qualitatively, not quantitatively.

It may be true that the people of Hamilton don’t want fluoride in their water, in which case I think they are unwise, but it’s their problem. Confusing self-selected numbers with referendum votes  isn’t going to help determine what they want, [and neither is the exclusion from voting of three of twelve council members on the grounds that they also sit on the DHB and so have thought about the issues before]

June 1, 2013

Statistical criticism with teeth

Andrew Dillnot has the dream job for a statistics blogger — he is responsible for telling British MPs and government departments that their misrepresentations of official statistics are naughty.  From a Guardian story

But the big number was – there is no other word for it – a lie. Dilnot, now responsible for protecting the integrity of official statistics, exposed it as a lie this week, albeit using mild Whitehall language in letters to Shapps and Iain Duncan Smith, the work and pensions secretary. The 878,300 alleged malingerers had never received incapacity benefit. They were new claimants, aggregated over three-and-a-half years. Many (probably most) withdrew their claim because they recovered from their condition or found a new job. In 2011-12, out of 603,600 established benefit claimants referred for the new medical tests, just 19,700 (3.3%) withdrew before taking them. That figure – which most of us would think small – represented the true scale of people pretending to be sick.


Information and its consequences, on BBC radio

From BBC Radio: listen online

On Start the Week Emily Maitlis talks to the Executive Chairman of Google, Eric Schmidt about the digital future. A future where everyone is connected, but ideas of privacy, security and community are transformed. Former Wikileaks employee James Ball asks how free we are online. The curator Honor Harger looks to art to understand this new world of technology. And worried about this brave new world? David Spiegelhalter, offers a guide to personal risk and the numbers behind it.

(via @cjbayesian)