May 19, 2013
Winners of a student datavis competition
From the University of San Francisco. The winners were all interactive maps, showing, respectively: pollution, population change, and child mortality.


From the University of San Francisco. The winners were all interactive maps, showing, respectively: pollution, population change, and child mortality.
Surprisingly addictive
From the Wellcome Trust Monitor, a survey examining knowledge and attitudes related to biomedical science in the UK
The survey found a high level of interest in medical research among the public – more than seven in ten adults (75 per cent) and nearly six out of ten of young people (58 per cent). Despite this, understanding of how research is conducted is not deep – and levels of understanding have fallen since 2009. While most adults (67 per cent) and half of all young people (50 per cent) recognise the concept of a controlled experiment in science, most cannot articulate why this process is effective.
Two-thirds of the adults that were questioned trusted medical practitioners and university scientists to give them accurate information about medical research. This fell to just over one in ten (12 per cent) for government departments and ministers. Journalists scored lowest on trustworthiness — only 8 per cent of adults trusted them to give accurate information about medical research, although this was an improvement on the 2009 figure of 4 per cent.
This is a common question from our students. Unfortunately our perspective does not always lend itself easily to life outside of research and academia, as what I look for in a curriculum vitae and in a job interview is usually with respect to hiring someone who will become an academic staff member. However, fellow statistician, and the Young Statisticians representative for the New Zealand Statistical Association executive committee, Kylie Maxwell has posted her own experience as part of the International Year of Statistics.
Keith Ng’s budget visualisation now has today’s newly-released Government budget.
(update) There’s also one at Stuff, by Harkanwal Singh (note that it uses nominal, not inflation-adjusted amounts)
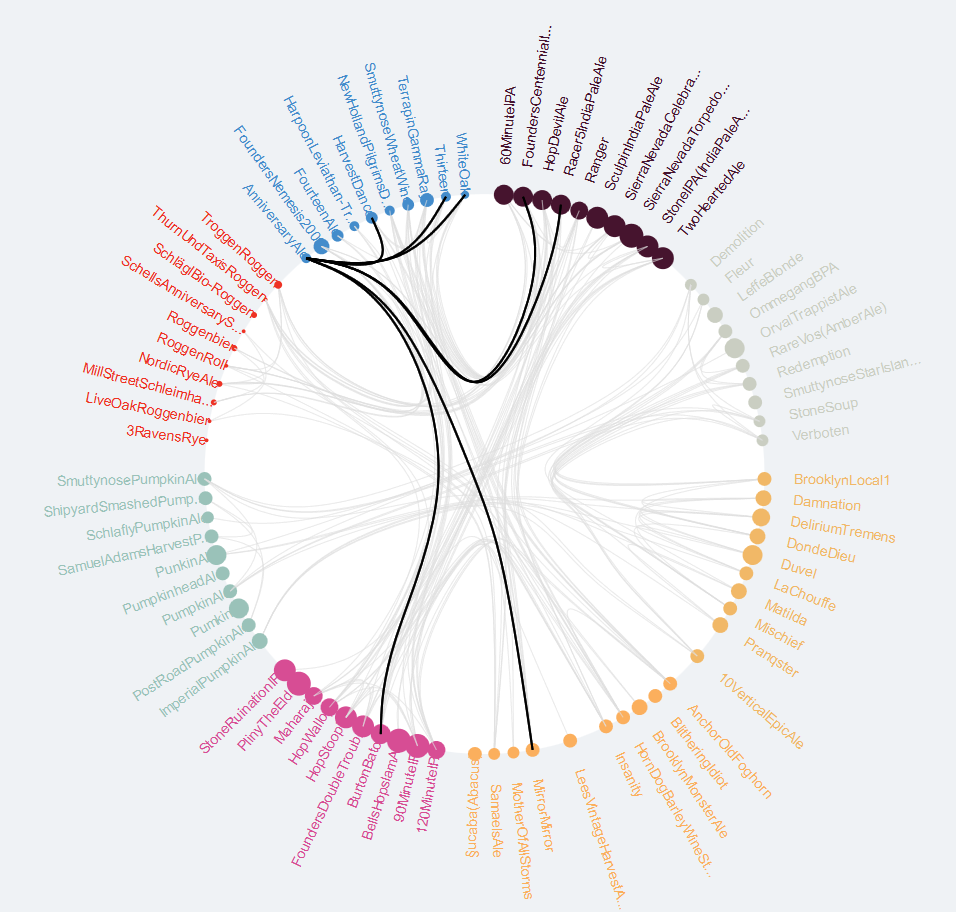
Here is a site to show with a flourish when your friends tell you at the pub that studying Statistics is no use. LifeHacker reports that BeerViz attempts to use historical data collected by BeerAdvocate, and presumably a statistical model, to suggest new beers to you based on what you already like. If they’re not using a statistical model then there is a great challenge for you loyal readers!
A report by research firm Strategy Analytics has estimated that Korean electronics giant Samsung took a whopping 94.7% share of the $US5.3 billion first quarter operating profits for Android handset sales. Whichever way you look at it, currently Samsung is the Android platform of choice.
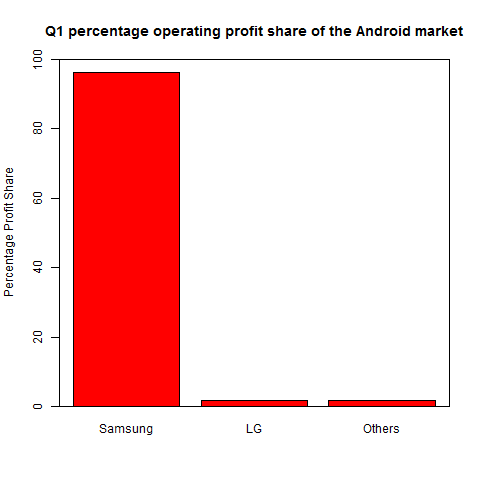
The Register notes that the same report notes that Android has 43% of the smartphone market share.

Rafa Irizarry at Simply Statistics has a longish piece on the future of applied statistics:
Despite having expertise only in music, and a thesis that required a CD player to hear the data, fitted models and residuals , I was hired by the Department of Biostatistics at Johns Hopkins School of Public Health. Later I realized what was probably obvious to the School’s leadership: that regardless of the subject matter of my thesis, my time series expertise could be applied to several public health applications. The public health and biomedical challenges surrounding me were simply too hard to resist and my new department knew this. It was inevitable that I would quickly turn into an applied Biostatistician.
It makes a nice change from the people worrying that computer science will beat us up and steal our lunch.
Here are the team ratings prior to Round 10, along with the ratings at the start of the season. I have created a brief description of the method I use for predicting rugby games. Go to my Department home page to see this.
| Current Rating | Rating at Season Start | Difference | |
|---|---|---|---|
| Rabbitohs | 9.03 | 5.23 | 3.80 |
| Roosters | 7.07 | -5.68 | 12.80 |
| Storm | 6.55 | 9.73 | -3.20 |
| Sea Eagles | 5.44 | 4.78 | 0.70 |
| Bulldogs | 4.07 | 7.33 | -3.30 |
| Cowboys | 2.61 | 7.05 | -4.40 |
| Raiders | 0.63 | 2.03 | -1.40 |
| Broncos | 0.45 | -1.55 | 2.00 |
| Knights | 0.01 | 0.44 | -0.40 |
| Sharks | -0.44 | -1.78 | 1.30 |
| Dragons | -2.51 | -0.33 | -2.20 |
| Titans | -3.42 | -1.85 | -1.60 |
| Panthers | -4.73 | -6.58 | 1.80 |
| Warriors | -8.16 | -10.01 | 1.90 |
| Eels | -9.94 | -8.82 | -1.10 |
| Wests Tigers | -10.41 | -3.71 | -6.70 |
So far there have been 72 matches played, 45 of which were correctly predicted, a success rate of 62.5%.
Here are the predictions for last week’s games.
| Game | Date | Score | Prediction | Correct | |
|---|---|---|---|---|---|
| 1 | Rabbitohs vs. Cowboys | May 10 | 28 – 10 | 9.15 | TRUE |
| 2 | Wests Tigers vs. Sharks | May 10 | 6 – 30 | -0.84 | TRUE |
| 3 | Warriors vs. Bulldogs | May 11 | 16 – 24 | -7.65 | TRUE |
| 4 | Eels vs. Broncos | May 11 | 19 – 18 | -7.61 | FALSE |
| 5 | Raiders vs. Knights | May 12 | 44 – 14 | -1.10 | FALSE |
| 6 | Titans vs. Dragons | May 12 | 15 – 14 | 4.24 | TRUE |
| 7 | Panthers vs. Storm | May 12 | 12 – 10 | -8.98 | FALSE |
| 8 | Sea Eagles vs. Roosters | May 13 | 4 – 16 | 6.58 | FALSE |
Here are the predictions for Round 10. The prediction is my estimated expected points difference with a positive margin being a win to the home team, and a negative margin a win to the away team.
| Game | Date | Winner | Prediction | |
|---|---|---|---|---|
| 1 | Broncos vs. Titans | May 17 | Broncos | 8.40 |
| 2 | Rabbitohs vs. Wests Tigers | May 17 | Rabbitohs | 23.90 |
| 3 | Dragons vs. Eels | May 18 | Dragons | 11.90 |
| 4 | Panthers vs. Warriors | May 18 | Panthers | 7.90 |
| 5 | Cowboys vs. Roosters | May 18 | Cowboys | 0.00 |
| 6 | Sharks vs. Raiders | May 19 | Sharks | 3.40 |
| 7 | Knights vs. Bulldogs | May 19 | Knights | 0.40 |
| 8 | Storm vs. Sea Eagles | May 20 | Storm | 5.60 |
Recent comments