March 3, 2013

Shooting yourself in the foot

The US has just imposed a set of spending cuts that was deliberately designed to be so stupid and destructive that even getting the wrong side of a compromise would be more attractive to both parties.

Among the major victims are scientists and their technical staff. Here’s some of what they have written about it

[update: the #sciquestertips tag on Twitter has black humour about the situation]

Statistics and journalists

The (US) National Institute for Computer-Assisted Reporting is having its annual conference.  This is a project of Investigative Reporters & Editors, whose statistics interventions for journalists range from a set of statistical tipsheets to having Hadley Wickham teach R to the nerdier ones. Unfortunately, it’s harder to fund this sort of thing in a small country.

Liz Lucas, one of the participants in a recent ‘statistics boot camp’ wrote about why journalists should learn statistics

When confronted with this statistical reality, what did the state officials say? In effect, “leave the statistical analysis to the government, OK?”

Now, if that doesn’t make you want to run for the nearest copy of “Statistics for Dummies”, I don’t know what will.


Homeopathy: there’s nothing to it

From yesterday’s Herald:

Government agencies are assessing the legality of a diet that promises people they will lose up to half a kilogram a day by using a homeopathic fertility hormone banned in the United States.

The diet, which is gaining popularity in New Zealand, involves taking a substance known as hCG and restricting food to 500 calories a day for up to 40 days.

If it’s homeopathic, it doesn’t involve taking hCG. That’s kind of the point of homeopathy.  Either way, if the diet involves losing half a kilogram a day, that’s water, not fat.  Losing half a kilogram of fat means cutting cumulative energy intake by 4500 Calories, and you’re not doing that in a day.

If it’s homeopathic, then the product itself is presumably safe, but the diet probably isn’t, and the quoted statements by the distributor seem to pretty clearly violate NZ Advertising Standards, as does the web site.

Update: if the drops are homeopathic, they won’t be doing anything, but would real hCG help with weight loss?  The place to look for evidence is the Cochrane Library (which is free-access in NZ). There is a systematic review of 14 randomised trials of hCG.  In summary

Twelve of the RCTs reported that weight‐loss with the use of hCG was no greater than with the use of a placebo or with the use of diet alone.

All of the 8 trials reporting fat distribution as an outcome had negative results.

Ten trials reported on hunger and 8 on a feeling of well‐being, only one trial in each case having a positive result.

So, this is a homeopathic version of a treatment that has been demonstrated ineffective, coupled with a dangerous diet.

The data speak for themselves

Today, from the Herald “More people on benefits as Govt fiddles with job requirements”

Labour spokeswoman for social development Jacinda Ardern said the highest unemployment numbers were at around 10 per cent in the early 1990s but support for solo parents and invalids have hit record highs during Bennett’s reign as Social Development Minister.

Between January 2009 and January 2012, the number of people on the DPB rose by 13.2 per cent. During the same period, the number of people on the unemployment benefit rose by 82 per cent.

Late January, in the Fairfax papers, “Beneficiary numbers in overall down trend”

Staff at Work and Income work hard to identify job opportunities with local employers and connect them with people who’re ready to work,” Mrs Bennett said.

On average Winz put 1000 people into new jobs each week around the country.

In the year to October 2012, 82,000 New Zealanders went off benefits and into work.

Ministry of Social Development website figures show the number of people on the unemployment benefit last month was the lowest December figure since 2008.

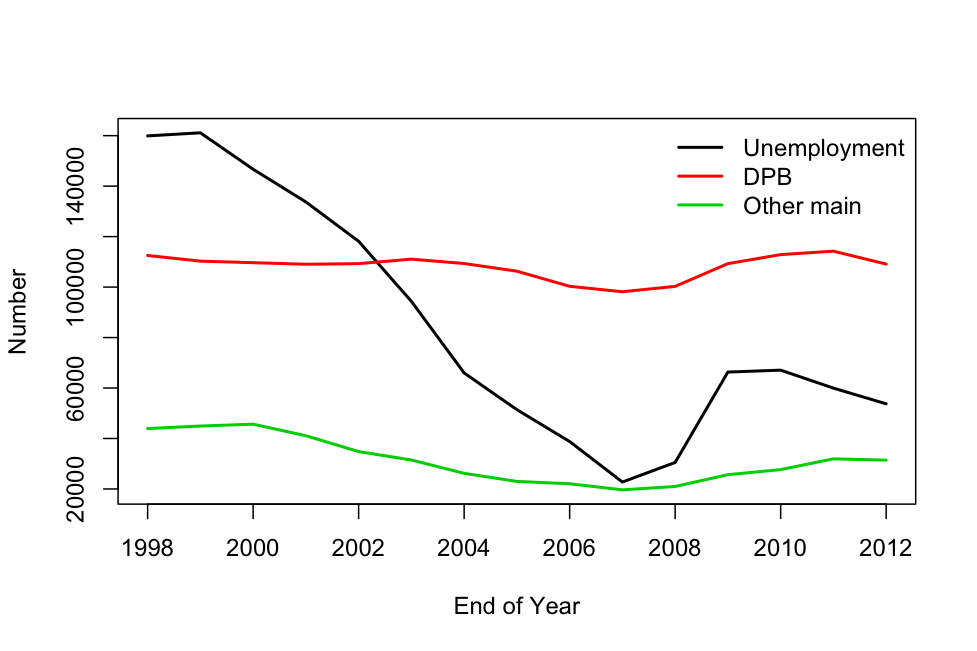
Since the actual numbers are a matter of public record, presumably both Adern and Bennett are telling the literal truth, but both of them are being misleading. To start with, you’d have to be suspicious about a trend that’s being quoted up to Jan 2012, which was more than a year ago.

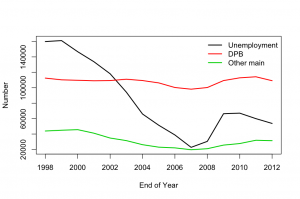
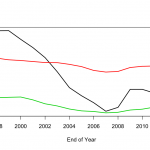
If you at the actual numbers, from the Ministry of Social Development (and work around the fact that they are in a Word document, not some sensible data format), it becomes clear that there are two patterns.  For unemployment, Dependent Persons Domestic Purposes, and “Other main” benefits, the main variation is with the state of the economy (strongly, for unemployment, more weakly for the other two).  It’s not really possible to tell if the recent changes have had any effect, but it is clear that anyone quoting a difference between two points as if it was evidence is not to be trusted.
benefits1


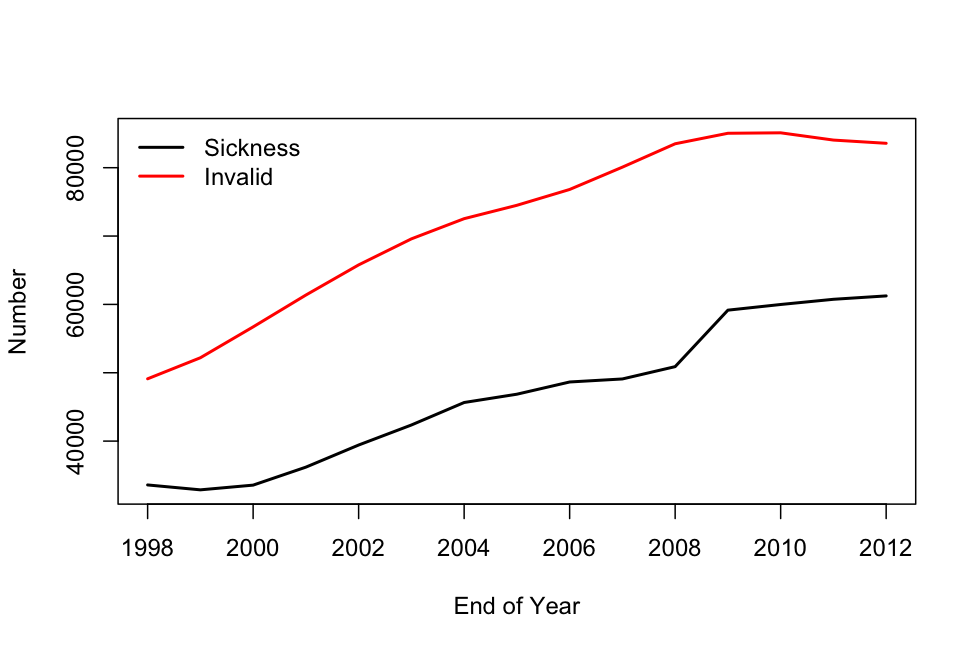
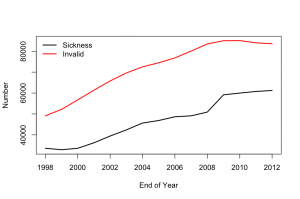
Sickness benefit and Invalid’s benefit have been rising, for as long as I can find the numbers, though the rise has flattened off in recent years.  This could possibly be evidence for the effectiveness of Bennett’s changes; it really can’t be evidence against them.
benefits2


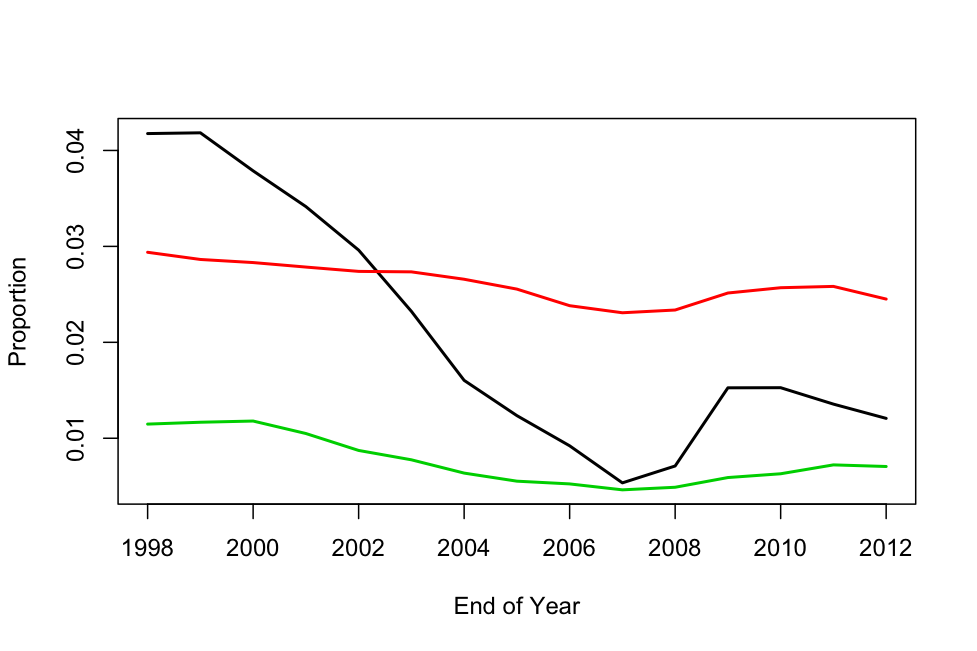
Ideally these should have been standardised by population, which increased about 25% over this period, but it doesn’t make much difference, as you can see.  Age adjustment would also be useful, but is a lot more work.
benefits3  benefits4

March 1, 2013

It’s all happening…

Next Tuesday, March 5, is Nerdnite Auckland again, at Nectar, above the Kingslander pub on New North Rd

  • Tim McNamara, who coordinates digital volunteer response in emergencies talking about privacy. “Privacy: It’s worse than you think”.
  • Biomedical engineer Michelle Dickinson, on nanotechnology
  • Richard Easther, a cosmologist from the physics department at Auckland University will be giving us a biographical talk about Beatrice Tinsley

and when you get home, you can fill out your Census form.

February 28, 2013

NRL Predictions, Round 1

Team Ratings for Round 1

Here are the team ratings prior to Round 1, along with the ratings at the start of the season. I have created a brief description of the method I use for predicting rugby games. Go to my Department home page to see this.

Current Rating Rating at Season Start Difference
Storm 9.73 9.73 0.00
Bulldogs 7.33 7.33 0.00
Cowboys 7.05 7.05 0.00
Rabbitohs 5.23 5.23 -0.00
Sea Eagles 4.78 4.78 0.00
Raiders 2.03 2.03 0.00
Knights 0.44 0.44 0.00
Dragons -0.33 -0.33 -0.00
Broncos -1.55 -1.55 0.00
Sharks -1.78 -1.78 0.00
Titans -1.85 -1.85 0.00
Wests Tigers -3.71 -3.71 -0.00
Roosters -5.68 -5.68 0.00
Panthers -6.58 -6.58 -0.00
Eels -8.82 -8.82 0.00
Warriors -10.01 -10.01 0.00


Predictions for Round 1

Here are the predictions for Round 1

Game Date Winner Prediction
1 Roosters vs. Rabbitohs Mar 07 Rabbitohs -6.40
2 Broncos vs. Sea Eagles Mar 08 Sea Eagles -1.80
3 Eels vs. Warriors Mar 09 Eels 5.70
4 Bulldogs vs. Cowboys Mar 09 Bulldogs 4.80
5 Panthers vs. Raiders Mar 10 Raiders -4.10
6 Storm vs. Dragons Mar 10 Storm 14.60
7 Sharks vs. Titans Mar 10 Sharks 4.60
8 Knights vs. Wests Tigers Mar 11 Knights 8.60


Unclear on the concept

The whole point of the Alltrials.net campaign is to prevent selective publication of clinical trial results.  The problem is that drug companies (and everyone else) publish only about half of their trials and are more likely to publish results if they are positive, distorting the available evidence. The only fix is not to let them be selective.

Roche has responded to the campaign by saying it will set up a panel to approve requests for access to anonymised patient data.  That’s nice, and it will be helpful for certain types of research, but it completely misses the point of the AllTrials campaign.

As Tracey Brown, of the British organisation Sense about Science, comments: “Which bit of All and Trials do they not understand?”

February 27, 2013

Super 15 Predictions, Round 3

Team Ratings for Round 3

This year the predictions have been slightly changed with the help of a student, Joshua Dale. The home ground advantage now is different when both teams are from the same country to when the teams are from different countries. The basic method is described on my Department home page.

Here are the team ratings prior to Round 3, along with the ratings at the start of the season.

Current Rating Rating at Season Start Difference
Crusaders 9.03 9.03 0.00
Chiefs 7.47 6.98 0.50
Sharks 4.63 4.57 0.10
Bulls 3.05 2.55 0.50
Stormers 2.83 3.34 -0.50
Hurricanes 2.49 4.40 -1.90
Brumbies 1.02 -1.06 2.10
Reds -0.72 0.46 -1.20
Blues -1.11 -3.02 1.90
Highlanders -3.90 -3.41 -0.50
Cheetahs -4.22 -4.16 -0.10
Waratahs -4.29 -4.10 -0.20
Kings -9.37 -10.00 0.60
Force -10.79 -9.73 -1.10
Rebels -10.93 -10.64 -0.30


Performance So Far

So far there have been 9 matches played, 8 of which were correctly predicted, a success rate of 88.9%.

Here are the predictions for last week’s games.

Game Date Score Prediction Correct
1 Highlanders vs. Chiefs Feb 22 27 – 41 -7.90 TRUE
2 Rebels vs. Brumbies Feb 22 13 – 30 -8.00 TRUE
3 Bulls vs. Stormers Feb 22 25 – 17 1.70 TRUE
4 Hurricanes vs. Blues Feb 23 20 – 34 9.90 FALSE
5 Reds vs. Waratahs Feb 23 25 – 17 5.70 TRUE
6 Cheetahs vs. Sharks Feb 23 22 – 29 -6.20 TRUE
7 Kings vs. Force Feb 23 22 – 10 4.20 TRUE


Predictions for Round 3

Here are the predictions for Round 3. The prediction is my estimated expected points difference with a positive margin being a win to the home team, and a negative margin a win to the away team.

Game Date Winner Prediction
1 Blues vs. Crusaders Mar 01 Crusaders -7.60
2 Waratahs vs. Rebels Mar 01 Waratahs 9.10
3 Reds vs. Hurricanes Mar 01 Reds 0.80
4 Chiefs vs. Cheetahs Mar 02 Chiefs 15.70
5 Bulls vs. Force Mar 02 Bulls 17.80
6 Sharks vs. Stormers Mar 02 Sharks 4.30


A school-based randomised trial

From the Herald (taken from the Daily Mail)

Volunteering is good for the heart as well as the soul, researchers say.

In fact, the research didn’t examine either the soul or the heart, but they did look at weight, cholesterol, and biochemical measurements related to inflammation.

The study, published in the journal JAMA Pediatrics, tested 106 teenagers from Vancouver. Those involved in altruistic activities had lower levels of cholesterol and inflammation.

The paper is here, and even if you can only see the abstract, you can see the story missed an important issue. This was actually a randomised trial:

Intervention  Weekly volunteering with elementary school–aged children for 2 months vs wait-list control group.

That is, the researchers took all the students from a high school in western Canada (presumably Vancouver, though it doesn’t say).  These students are required to do some volunteer work as part of the standard curriculum, and they were randomised to do it in first or second semester.

The article doesn’t address the possibility that the volunteering might have involved an increase in exercise: even just at the level of standing up and moving around vs sitting in front of a screen.  Also, as the researchers admit, this is a very small study, intended as a pilot for larger-scale research, and they may just have been lucky.  It’s still interesting to see the reductions in cholesterol and biochemical markers of inflammation.

February 26, 2013

Compared to what?

The Auckland Transport Blog presents a dramatically bad example of organising and displaying what would otherwise be quite useful information

ITP-Destination-Demand


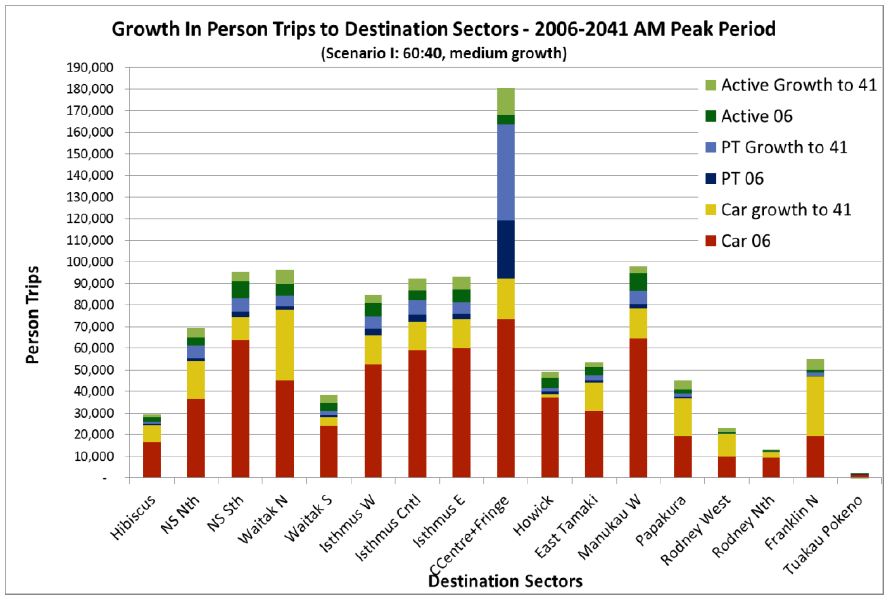
The legend indicates that the graph is trying to show three pairs of now vs future comparisons: car trips, public transport trips, and whatever ‘Active’ means (?walking and cycling, perhaps), and geographical variation.

Unfortunately, the stacking means that the easiest comparison is current car trips (red bars) vs all future trips (total bar length).   For example, in the City Centre and Fringe bar, the large projected growth in public transport is mixed up visually with the relatively large current public transport use.  The geographical variation would probably be clearer if the bars were sorted by current volume  rather than north to south, since then you would be able to see projected differences between currently similar areas.

As a relatively minor problem, the colour scheme also highlights growth in car trips more than it really deserves.