February 26, 2013

That’s not how polling works

I was struck by the Herald headline this morning “Gay marriage fans on top in objector’s poll”, which goes on to say

The Family First lobby group has published a poll which finally concedes what all other polls in the past year have shown – that more New Zealanders now support gay marriage than oppose it.

The poll of 1000 people by blogger David Farrar’s Curia Research has found 47 per cent think same-sex couples should be allowed to marry, against 43 per cent who think “civil unions are sufficient for same-sex couples”.

“Objector’s”, in the singular, would appear to refer to David Farrar, but as you would expect from the rest of his political beliefs, he’s firmly on the record as supporting marriage equality.  Assuming the apostrophe belongs after the “s”, meaning Family First, it still shouldn’t be relevant to the sampling that the poll was funded by them, though it might be surprising that they published the results (Curia also published the full results; I don’t know if they needed Family First’s permission to do so).

The level of support is still a bit lower than in some other polls. I’d guess that’s because of the phrasing of the question,

In 2004, Parliament legislated to allow same sex couples to register a civil union, amending over 150 pieces of legislation to give legal rights and recognition to same-sex couples. Do you think Parliament should change the definition of marriage to allow same-sex couples to marry, or do you think civil unions are sufficient for same sex couples?

compared to the Colmar Brunton question

Question: In New Zealand same-sex couples can enter into a Civil Union, but they are not able to get married. Do you think same-sex couples should be able to get married?
 

February 25, 2013

Infographics: so 1980s Soviet

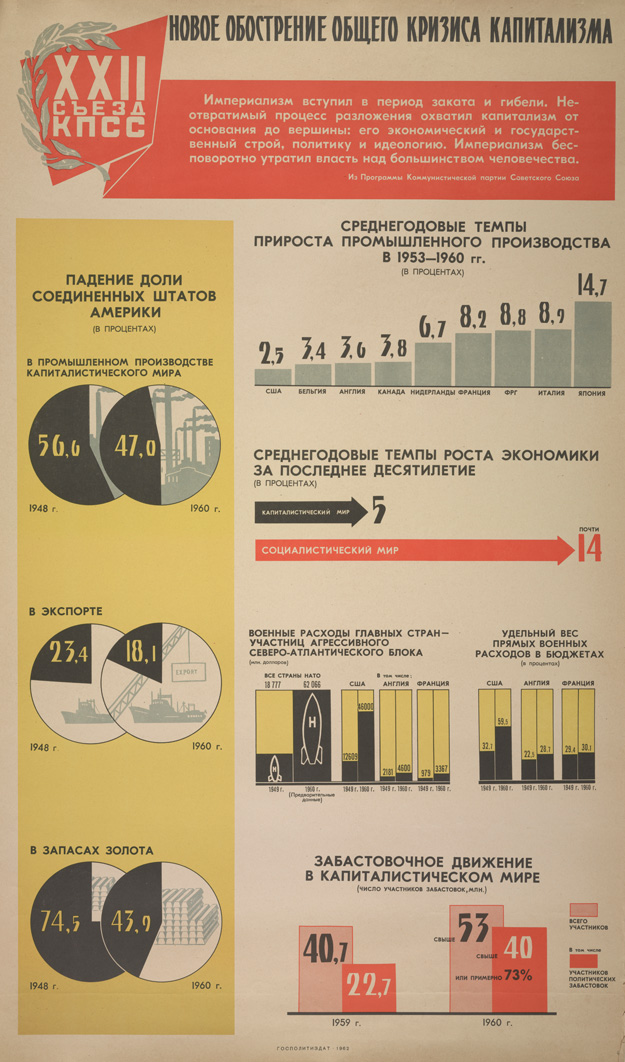
Based on a tweet from Luis Apiolaza (@zentree), I found a bunch of genuine Soviet-era Pravda infographics (the rest of the site is good, too).


These are actually better than a lot of the modern crop.  They certainly handle piecharts better than the Herald-Sun.

Probably most of the numbers are made up, but it’s not as if the numbers on modern infographics are all that good.

Economic data mining needs theory

Via the new Observational Epidemiology blog, it is possible to talk about stochastic complexity in reasonably plain English


But that’s not the worst part

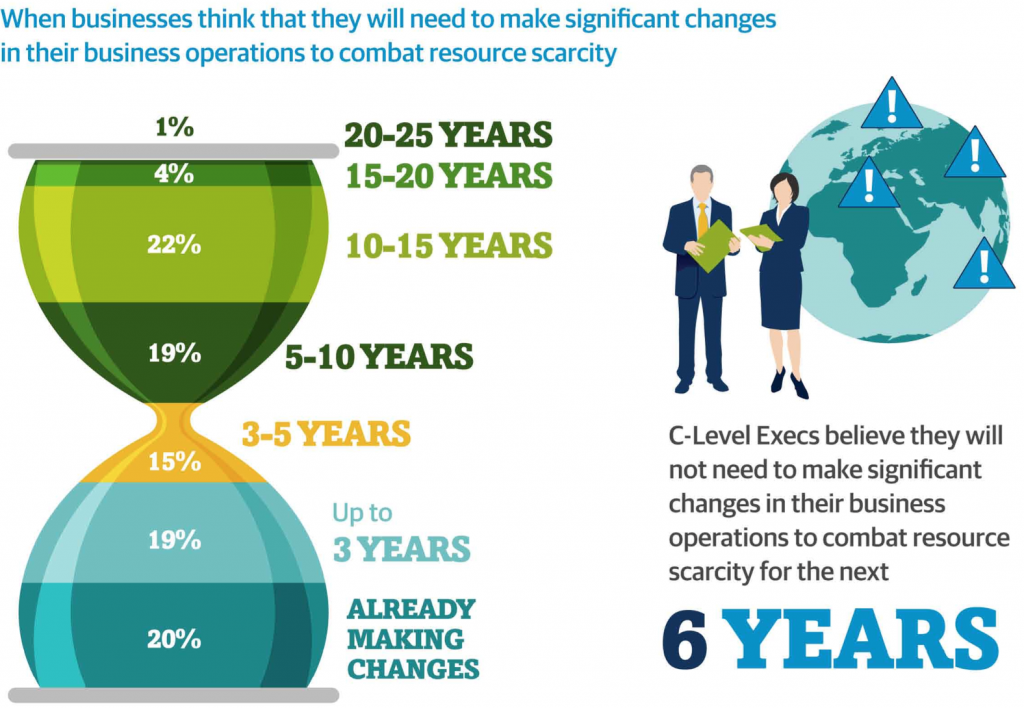
Andrew Gelman passes on this infographic from the Carbon Trust

hourglass


His correspondent points out that the colour scheme is awful, and that the hourglass metaphor would only make sense if the ‘pinch point’ in the hourglass was ‘now’, not 3-5 years in the future.

But that’s not the worst part: Andrew points out that the teeny orange area is actually highest rate per year over the whole time period, a fact that’s masked by the design.

But that’s not the worst part.  The data in the graph come from telephone interviews with some unspecified set of senior executives (CEO, CIO, CTO, COO, etc) selected in an unspecified way with an unspecified response rate, from companies of varying but unspecified size in varying but unspecified industries, so it isn’t really as if the numbers mean much anyway.

Where to cut?

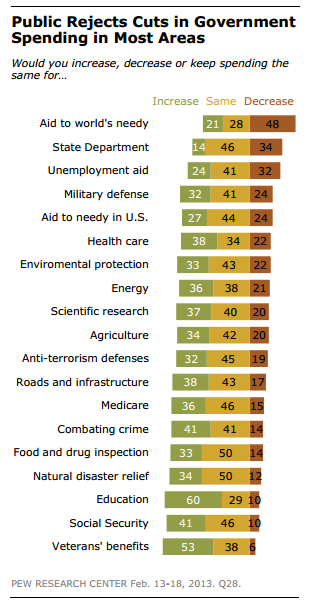
A US survey (see Wonkblog coverage) asked respondents about cutting government spending both overall, and in 19 specific areas.  Most people were in favour of overall cuts, but none of the 19 areas got a majority in favour of decreased funding (click to embiggen, as usual)

a good graph for a change


Even among self-identified Republicans, only two areas had majority support for cuts: unemployment benefits and foreign aid, which make up less than 3.5% of the federal budget.

The graph is pretty good, but some indication of the relative size of these areas (perhaps by the thickness of the bars) might improve it.

February 23, 2013

Buy low, sell high?

From the Herald

Expectations of house price inflation continue to climb in ASB’s latest quarterly survey and are close to their all-time high 10 years ago.

The same seller’s market is reflected in a drop in the net balance of people who consider it a good time to buy a house

That doesn’t make sense to me.  If people expect house prices to keep rising, ie, that houses now are cheaper than in the future, they should want to buy.  Is the market confused, or is it the Herald (or, of course, me)?

When in doubt, randomise.

There has been (justified) wailing and gnashing of teeth over recent year-9 maths comparisons, and the Herald reports that a `back to basics’ system is being considered

Auckland educator Des Rainey, who did the research with teachers to test his home-made Kiwi Maths memorisation system, said the results came as a shock to the teachers and made him doubt his programme could work.

But after a year of practising multiplication and division on the Kiwi Maths grids for up to 10 minutes a day, the students more than doubled their speed.

This program looks promising, but why is anyone even talking about implementing a major nationwide intervention based on a small, uncontrolled before/after comparison measuring a surrogate outcome?

That is, unless you believe teachers and schoolchildren are much less individually variable than, say, pneumococci, you would want a randomised controlled comparison, and since presumably Des Rainey would agree that speed of basic arithmetic is important primarily because it’s a foundation for actual numeracy, you’d want to measure the success of the program based on numeracy tasks rather than on arithmetic speed. The results being reported are what the medical research community would call a non-randomised Phase IIa efficacy trial — an important stepping stone, but not a basis for policy.

Of course, that’s not how education works, is it?

February 22, 2013

Drug safety is hard

There are new reports, according to the Herald, that synthetic cannabinoids are ‘associated’ with suicidal tendencies in long-term users.  One difficulty in evaluating this sort of data is the huge peak in suicide rates in young men.  Almost anything you can think of that might be a bad idea is more commonly done by young men than by other people, so an apparent association isn’t all that surprising.  There is also the problem with direction of causation — the sorts of problems that make suicide a risk might also increase drug use — and difficulties even in getting a reasonable estimate of the denominator, the number of people using the drug. Serious, rare effects of a recreational drug are the hardest to be sure about, and the same is true of prescription medications.  It took big randomized trials to find out that Vioxx more than doubled your rate of heart attack , and a study of 1500 lung-cancer cases even to find the 20-fold increase in risk from smoking.

In this particular example there is additional supporting evidence. A few years back there was a lot of research into anti-cannabinoid drugs for weight loss (anti-munchies), and one of the things that sank these was an increase in suicidal thoughts in the patients in the early randomized trials.  It’s quite plausible that the same effect would happen as a dose of the cannabinoid wears off.

In general, though, this is the sort of effect that the proposed testing scheme for psychoactive drugs will have difficulty finding, or ruling out.

February 21, 2013

Super 15 Predictions, Round 2

Team Ratings for Round 2

This year the predictions have been slightly changed with the help of a student, Joshua Dale. The home ground advantage now is different when both teams are from the same country to when the teams are from different countries. The basic method is described on my Department home page.

Here are the team ratings prior to Round 2, along with the ratings at the start of the season.

Current Rating Rating at Season Start Difference
Crusaders 9.03 9.03 0.00
Chiefs 6.98 6.98 -0.00
Sharks 4.57 4.57 0.00
Hurricanes 4.40 4.40 0.00
Stormers 3.34 3.34 0.00
Bulls 2.55 2.55 0.00
Brumbies 0.30 -1.06 1.40
Reds -0.90 0.46 -1.40
Blues -3.02 -3.02 0.00
Highlanders -3.41 -3.41 -0.00
Waratahs -4.10 -4.10 0.00
Cheetahs -4.16 -4.16 -0.00
Kings -10.00 -10.00 0.00
Force -10.16 -9.73 -0.40
Rebels -10.21 -10.64 0.40


Performance So Far

So far there have been 2 matches played, 2 of which were correctly predicted, a success rate of 100%.

Here are the predictions for last week’s games.

Game Date Score Prediction Correct
1 Rebels vs. Force Feb 15 30 – 23 1.60 TRUE
2 Brumbies vs. Reds Feb 16 24 – 6 1.00 TRUE


Predictions for Round 2

Here are the predictions for Round 2. The prediction is my estimated expected points difference with a positive margin being a win to the home team, and a negative margin a win to the away team.

Game Date Winner Prediction
1 Highlanders vs. Chiefs Feb 22 Chiefs -7.90
2 Rebels vs. Brumbies Feb 22 Brumbies -8.00
3 Bulls vs. Stormers Feb 22 Bulls 1.70
4 Hurricanes vs. Blues Feb 23 Hurricanes 9.90
5 Reds vs. Waratahs Feb 23 Reds 5.70
6 Cheetahs vs. Sharks Feb 23 Sharks -6.20
7 Kings vs. Force Feb 23 Kings 4.20


February 20, 2013

Is there a 3-strikes law for piecharts?

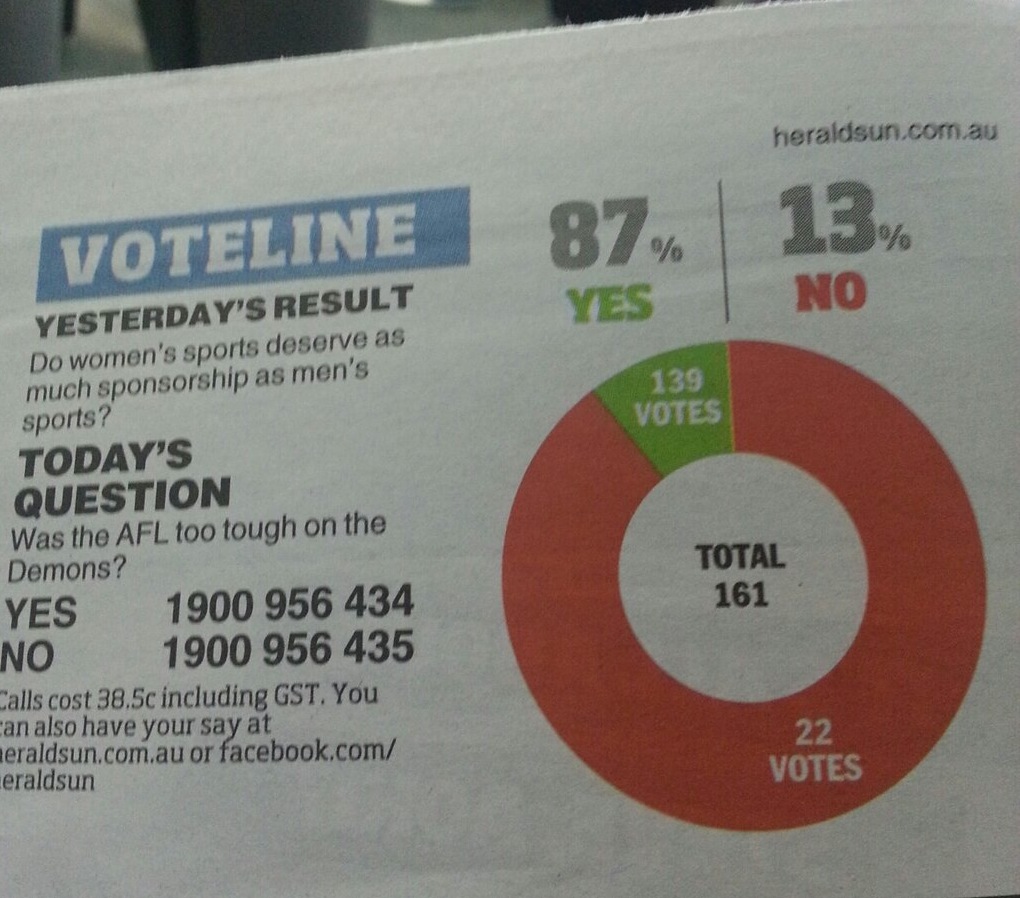
The Herald-Sun pie chart saga continues (thanks to @danfairbairn and @PeteHaitch on Twitter).   Can we get their piechart license suspended pending training and re-examination?

Can we revoke their piechart license?


This example further complicates the question of how they actually make these graphs.  In this one, the angle is at least approximately right, the percentages are right apart from being incorrectly rounded, but the graph is backwards.  We’ve also seen examples where the angles were completely wrong, but the two groups were correctly identified. It’s hard to see how an automated system could cause such a bewildering variety of problems, but it’s also hard to see how a real person could be so totally clueless about pie charts.