January 12, 2013
Some kind of bizarre coincidence?
The current H3N2 flu strain is causing serious illness in the US.
From the journalism blog heads-up, two adjacent headlines at Fox News

The current H3N2 flu strain is causing serious illness in the US.
From the journalism blog heads-up, two adjacent headlines at Fox News
The Herald story starts out
If you’re dreading returning to work on Monday, don’t despair – at least you’re not alone.
A new study has found only one in four Kiwis believes they are in their dream job, a percentage lower than in most major countries.
As usual, we can ask: who did the survey, how did they do it, and what are they selling?
The numbers come from LinkedIn, the well-known spam job-search company. They say
As part of its “Dream Jobs” study, LinkedIn surveyed more than 8,000 professionals globally to find out the most common childhood career aspirations and how many professionals currently have their dream job.
So, for a start, it’s not 25% of Kiwis, it’s restricted to ‘professionals’, however they were defined. That might well explain the high satisfaction reported in India and Indonesia, where getting into the ‘professional’ classification is harder and you’d expect more professionals to be happy with their jobs.
Other news sites have different versions of the information. For example, Mashable says that LinkedIn only sampled from their members, and that only 9% world-wide were in their dream jobs, with another 21% in a career that relates to their dream job, Huffington Post concurs, and this matches the LinkedIn press release.
The 8000 respondents were spread across at least 17 countries, and there’s no indication given of how many are from New Zealand. More importantly, there’s no indication of how they were sampled. I can’t find any evidence that the survey was done in a way that makes the sample size matter.
An interesting attempt to graph the recovery from the Great Recession, from the Atlanta Federal Reserve Bank (via)
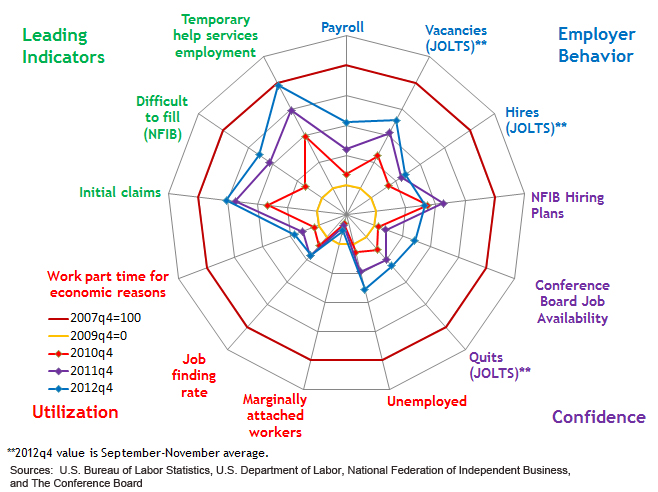
The outer circle shows 13 economic indicators at the peak of the boom, and the inner yellow circle shows the bottom of the recession. You can see that the ‘leading indicators’, that is, things that tend to move ahead of the rest of the economy, are improving quite a lot. Employer behaviour and confidence indicators are up a bit, but the employment indicators are still stuck at recession levels. If the leading indicators really are ‘leading’, the rest of the circle should be expanding relatively soon.
This graph will get confusing when there are many time periods or when the patterns are not strong. You could probably handle a larger number of time periods by having the older ones fade to grey or some such, but it still won’t be clear unless there’s a dramatic pattern.
Also, the 13 economic variables are in a particular order around the circle, and with some graphs like this, the visual effect can be quite sensitive to the order; clearly a bad thing.
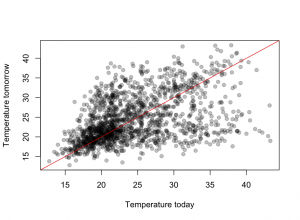
There has been a lot of coverage of Australian weather recently, and people who haven’t been to southeastern Australia in summer may have been struck by how big the reported temperature variations are. There’s a data set of daily maximum temperatures in Melbourne over ten years that has been used as an example in time series research because of the unusual patterns — a bimodal distribution in day-to-day temperature change.
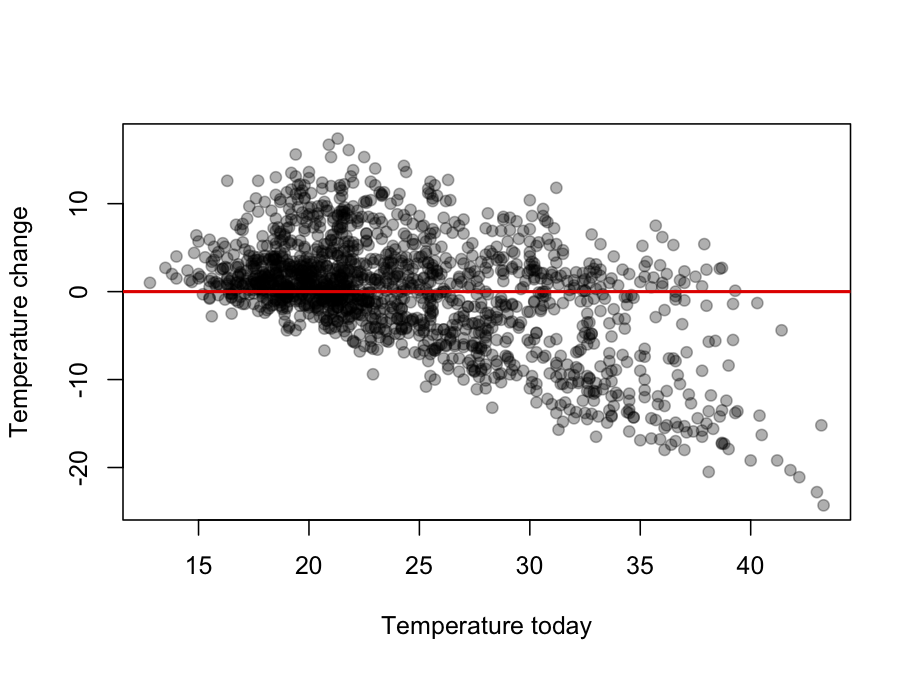
The graph shows Melbourne maximum temperatures from November through March for ten years. The basic pattern is that tomorrow’s maximum is either slightly higher than today’s, or is about 21C. The temperature keeps increasing day to day as long as the wind is from the land, then you get a cold front and people can sleep for a few nights.
It looks even more dramatic (why?) when the change in temperature is plotted against today’s temperature
Nate Silver is doing a Q &A session at reddit.com (they have a running feature I am A …. ask me anything)
The graph shows letter frequencies in English by position in the word — for example, ‘e’ is much less common as the first letter than as the third letter.
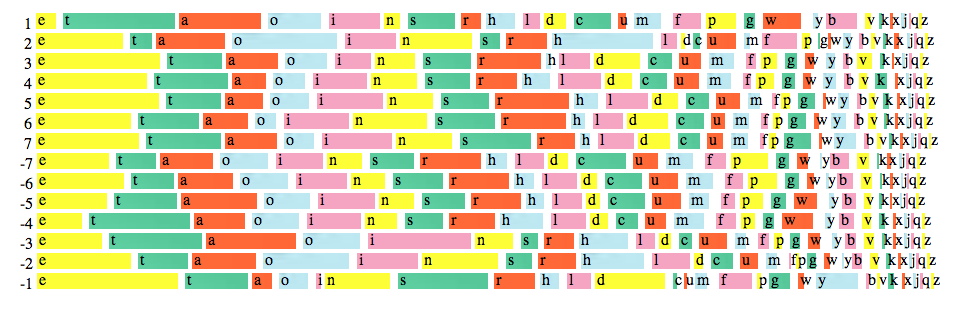
The first systematic study of these was done using a sample of 20 000 words collected by hand and analysed with punched cards and a card-sorting machine. The author recently wrote to Peter Norvig, at Google, suggesting that an update might be of interest. The full details, using 0.75 trillion words, are on Norvig’s web page.
While you’re there, if you have yet to encounter the “Gettysburg Powerpoint”, now is your opportunity.
Most ‘3-dimensional’ graphics that you see are using fake perspective and don’t actually provide much additional information. The Australian Bureau of Meteorology maximum temperature forecasts are a genuine 3-d data display, illustrating that you really, really don’t want to be in eastern central Australia this week. Notice how the coolest parts of Australia are the same temperature as here.
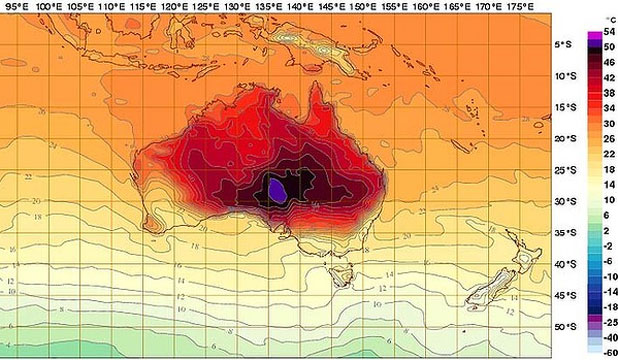
The purple colour at the top of the scale doesn’t fit in well with the rest of the spectrum, and stands out on the map. Normally this would a bad thing, but 50C deserves to stand out.
Stuff has a story about genetic testing today, which leads off
Those sending their DNA to be analysed cheaply overseas are obliged to share the results with life insurers and risk losing control of their most sensitive information.
If you read further, it turns out that all the information about insurance and law is Australian.
In October, they had a similar story, with information on the relevant US law.
The Herald has a story about police being arrested: 67 over 2 2/3 years. That’s about 25 per year. The rate this year so far is a bit lower than in the previous two years, but well within the margin of error.
The Police Association says this proves we don’t need an independent complaints process, since the police already do a good job in catching their own when they stray. Of course, the figures don’t show anything of the sort, unless there is some independent reason to believe that 25/year is the number that should be arrested. The Police Association also says that many of the arrests would have ‘not guilty’ results. This could be true, and it’s a pity that neither the Herald nor the Police Association provided any actual information on convictions.
The Herald also quotes a survey from October, purporting to show that confidence in police has fallen. I covered this at the time. It doesn’t.
The arrest counts are not evidence one way or the other on how well the police are policed. They are easier to obtain than relevant evidence would be, but that’s not much consolation.
Recent comments