October 30, 2012

Some people don’t know when to give up

After teaching an online course “Computing for Data Analysis” to 50,000 people through Coursera, Roger Peng has decided to do it all again on his blog next month.

Think of it as an Advent calendar for aspiring DIY statisticians.

October 29, 2012

Data visualisation tools

A list of 20 from NetMagazine, via BetterPosters.

Yes, I did check that R was on the list before passing it on.


Cocoa not-so-boom

The Herald is enthusing about the new worlds of chocolate, and the boom in consumption in various parts of the world.

Japan aside, chocolate sales are also growing 30 per cent year on year in China, while in India – even though one in two Indians have never tasted chocolate – growth is 20 per cent, for a treat taken ultra sweet and milky.

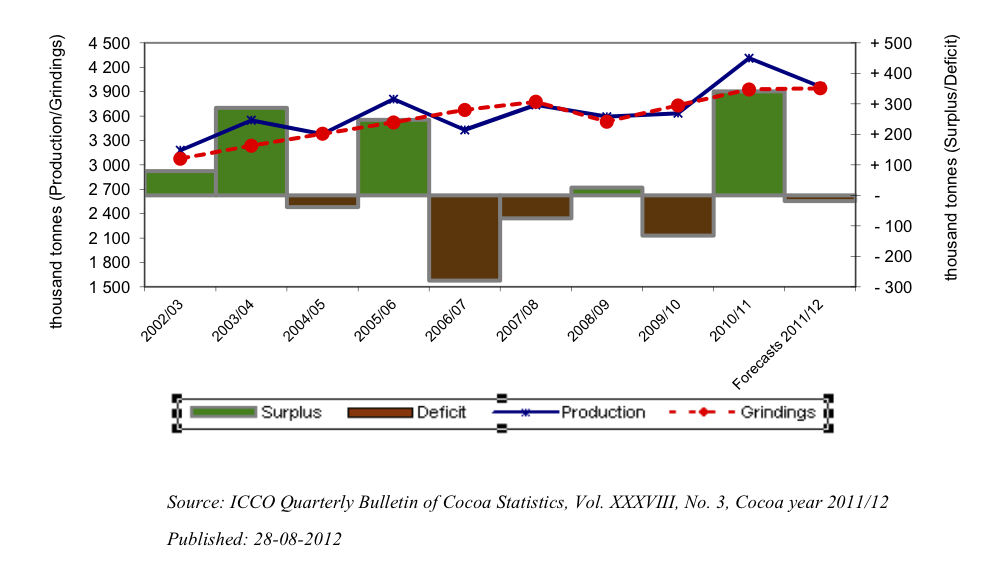
The Quarterly Bulletin of Cocoa Statistics, as you would expect from the name, takes a less effervescent attitude. Their data show a steady increase of about 3% per year for the past decade, with modest year-to-year fluctuations in production smoothed out by stockpiles.

70% of Auckland train trips to/from two stations

That’s Britomart and Newmarket. I just thought it was an interesting statistic, in the Herald’s coverage of the new “integrated” ticketing system (it works on trains, and also on trains.)

Auckland still larger than Wellington

Stuff, this time:

Auckland teenagers had the highest number of convictions for drink-driving, with 1553 in the past two years.

Christchurch teenagers weren’t far behind, with 1383, while 793 Hamilton teenagers were convicted and 728 Wellingtonians.

That’s out of a national total of about 9700 per two years (so this could also have been in our ‘think of a number and double it’ series).  Based on total population it looks as though the drink-driving rate in Auckland is about half that in the rest of the country — and any journalist should know that Auckland is roughly 1/3 of the country and Wellington and ChCh are each very roughly 1/3 of Auckland.

With a few minutes at Stats New Zealand we can check the denominators and see if teenagers are distributed differently than people.  At the 2006 Census, the number of 15-19 year olds was 99,000 for the Auckland region, 33,000 for the Wellington region, and 36000 for the Canterbury region (ChCh is about 60% of Canterbury), out of 300,000 for the whole country.  These follow the overall population pretty accurately

So, the numbers are showing a news story that’s the opposite of what was actually reported: Auckland has dramatically lower rates of conviction for drink-driving among teenagers than the country as a whole and than the other major cities.

Stat of the Week Competition: October 27 – November 2 2012

Each week, we would like to invite readers of Stats Chat to submit nominations for our Stat of the Week competition and be in with the chance to win an iTunes voucher.

Here’s how it works:

  • Anyone may add a comment on this post to nominate their Stat of the Week candidate before midday Friday November 2 2012.
  • Statistics can be bad, exemplary or fascinating.
  • The statistic must be in the NZ media during the period of October 27 – November 2 2012 inclusive.
  • Quote the statistic, when and where it was published and tell us why it should be our Stat of the Week.

Next Monday at midday we’ll announce the winner of this week’s Stat of the Week competition, and start a new one.

(more…)

October 28, 2012

Why we study the obvious

A standard criticism of science, especially in areas you don’t agree with, is to quote the ‘obvious’ findings that scientists have wasted time and money checking.

Quite often, though, the obvious doesn’t happen.  Stuff has a story about a randomized trial of intensive weight-loss propaganda in people with Type II diabetes: the trial is being stopped early, after ten years, because it isn’t working.  People in the intervention group are losing weight, and improving their control of blood sugar, but they are still getting heart attacks and strokes at the same rate as the control group.

An earlier trial had given a lot of hope by showing that quite small increases in exercise and reductions in weight could stop pre-diabetic levels of insulin resistance progressing to full-blown diabetes.

The current trial is led by Professor Rena Wing, of Brown University, who is hardly a heretic on the general weight-loss message.  Her research focuses on ways to maintain weight loss, and when the trial started she said

“Getting people to lose weight is talked about as the best treatment for both preventing diabetes in people who are overweight and for treating individuals who already have the disease,” Wing said. “If the long-term data from the study support these approaches, it will make it easier to go to patients, insurance companies and public-policy makers and say, ‘Yes, weight loss works over the long run.’”

We don’t have the full details of results, which are still be analysed. However, the trial succeeded in getting people to about the same amount of weight as in the earlier diabetes prevention trial, and to keep the weight off.  There were also improvement in glucose control, in sleep apnea, and in general quality of life, which might be sufficient motivation for weight loss, but not in heart disease and stroke.   This was a large, well-funded, well-designed study, and I would have bet on the results being the other way.

There won’t be any shortage of people who don’t want to believe the results, and it will be interesting to see if any of them can come up with some useful explanation for why the other differences between treatment and control groups don’t translate to reductions in heart disease or stroke.  [There will also be plenty who are happy to just say the results are wrong without needing anything as difficult as an explanation]

Unless there is something the researchers have completely overlooked, this trial adds to the long list of things that improve blood test results but don’t provide the expected health benefits in Type II diabetes.
Use this new treatment while it still works

An analysis reported in JAMA, and more accessibly by the LA Times shows that really dramatic beneficial effects of new treatments, even in good-quality clinical trials, are usually over-estimates.

They looked at 85,000 treatments for which there were multiple trials and binary (yes/no) outcomes measured.  In the 8000 treatments where the first trial showed a very large benefit, 90% of the time the subsequent trials showed a smaller benefit.

Also, when  large benefits were seen in well-replicated studies these were not typically for life or death issues: the researchers say

These include clinical benefits such as control of nocturnal enuresis with alarms in children, or symptomatic improvement with 5-aminosalicylic acid in ulcerative colitis; mostly mild or modest harms such as burning with capsaicin or local tenderness with the influenza vaccine; laboratory-determined response such as induction of hepatitis B surface antigen with hepatitis B vaccination; and control of acute pain with analgesics such as etoricoxib or diclofenac. As shown, all of these effects corresponded to very large absolute risk differences.

These findings aren’t actually surprising: if a treatment does very well in its first clinical trial it was probably lucky as well as effective.  Very large benefits in survival are very rare, so if you think you’re seeing one, you’re probably wrong .  It’s still useful for someone to put together all the data confirming what we expect, and it’s useful to remember when you see a headline about miracle cures.

Are Kiwis more cautious online?

The Herald has a headline “Young Kiwis among most savvy web users”, which would be justified if the phrase ‘most savvy’ was omitted.

The story comes from AVG, who sell internet security software, and so want you to be nervous online.  They have been conducting a set of surveys starting with kids and are now on to 18-25 year olds.  All we’re told about the survey methodology (by AVG, not by the Herald) is that the surveys were conducted by Research Now, so it’s not completely bogus but might be more or less representative or, um, ‘targeted’.

However, we do get told that there were only 4400 respondents in 11 countries.  Even with a completely random sample of 400 in each country, that gives a margin of error for comparing two countries of about 7 percentage points.   You can see a set of infographics from the survey here, and it’s pretty clear that a lot of the differences are compatible with random sampling error.

There certainly isn’t a general tendency for Kiwis to be more ‘web savvy’: while NZ has one of the lowest rates of admitting to accessing banned sites while at work, we have one of the highest rates of allowing colleagues to see everything that friends can see on Facebook.  The proportion for other questions, such as ‘friend’ing your boss, was intermediate.


October 25, 2012

Journalists have to get it from somewhere

A new paper in the (open-access) journal PLoS Medicine looks at ‘spin’ in reporting of scientific findings in the mass media, in press releases, and in the scientific papers underlying the press releases.

They found that the scope or importance of scientific findings were exaggerated in about half the media stories, almost always based on what was in the press release.  That’s not at all surprising.  The interesting part is that ‘spin’ in the press release often followed ‘spin’ in the scientific paper itself.  That is, it’s not just that the scientists cooperate with the university press office, they even exaggerate when writing for other scientists.

This doesn’t exonerate the journalists in cases of science puffery.  In sports, we expect the media to detect and ridicule any attempt to treat an ordinary All Blacks recruit as the second coming of Colin Meads.  They should also be able to tell the difference between a modestly interesting test-tube experiment and a ground-breaking clinical trial.