November 4, 2012

More Hurricane Sandy scale

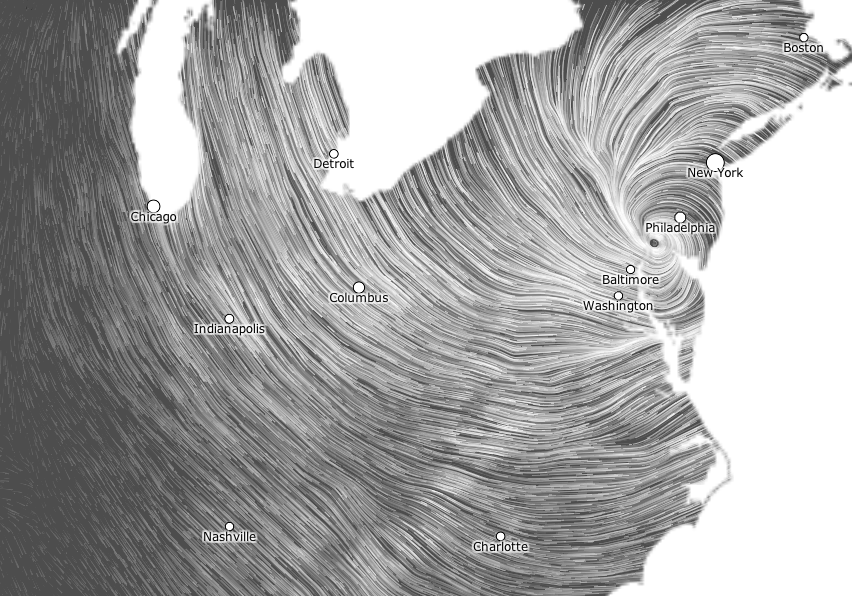
This wind map (click to embiggen) is from hint.fm, who we’ve linked to before.  It shows the national short-term forecast wind grid, just after Sandy crossed the coast.  For scale, the distance between Boston (top right) and Charlotte (bottom) is almost exactly the distance between Auckland and Invercargill

November 3, 2012

Nerdnite again

It’s Nerdnite time again, Tuesday night, 6:30pm, at Nectar (470 New North Rd, above the Kingslander).

The speakers this time:

  •  Cather Simpson, director of the Photon Factory, on lasers
  • Matthew Dentith, epistemologist, on conspiracy theories
  • Mike Dickison, giant flightless bird fancier, on why birds aren’t larger.

Incidentally, if you aren’t one of the 58273 people who have seen Mike Dickison’s hilarious presentation “Paedomorphic flightlessness and taxonomic affinities of an enormous Recent bird”, what are you waiting for?

Can we have some CPI adjustment?

Once again, NZ homes are at record nominal asking prices.

The real estate industry doesn’t make it easy to do inflation adjustment, but according to this, the average asking price in May last year of $429k  was 2% above the previous month and ‘just topped’ the October 2007 level that was when Realestate.co.nz started publishing the statistic. That means the October 2007 national average asking price was between $420k and $429k.

Suppose you bought a house in October 2007 for $420k and sold it now for the national average asking price of  $445,529.  Those 2007 dollars are worth about $479k  in today’s money, so you would have lost 8%, or about $34,000 in 2012 dollars.   That’s before taking into account maintenance, insurance, interest, and transaction costs.  The conclusion is about the same if you compare to an index of average wages: all these are helpfully provided by the Reserve Bank’s inflation calculator.

The comparison for Auckland may be more favorable — I can’t find what the 2007 average asking price was, but if it was below $535000, then we are at a new peak (or the top of a new bubble).

In May last year, Stuff had a good article on house prices and inflation, and even an infographic that told you more than ‘up’ or ‘down’, but that seems to have been an exception.

November 2, 2012

I’m normal, you’re normal

Frances Woolley at Worthwhile Canadian Initiative has another fascinating graph.  This one’s based on US data from the World Values Survey, where people were asked which income decile they are in:


As she describes, it doesn’t seem to be that the survey has accidentally undersampled the poor and the rich.  People seem to be deluded about where their income fits in the national distribution.

There are a number of possible explanations.  At the high end, there is the fact that people with more money than you are more visible, so it’s easy to overestimate how many of them there are.  At the low end, part of the explanation may be that young people whose family income has been higher in the past and will be higher in the future place themselves higher up in the distribution. The obvious example is university students, who in some ways behave more like their parents than like non-students with similar household income.

Part of it, though, is that people just overestimate how normal they are, just as  you (and I) probably overestimate how many people care about statistics in the media.

What a 72% chance means

For those of you who have been living in a cave on Mars with your eyes closed and your fingers in your ears, the US is having a presidential election.

Nate Silver, a former baseball nerd who has climbed to fame by computing averages of opinion polls, said earlier this week that  Obama had a 72% chance of winning.  Old-fashioned political pundits disagreed, saying the race was too close to call (they also accuse Silver of just computing averages of opinion polls).

Andrew Gelman, a stats professor at Columbia University, has an opinion piece in the New York Times explaining what 72% means:

What I’m saying is that I can simultaneously (a) accept that Obama has a 72 percent chance of winning and (b) say the election is too close to call. What if the weatherman told you there was a 30 percent chance of rain — would you be shocked if it rained that day? No.

For Kiwi readers, a useful analogy might be rugby.  The All Blacks have beaten Australia in 70% of their games overall, and 75% in NZ.

November 1, 2012

A small insight

Surveys really are the best way to get free advertising space.

Speight’s did some sort of survey of Kiwi men, and it’s turning up all over the place. They asked 504 men some incompletely described set of questions with no hint as to how they were selected.

Highlights of the results:

  • A staggering 97% claim they would pay the correct amount of money when buying from an honesty box.  We can conclude that men who are financially dishonest also lie on surveys.
  • Just over 80 per cent said they would help a stranded motorist on the road, but in Otago only 76 per cent said they would stop to lend a hand.  If there are 504 respondents across the country, you might wonder if there are enough in any one region to distinguish 76% from 80%.  No way.

The press release quotes Anna Gestro from Speight’s as saying  “The Speight’s survey is a small insight into the Kiwi male psyche.” 

How small? Very, very small.

Hurricane Sandy Signals

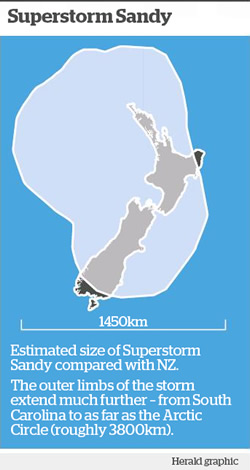
Despite all the media coverage of Hurricane Sandy, I found it hard to get a sense of the scale of the storm and the destruction it caused – there’s plenty of noise, but hard to find the signals.

A few sources of information I’ve found useful are:

A map in yesterday’s NZ Herald giving useful size context to the storm:

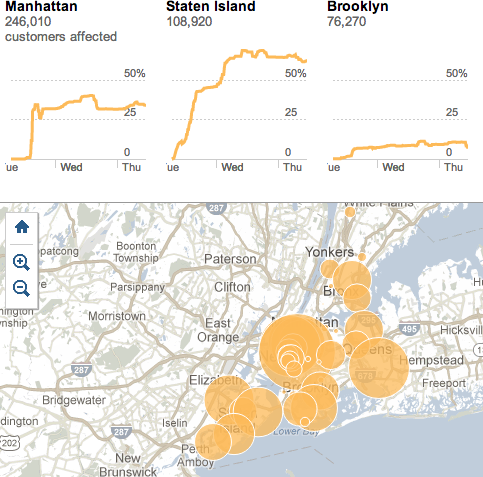
The New York Times is real-time graphing and mapping the number of customers affected by power outages in New York city after Hurricane Sandy:

For another good overview divided by different types of damage in New York city, see: Assessing the Damage From Hurricane Sandy.

Google has an interactive crisis map.

There were not-so-useful statistics being used such as “Facebook Sees Mentions of ‘Hurricane Sandy’ Spike 1 Million Percent”.

The Atlantic does a nice job of verifying social media photos of Sandy.

Have you found any good resources online for getting a sense of the scale and destruction of Hurricane Sandy? Let me know!

October 31, 2012

Diet story with added fizz

According to Stuff, a Japanese research study has found that sugary drinks cause strokes. In women, not men (they found a weak association in the opposite direction in men).  And only strokes, not heart disease. And when they say “sugary”, this isn’t based on the sugar content, since 100% fruit juices were excluded.   The researchers have some fairly unconvincing excuses for why only strokes were increased, and only in men.

The headline was “Female? Put down the fizzy drinks”, which manages to capture the implausible part of the findings while getting the plausible part completely wrong: the research looked at drinks with added sugar, not drinks with added fizz.

The story does better than the headline, at least putting the research in context with the other findings that suggest the impact isn’t restricted to strokes in women. They also quoted an expert from the Cleveland Clinic, who sensibly ignored most of the details of the study findings and said:

”It makes sense, if (sugar sweetened beverages) increase the risk for obesity, diabetes, insulin resistance, inflammation, then it should, in fact, raise the risk for cardiovascular disease, and that’s what we’re seeing,” said Adam Bernstein, a researcher at the Cleveland Clinic, who was not involved with the study.

Other sources did far worse than Stuff. For example, the site Food Navigator completely misrepresented the results, saying that “one fizzy soft drink per day could bump up the risk of stroke by up to 80%”, when the actual figure in the abstract is 21% for total stroke (something that they got right later in their story). They also said the risk was increased in men, which is the opposite of what the paper says, and that the participants were all between 40 and 49, when in fact they were between 40 and 59 at the start of the study and between 58 and 77 at the end of the study.

The really interesting question is why this study, which doesn’t actually add much to what we already know, has made global news.  We’d have to ask Reuters about that.

With friends like these…

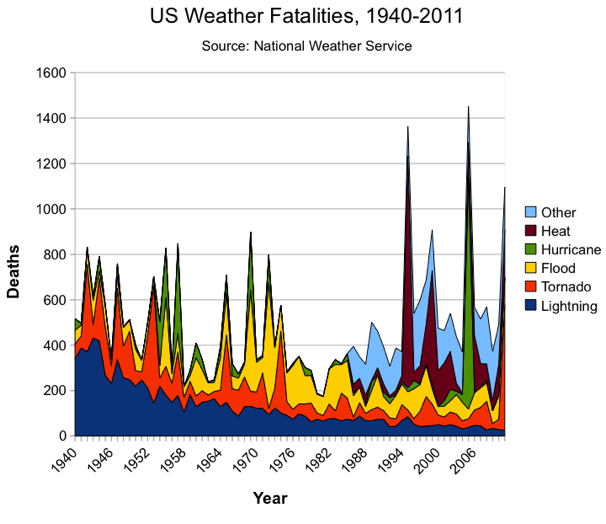
On Ezra Klein’s blog at the Washington Post, Dylan Matthews has published one of the least convincing scary climate change graphs I’ve even seen.  The graph purports to show that weather fatalities are increasing in the USA, and this is  attributed to climate change.
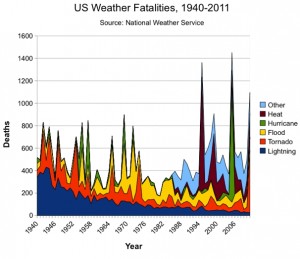
The most obvious feature of the graph is the decrease in deaths due to lightning, which is partly because people spend less time outside and partly because of better forecasting.   This is also an excellent illustration of the fact that stacked plots don’t work very well for unordered categories.

There’s an increase in the light blue section in recent years, but it’s obvious that the data weren’t recorded far back into the past. Matthews says “Other” includes cold, winter/snow, rip current and miscellaneous weather events.  Part of the increase in that category reflects better NWS record-keeping, but the spike is striking, nonetheless.”  Deaths from cold and snow are certainly not a new phenomenon in the US, and on average are probably decreasing with climate change.

The 1995 Chicago heat wave is visible.  This genuinely was an event of the sort that is going to be more common with climate change, but again, the deaths from heat weren’t recorded back into the past.  Just off the graph to the left is 1936, when more than 5000 people died in the worst heat wave in US history, a number that would swamp the weather events of recent years.

Even the hurricane trend is misleading: most hurricanes now kill relatively few people because of better warnings and better buildings.  There’s a big spike for Katrina, again a major disaster, but only the third worst US hurricane in terms of deaths. The Galveston hurricane of 1900 killed more than four times as many people.

And even taking the numbers at face value, the population of the US now is 2.5 times what it was in 1940, on the left-hand side of the graph. The death rate from weather in the US is lower than it was in the past.  It’s also lower than it’s going to be in the future, a conclusion which, unfortunately, is grounded in a lot more than this graph.
Hurricane map

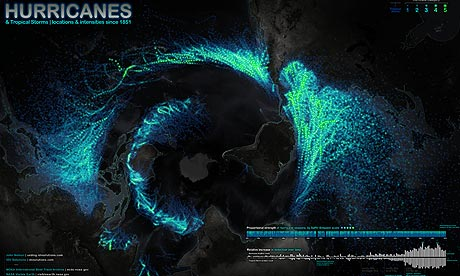
The Guardian has a map (also with animated thingies) of all the hurricanes since 1851.

d

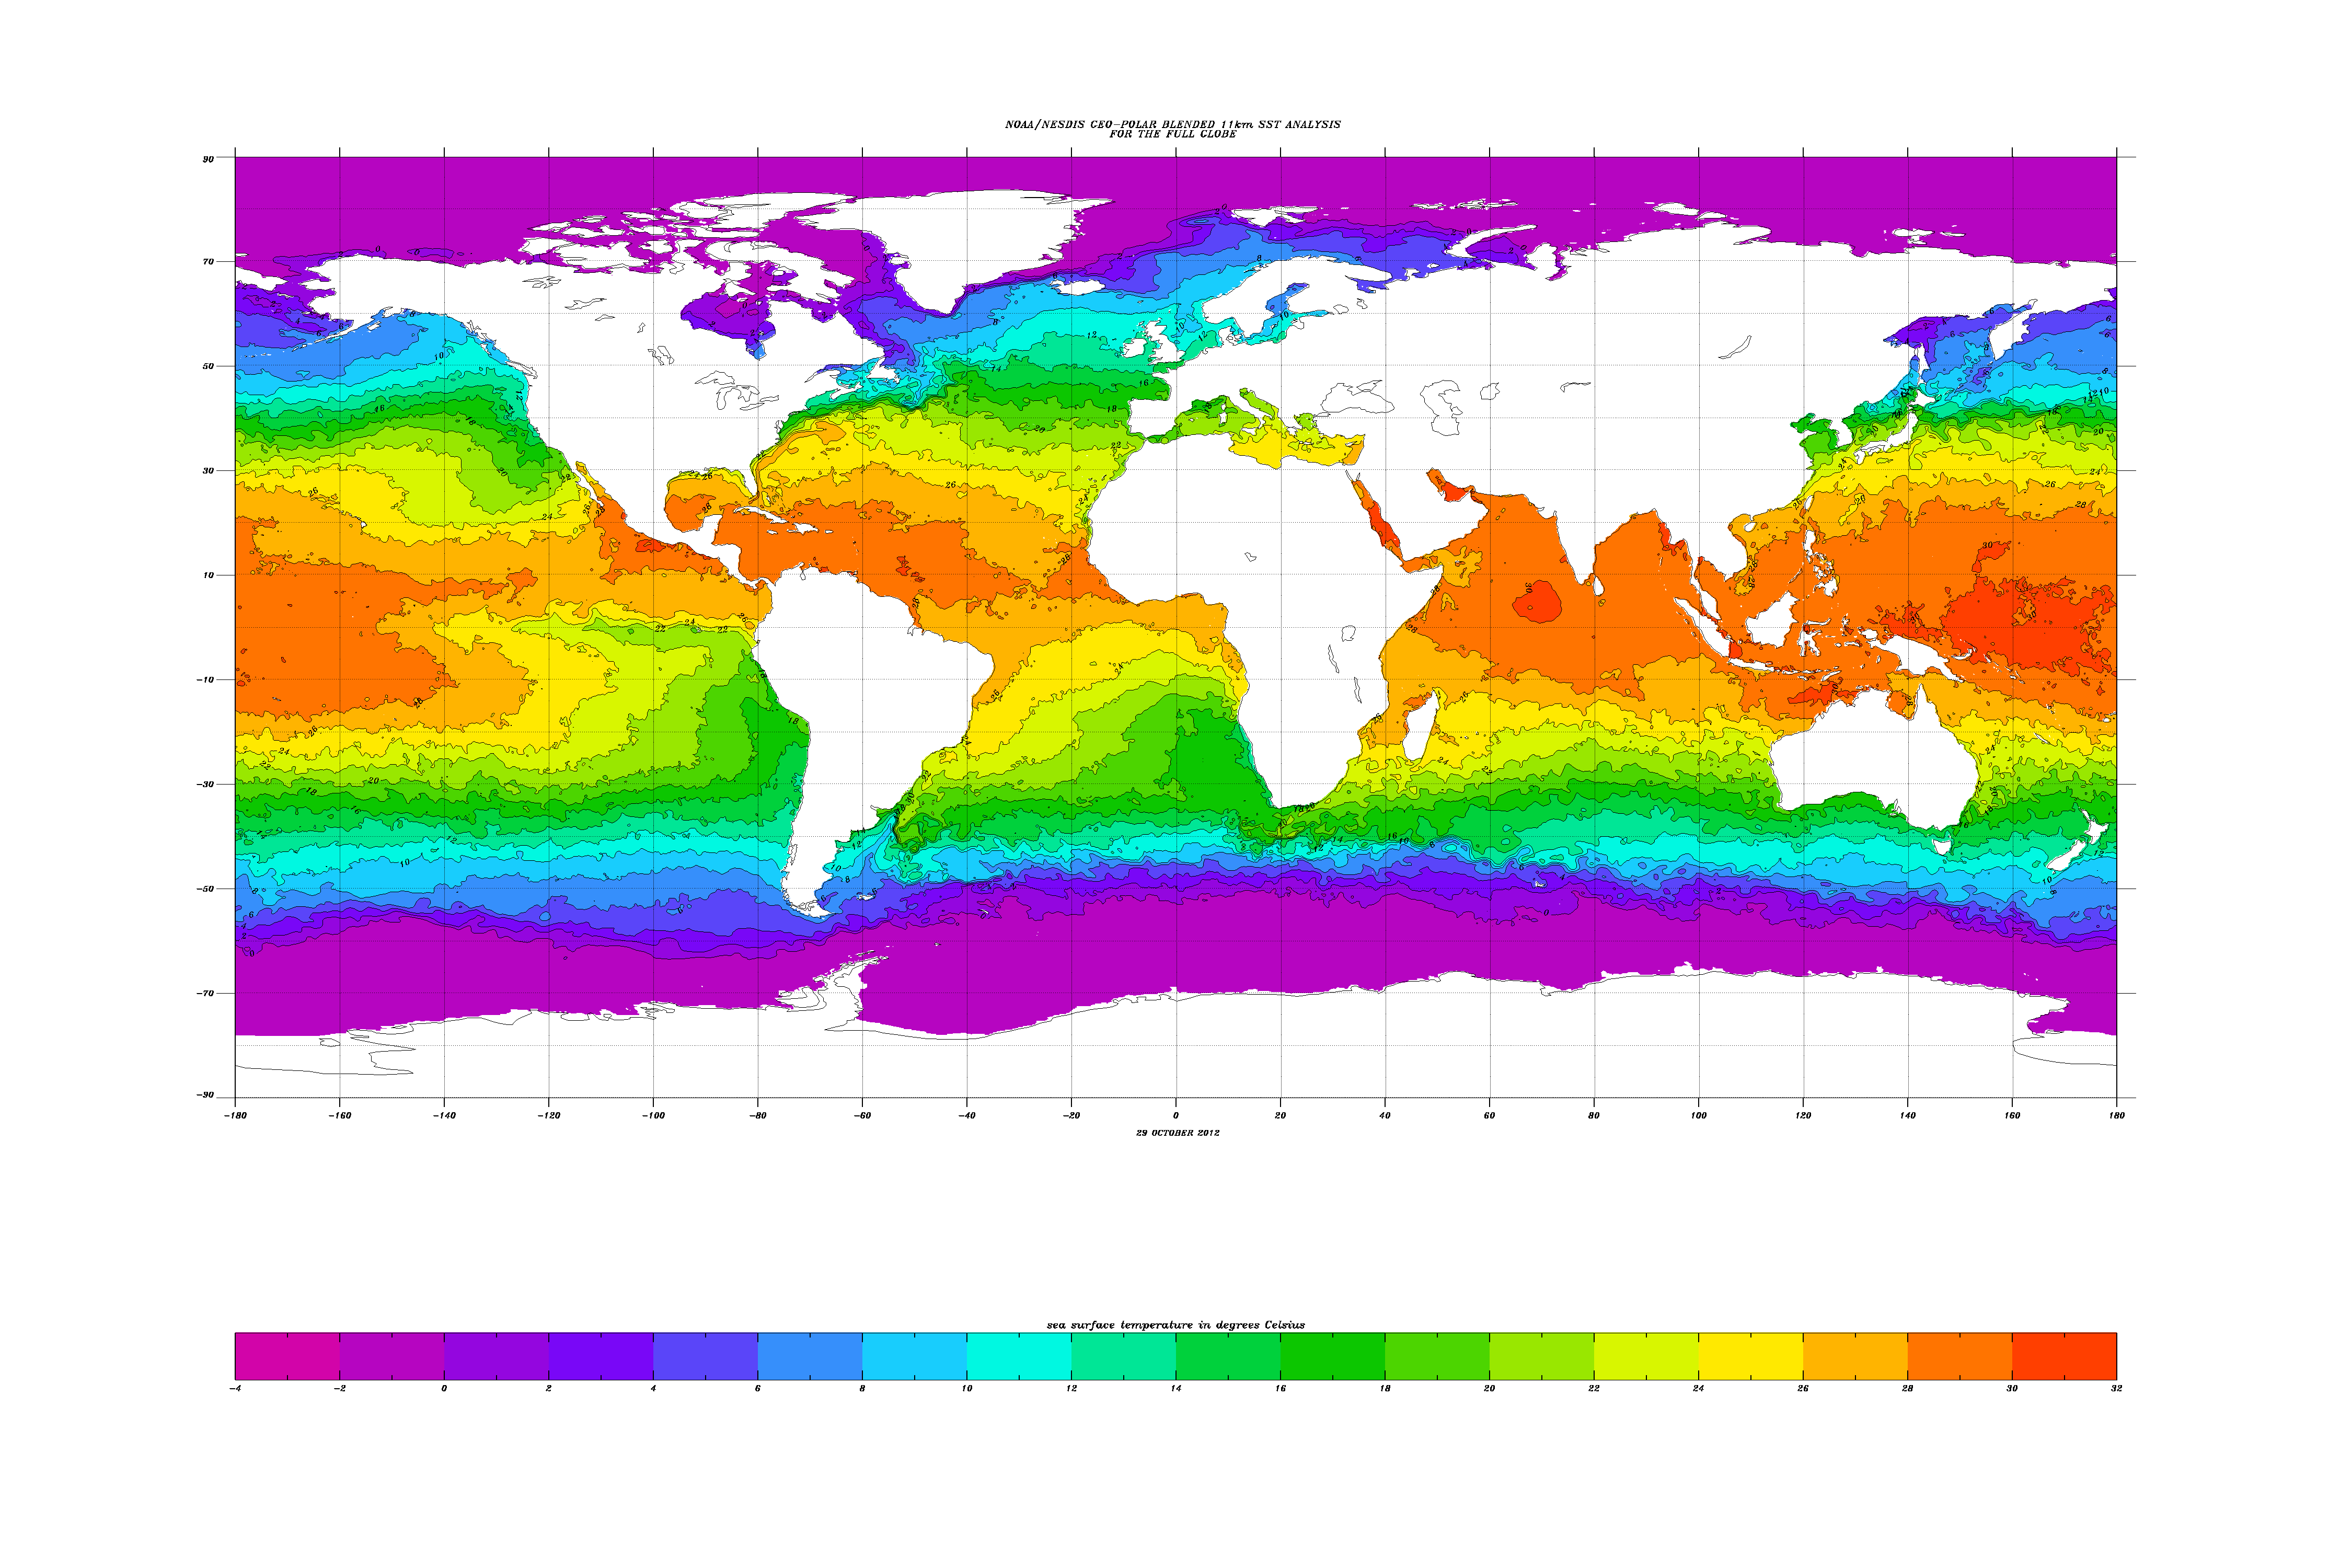
One of the most dramatic features is the semicircle of hurricanes in the Southern Hemisphere.  That’s because the ocean isn’t warm enough in the other half: see this graph from NOAA

Since the oceans are getting warmer, you might expect hurricanes to be getting worse.  It’s a bit more complicated than that, since climate change is warming the upper atmosphere more than the surface, which would tend to decrease hurricanes.  Still, NOAA expects more really intense hurricances and greater total rainfall from them, and they think it’s more likely than not that the overall frequency will go up.