October 5, 2012

You could put it that way

….but why?

The Herald passes on figures from a

New Zealand is overweight – collectively the adult population weighs more than 232,000 tonnes.

But while New Zealand accounts for only 0.08 per cent of the total weight of the world adult population, it makes up 0.22 per cent of the world’s excess weight due to obesity, according to a new study.

It makes sense to talk about NZ having more than its share of carbon emissions, because this is a global resource that is valuable to everyone.  Obesity, not so much. Alternatively, it could make sense if there was a linearly increasing health risk with weight, but again there isn’t: there’s a broad low-risk region with health risks increasing dramatically at higher or lower levels.

October 4, 2012

Science communication training through blogging

Mind the Science Gap is a blog from the University of Michigan:

Each semester, ten Master of Public Health students from the University of Michigan participate in a course on Communicating Science through Social Media. Each student on the course is required to post weekly articles here as they learn how to translate complex science into something a broad audience can understand and appreciate. And in doing so they are evaluated in the most brutal way possible – by you: the audience they are writing for!

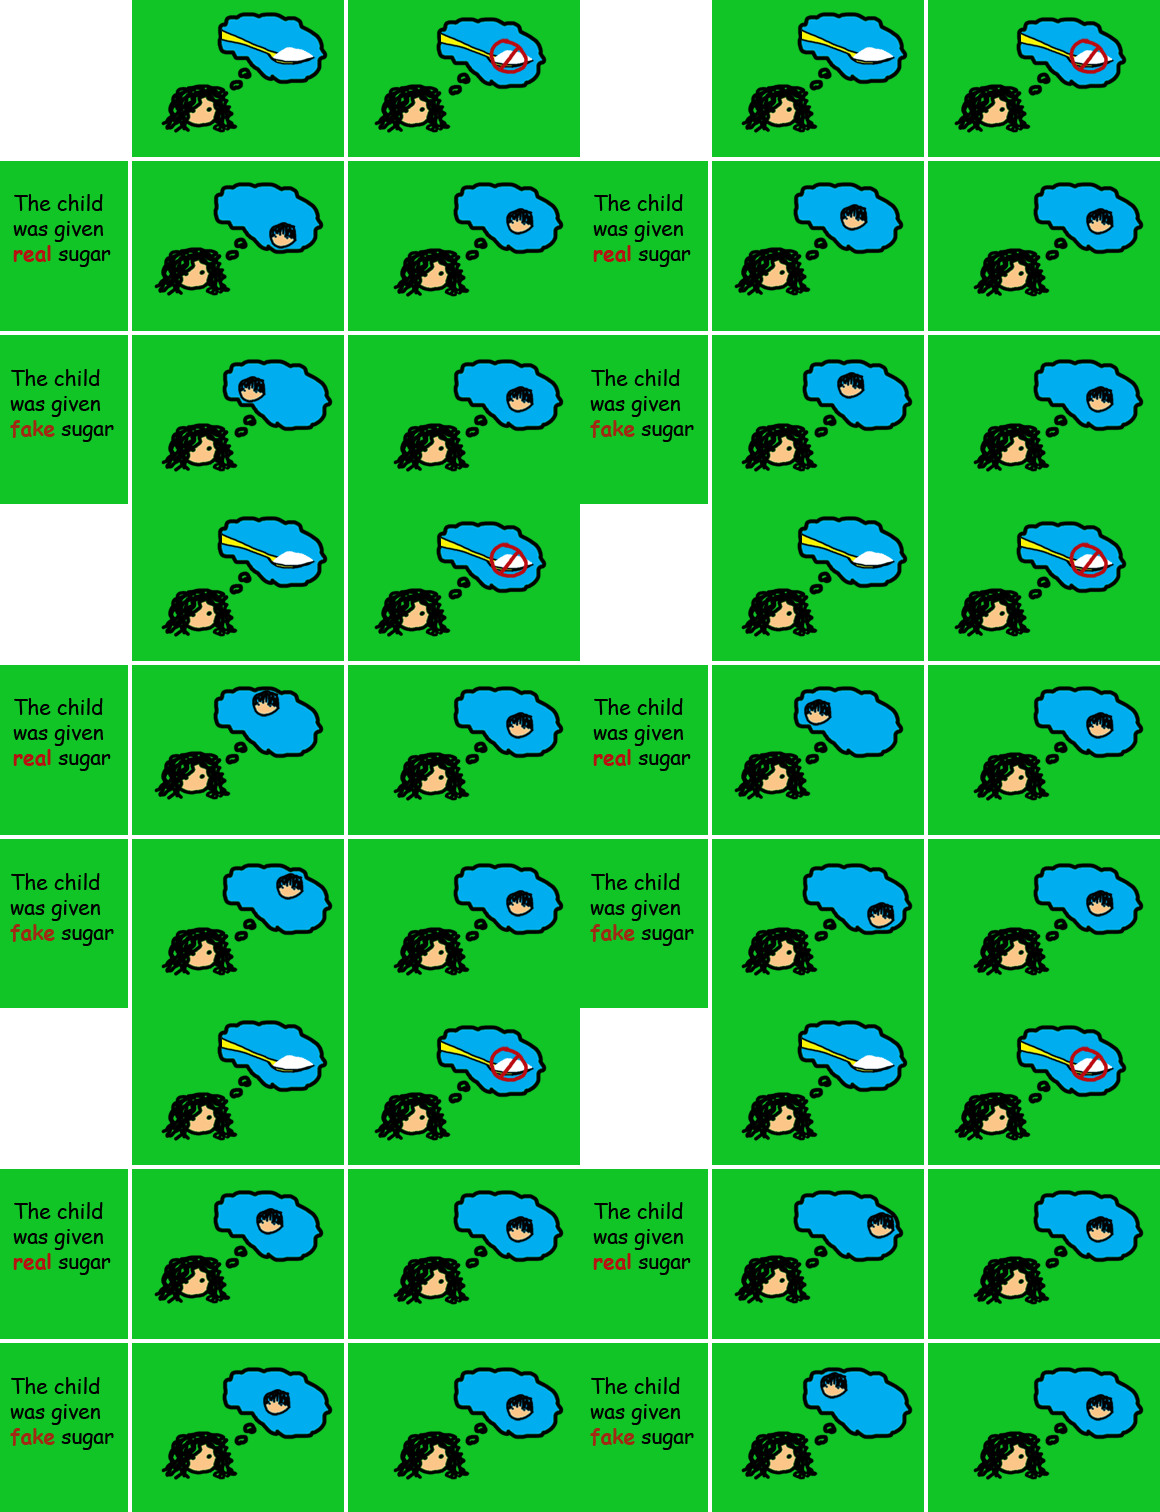
The post that attracted me to the blog was on sugar and hyperactivity in kids, not just for the science, but because someone has actually found a good use for animated GIFs in communicating information: click to see the effect, since embedding it in WordPress seems to kill it.

Citizen Statistician

Citizen Statistician is a new blog from Rob Gould and others at the Department of Statistics, UCLA. The blog discusses statistics in the age of the “Data Deluge”, an age in which data are large, complex, everywhere visible, accessible, and where data analysis tools are available to everyone.

To date, they’ve been discussing how to get personal Fit Bit data and Yelp data.

We’ve also added the blog to our list of recommended sites down the sidebar of Stats Chat.

October 2, 2012

Fishy journalism

By comparison with NZ, the UK media are a target-rich environment for statistical and scientific criticism.  The Telegraph ran a headline “Just 100 cod left in North Sea”, and similar stories popped up across the political spectrum from the Sun to the Socialist Worker.

The North Sea, for those of you who haven’t seen it, is quite big. It’s about three times the size of New Zealand.  You’d have a really hard time distinguishing 100 cod in the North Sea from no cod.  An additional sign that something might be wrong comes later on in the Telegraph story, where they say

Scientists have appealed for a reduction in the cod quote from the North Sea down to 25,600 tons next year.

If there are only 100 cod, they must be pretty big to add up to 25,600 tons of catch. They’re not only rarer than whales, they are much bigger.

It turns out (explains the BBC news magazine) that the figure of 100 was for cod over 13 years old. The papers assumed that 13 was some basic adult age, but they should have been thinking in dog years rather than human years.  A 13-year old cod isn’t listening to boy bands, it’s getting free public transport and looking forward to a telegram from the Queen.

The government department responsible for the original figures issued an update, clarifying that the number of adult cod in the North Sea was actually about 21 million.

October 1, 2012

Computer hardware failure statistics

Ed Nightingale, John Douceur, and Vince Orgovan at Microsoft Research have analyzed hardware failure data from a million ordinary consumer PCs, using data from automated crash-reporting systems. (via)

Their main finding is that if something goes wrong with your computer, you should panic immediately, rather than being relieved when it seems to recover. Machines that accumulated at least 5 days full-time use over eight months had a 1/470 chance of a hard disk failure, but those that had one hard disk failure had a 30% chance of a second failure, and those with a second failure had nearly a 60% chance of a third failure.  Do you feel lucky?

It’s obvious that the set of computers that have a failure are basically doomed, but this still leaves open an interesting statistical question.  Does the risk of a second failure increase because the first failure damages the computer, or because the first failure picks out a set of computers that were always a bit dodgy?   I think the researchers missed something here: they tested for whether the times between failures have an exponential distribution (which is the distribution for events that don’t have any memory), and found that it didn’t.  That doesn’t distinguish between the situation where each computer has its own constant risk of failure, and the situation where each machine starts off the same but some of them have risk increasing over time.

For computers, it doesn’t matter very much which of these possibilities is true, but in some other contexts it does.   For example, if young people sent to prison are more likely to reoffend, we want to know whether the prison exposure was partly responsible, or whether these particular people were likely to reoffend anway. Unfortunately, this turns out to be hard.

Let’s-all-panic colour scheme

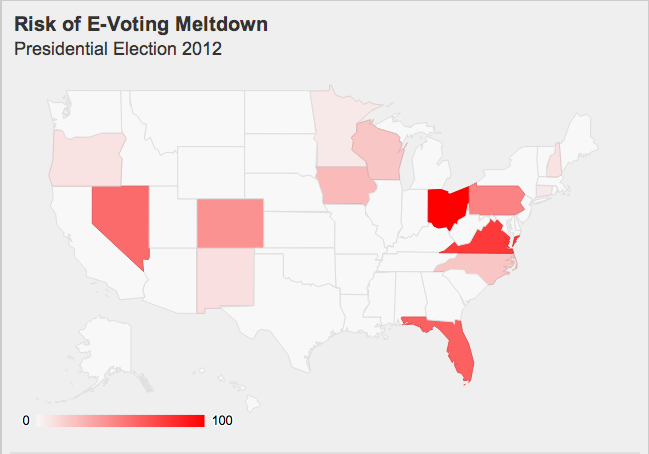
The excellent blog Freedom to Tinker, which focuses on political and social policy concerns related to computing, has an interactive graphic showing where problems with electronic voting are most likely to have a serious impact on the US election. Here’s a snapshot:


The ‘risk’ is scaled so that the top state, Ohio, is at 100. Because of the association of 100 with 100% that probably tends to exaggerate the impact, but the color scheme is worse. There’s almost no visible difference between Ohio at 100 and Virginia at 77, but Pennsylvania (47) is visibly paler than Nevada (57).  For comparison with the colour scale in the map, here’s a colour scale that tries to be uniform (a straight line in CIE Lab space)

Looking at this scale (and using a color picker program for better matching), Virginia seems to be at about 85, and Florida(61) well above 70.  So there really is a distortion of the visual impression.  The distortion probably isn’t deliberate, but comes from using linear interpolation on a scale that doesn’t match visual perception as well.

Worthless degrees

The Herald, overcoming its dislike of education league tables,  says that NZ degrees are the most worthless in the developed world

New Zealand is at the bottom of the global league tables. The net value of a man’s tertiary education is just $63,000 over his working life, compared with $395,000 in the US. For a Kiwi woman, it’s $38,000 over her working life.

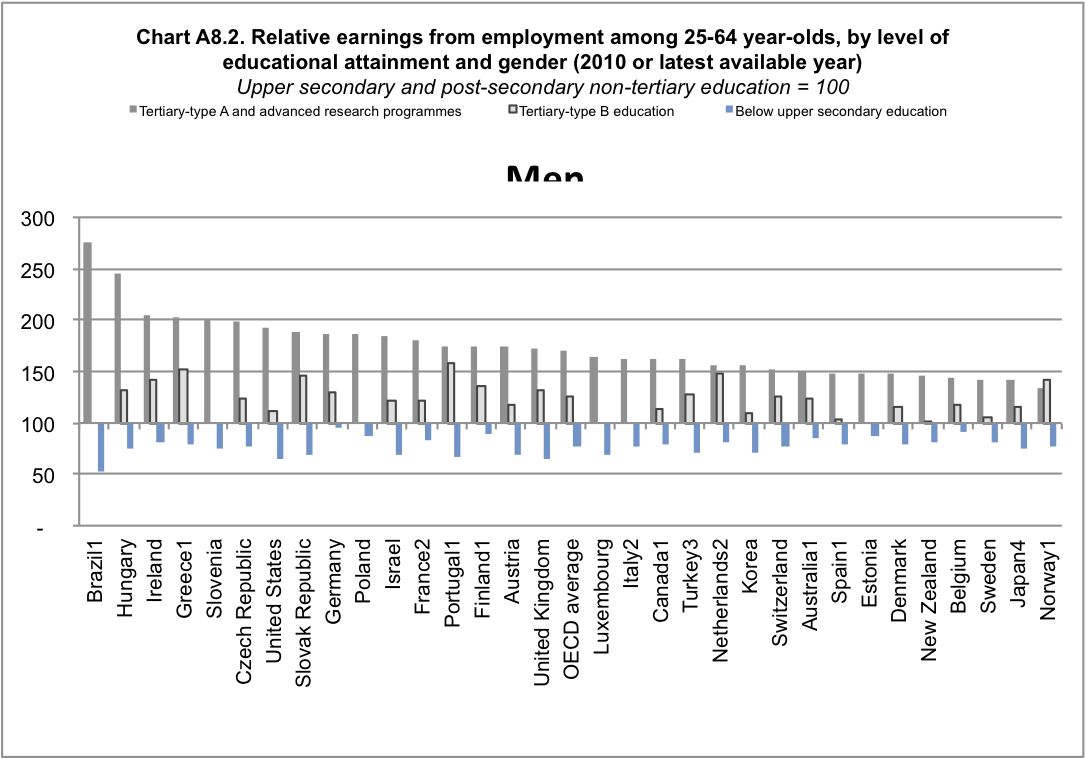
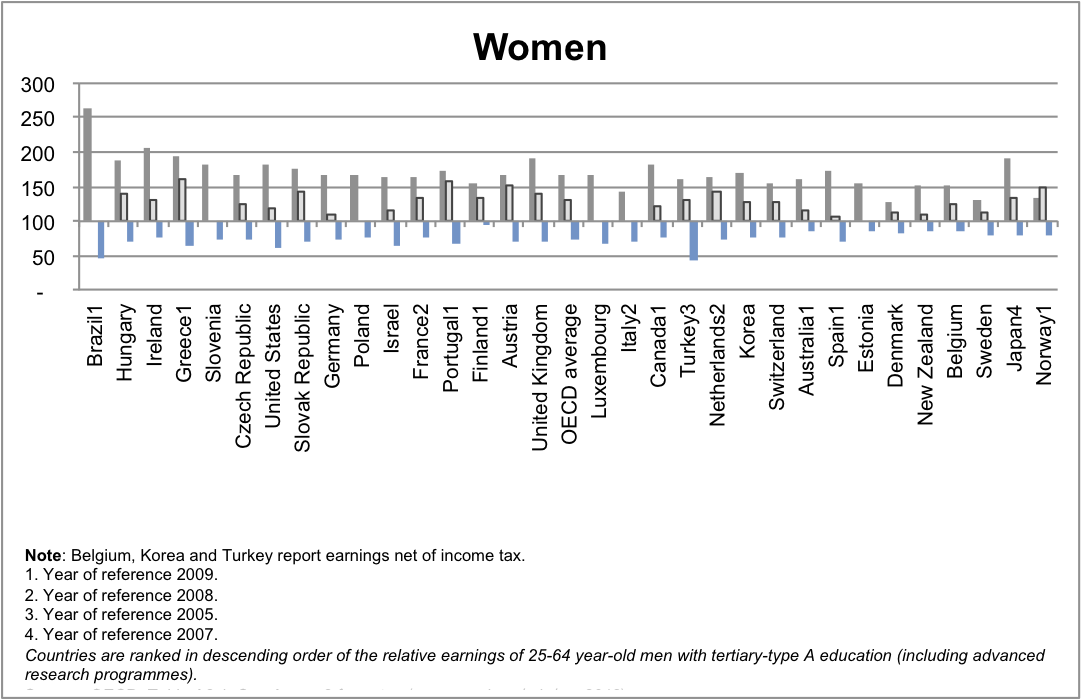
They don’t actually say what OECD report they looked at, but if you go to the OECD Directorate for Education and look at the most recent report, you can get these graphs (click to embiggen)


From the graphs, it’s fairly clear that for ‘Tertiary type-A and advanced research” degrees, NZ is not in fact at the bottom, but people with “Tertiary B-type” degrees do not seem to have any difference in income from those without degrees.  So what are these types: Type A is

Largely theory-based programmes designed to provide sufficient qualifications for entry to advanced research programmes and professions with high skill requirements, such as medicine, dentistry or architecture. Duration at least three years full-time, though usually four or more years

and Type B is

Programmes are typically shorter than those of tertiary-type A and focus on practical, technical or occupational skills for direct entry into the labour market, although some theoretical foundations may be covered in the respective programmes. They have a minimum duration of two years full-time equivalent at the tertiary level.

So, people with traditional university degrees do earn more in NZ, but people with other tertiary qualifications may well not.  It’s also important to remember that these are people in NZ with these degrees: the earnings of Kiwis who migrate overseas are not counted, but the degrees of migrants to NZ are counted even if they aren’t really recognised here.


The other interesting thing about the graph is who else is at the low end: Norway is at the bottom, Sweden and Denmark are both low.  It’s useful to think about the reasons that people with university degree might have higher incomes

  • Specific training: your degree gives you skills and knowledge that are helpful in your specific occupation
  • General training: a degree gives you transferable skills that are helpful in many occupations
  • Signalling: completing a degree shows employers that you can complete a degree
  • Stratification: higher education is a way for the wealthy to perpetuate their advantages through hiring ‘people like us’ for good  jobs

The first two of these are beneficial to the individual and to society as a whole.  The third may be beneficial to the individual, but not to society as a whole, and the fourth is actively harmful.  Among developed countries, those with low social mobility (such as the UK and the USA) have larger differences in income between those with and without degrees than those with higher social mobility (such as the Scandinavian countries).

This context sheds a different light on one of the comments quoted by the Herald

Employers and Manufacturers Association boss Kim Campbell agreed. People at the top in business weren’t paid anything near what counterparts overseas were getting because we didn’t have the big companies that paid top dollar.

A top-level executive in New Zealand would be lucky to get 10 times the entry-level pay rate, he said. In the US, it was not uncommon to get 200 times that level.

You don’t have to be a raving lefty to be dubious about this as an argument in favour of the US system.
Stat of the Week Competition: September 29 – October 5 2012

Each week, we would like to invite readers of Stats Chat to submit nominations for our Stat of the Week competition and be in with the chance to win an iTunes voucher.

Here’s how it works:

  • Anyone may add a comment on this post to nominate their Stat of the Week candidate before midday Friday October 5 2012.
  • Statistics can be bad, exemplary or fascinating.
  • The statistic must be in the NZ media during the period of September 29 – October 5 2012 inclusive.
  • Quote the statistic, when and where it was published and tell us why it should be our Stat of the Week.

Next Monday at midday we’ll announce the winner of this week’s Stat of the Week competition, and start a new one.

(more…)

September 28, 2012

Coincidences

There’s a been a lot of coverage around the world of the Oksnes family in Norway: three of them have won significant sums in the lottery, all three at times close to when one family member, Hege Jeanette, was giving birth.

We’ve been asked what the probability was.  This isn’t even really a well-defined question, because it’s hard to say what would count as the same event.  Presumably a different Norwegian family would still count, and probably a Chilean family.  What if the family members won near their own 30th birthdays rather than near the time their child/niece/nephew was born? Or if they’d each won on the day they graduated college? If we can agree on what counts as the same event it’s then hard to work out the probability because we’d need data on number of lottery players all around the world, and on how many of them had children.

There are some things we can compute.  Suppose that there is one lottery prize a week in Norway, and that about 1 million of the country’s 4.9 million people play.  Divide them up into groups of six people.  The chance that three prizes end up in the same group of six people over ten years would be about 1.5 in ten thousand. Extending this to the whole world, it’s pretty likely that three people in the same family have won. That doesn’t cover the pregnancy, which restricts us to three periods of a few weeks in the ten years. Suppose we say that it’s three three-week periods that would give a close enough match.  The chance of all the wins lining up with the births would be about five in a million.  So, if we specified that the coincidence had to be about giving birth, it’s pretty unlikely.

Alternatively, we could ask how likely is it that a coincidence remarkable enough to get reported around the world would happen in a lottery.  The probability of that is pretty high, and we can tell, because lots of unlikely lottery coincidences do get reported.

Finally, we could ask what is the probability that the coincidence was really just due to chance. The answer to this one is easy. 100%.

Visualising health findings

The Cochrane Collaboration are holding their annual conference in Auckland starting on Sunday.  They are a decentralised, grassroots effort to collate and summarise all randomised clinical trials, to make sure that the information isn’t buried, but is available to clinicians and patients.  The online Cochrane Library of Systematic Reviews is available free to anyone in New Zealand, thanks to funding from the DHBs and the Ministry of Health.  As with many organisations, they award a variety of prizes in their field of work.  In contrast to many organizations, one of the prizes is awarded for the best criticism of the organization’s work.

Anyway, the conference is an excuse to link to a video by the Cambridge “Understanding Uncertainty” group.  They are working on animations to further improve the summaries of health findings from the Cochrane systematic reviews.