September 28, 2012

DIY statistics

From a Herald editorial

There is much intolerance of any use of this “ropey” information. A high priesthood of data analysis bemoans news media interest, however hedged with caveats, as betraying the apple in favour of the orange. Yet the combined “wisdom of the crowd” of thousands of schools and teachers, warts and all, does suggest, for example, fewer children meet standards in writing nationally than reading or mathematics.

I, like many people, was against the use of the data for league tables, though I thought it was probably inevitable.  But if the high priesthood of data analysis has issued any edicts on analysis of the data, they forgot to copy me on the email. Perhaps it’s because I wasn’t wearing the high priestly hat.

At StatsChat we’re in favour of more people doing DIY statistics, which is why we keep linking to data sources when newspapers don’t provide them.  As with any form of DIY, though, the results will be better if you have the right materials for the job at hand.

For any given set of data there are some questions that obviously can be answered (do fewer kids meet the writing standards?), and some that obviously can’t (are the writing standards just harder?).   There are also many questions where the results will be unclear because it’s not possible to reliably separate out the huge socioeconomic effects.  For example, it looks as though Maori children perform worse than non-minority children even within the same decile, but ‘within the same decile’ is a pretty broad range of schools, and the conclusion has to be pretty weak.

September 27, 2012

How is the beer up (down) here?

UBS economists have produced a nice graph showing how many minutes does it take to earn a beer. There is one fatal flaw however – it doesn’t have New Zealand! I thought we had better remedy this (maybe I am just avoiding something). The graph takes the average price for 500mL of beer, and divides it by the median hourly wage. The dollar figures, I assume, are all converted to US dollars so that everything is on the same scale. Statistics New Zealand helpfully provides us with the average hourly wage for 2011 – NZD20.38, and pricepint.com uses the power of crowd-sourcing to give us the average price of a pint in New Zealand at GBP2.36. Converting both of these figures in to US dollars gives us USD16.8241 and USD3.82047 respectively at today’s rates from xe.net This means on average it takes 13.62 minutes to earn a pint in New Zealand. There are no figures on the plot, but we seem to sit somewhere between Australia and Argentina, our fellow Rugby Championship competitors, but a long way below South Africa.

Something beginning with ‘A’?

The Herald website front page asks

New Zealand has been allocated 2000 of the 10,000 places available for the 2015 dawn service at Gallipoli – guess which country gets the rest?

The guess isn’t that hard, and the allocation seems pretty fair to NZ.  Australia gets 4 times as many places. It has 4.9 times as many people now, had 5.9 times as many serving in the campaign, and 3.7 2.2 times as many died.

September 26, 2012

Betting on a sure thing

Intrade is a company that hosts betting on political events, to “tap the wisdom of crowds”.  Matthew Yglesias posted the graph below, which shows the difference between the Intrade betting percentage on “Barack Obama wins the presidential election” and “The Democrats win the presidential election”.

The spikes above zero could theoretically just about be rational — if Obama dies before the election, the Democrats could win without Obama winning — although a probability of even 1% of this seems too high.  The spikes below zero imply that Obama wins without the Democrats winning, which really isn’t conceivable.  If you bet against the Democrats winning and in favor of Obama winning (or vice versa) at the right times you could make guaranteed free money.

The problem is that Intrade is small enough that it’s not worth people with lots of money hanging on it trying to exploit minor irrationalities, even for big events like the presidential election, especially when you take transaction costs into account. Betting markets tend not to leave $20 notes lying on the table, but they can drop the occasional handful of change.


Teaching statistics

I haven’t had the time or energy to do any analyses of the National Standards data, but other statistical bloggers haven’t had the same problem.

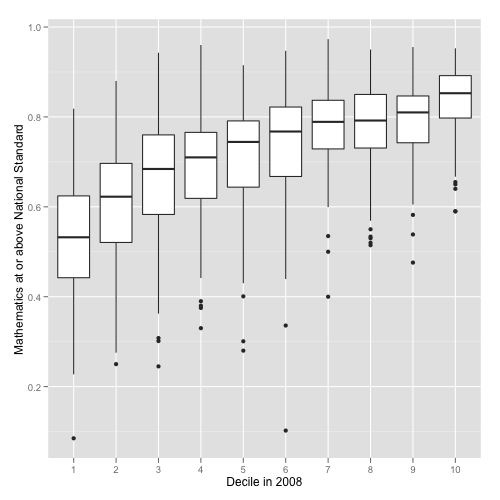
Luis Apiolaza has some dramatic graphics, such as this one showing the distribution of proportion achieving at or above the maths standard, by decile.  The top decile 1 school is below the median for deciles 9 and 10, and the upper quartile for decile 1 is about the same as the lower quartile for decile 4.

Eric Crampton has been doing regression modelling. He’s using Stata rather than R and has fewer pictures, because he’s an economist (but we like him anyway).

Eric comments on the strong decile differences, and notes that these make it hard to be confident about ethnic differences (schools with more Maori and Pacific students do worse, but on reading and perhaps on writing so do schools with more Asian students).  He also notes that there’s a lot of variation between schools that isn’t explained by the available socioeconomic data.  I’d be interested to know how much of this is random variation based on the limited number of students per school and how much is real variation that could be explained but isn’t.

Both Eric and Luis have put their data files and code where anyone else can easily get them, and they have left the data in much better shape than they found them, for the benefit of anyone else who might want to do some analysis.

NRL Predictions, Grand Final

Team Ratings for the Grand Final

Here are the team ratings prior to the Grand Final, along with the ratings at the start of the season. I have created a brief description of the method I use for predicting rugby games. Go to my Department home page to see this.

Current Rating Rating at Season Start Difference
Bulldogs 8.55 -1.86 10.40
Storm 7.63 4.63 3.00
Cowboys 6.35 -1.32 7.70
Sea Eagles 4.66 9.83 -5.20
Rabbitohs 4.48 0.04 4.40
Raiders 1.12 -8.40 9.50
Knights 0.01 0.77 -0.80
Dragons -0.37 4.36 -4.70
Broncos -0.98 5.57 -6.50
Sharks -2.05 -7.97 5.90
Titans -2.20 -11.80 9.60
Wests Tigers -2.74 4.52 -7.30
Roosters -5.43 0.25 -5.70
Panthers -6.45 -3.40 -3.00
Warriors -8.08 5.28 -13.40
Eels -8.25 -4.23 -4.00


Performance So Far

So far there have been 200 matches played, 123 of which were correctly predicted, a success rate of 61.5%.

Here are the predictions for last week’s games.

Game Date Score Prediction Correct
1 Storm vs. Sea Eagles Sep 21 40 – 12 3.56 TRUE
2 Bulldogs vs. Rabbitohs Sep 22 32 – 8 0.27 TRUE


Prediction for the Grand Final

Here is my prediction for the Grand Final.

Game Date Winner Prediction
1 Bulldogs vs. Storm Sep 30 Bulldogs 5.40


September 24, 2012

Stat of the Week Winner: September 15-21 2012

Thanks for your nominations last week in our Stat of the Week competition. We’ve selected Alan Keegan’s nomination of car theft data which doesn’t take into consideration the number of vehicles when considering the likelihood of them being stolen.

(Thanks Brent for noticing the date typo in the competition, which has now been corrected. We’d like to think that Stats Chat is not about pointing out others’ typos or mistakes, but intelligently discussing the statistics behind the news and the issues surrounding them.)

Data Science in Harvard Business Review

They say it’s the sexiest job of the 21st century.  Perhaps if people are calling statistics “data science” they will stop calling it “business intelligence” (via)

Stat of the Week Competition: September 22 – 28 2012

Each week, we would like to invite readers of Stats Chat to submit nominations for our Stat of the Week competition and be in with the chance to win an iTunes voucher.

Here’s how it works:

  • Anyone may add a comment on this post to nominate their Stat of the Week candidate before midday Friday September 28 2012.
  • Statistics can be bad, exemplary or fascinating.
  • The statistic must be in the NZ media during the period of September 22 – 28 2012 inclusive.
  • Quote the statistic, when and where it was published and tell us why it should be our Stat of the Week.

Next Monday at midday we’ll announce the winner of this week’s Stat of the Week competition, and start a new one.

(more…)

September 23, 2012

A mathematician, an economist, and a tango dancer walk into a bar

….and the bartender asks them if they need help setting up for their talks.

The second episode of Nerdnite Auckland is on Tuesday October 2, at Nectar, in Kingsland (if you have trouble finding it, it’s upstairs, above the Kingslander). Presumably it starts at closer to 6:30 this time, since the bugs should have been worked out of the system.

Also, on Wednesday September 26, Cafe Scientifique is on at the Horse and Trap, with Gillian Turner, from Vic Uni Wellington, talking: “Flips and Wiggles — the mystery of Earth’s magnetism”.  They recommend arriving at 6ish for a 6:30 start to the formalities.