March 27, 2012

Heart disease is bad for your sleep

Another heart-disease related story in the Herald (the American College of Cardiology is having its annual meeting now) talks about a link between sleep  and heart disease.  The Herald quotes the principal investigator, Rohit Arora

We now have an indication that sleep can impact heart health, and it should be a priority.

Based on these findings, it seems getting six to eight hours of sleep everyday probably confers the least risk for cardiovascular disease over the long term.

The study actually looked backwards in time, asking people how much sleep they (currently) get per night, and whether they have previously been diagnosed with various heart conditions.  So, it really doesn’t say much about the effect of sleep on heart disease.  Other news sources used a different quote from Dr Arora

“We don’t know whether sleeping longer causes heart complications or whether the heart problems cause someone to sleep longer”

Indeed we don’t.

It’s also a bit strange that the study, based on the large US NHANES survey involved only 3019 people.  NHANES examines more than 10000 people in each two-year wave, and even restricting to people over 45 should leave more than 3000 of them.
Some more good news

The Herald has a story today about weight-loss surgery and Type II diabetes.  They say that two studies reported improvements in blood sugar control in people having the surgery, with complete remission of diabetes in some.    The story tells you where the research was published, and even has a comment from an independent researcher.  The only thing it misses is that it doesn’t come out and say that the studies were randomized: patients were randomly allocated to surgical or medical treatment, so the results are highly credible.

The two papers and a commentary are (currently) free-access at the New England Journal of Medicine, so you can even read the evidence for yourself.

Better than nothing

Our helpful commenters provided alternative suggestions on how the intersection car crash rates could have been standardised, instead of using population of each region

Number of registered vehicles is a bit of a pain, because it is reported for postal districts, not for regions.  I assumed that postal districts are a partition of regions (I couldn’t confirm or deny this immediately), and did a bit of Wikipedia. Presumably an NZ journalist could do this quicker than me, and would already know, for example, that the Canterbury:Otago border passes between Timaru and Oamaru.

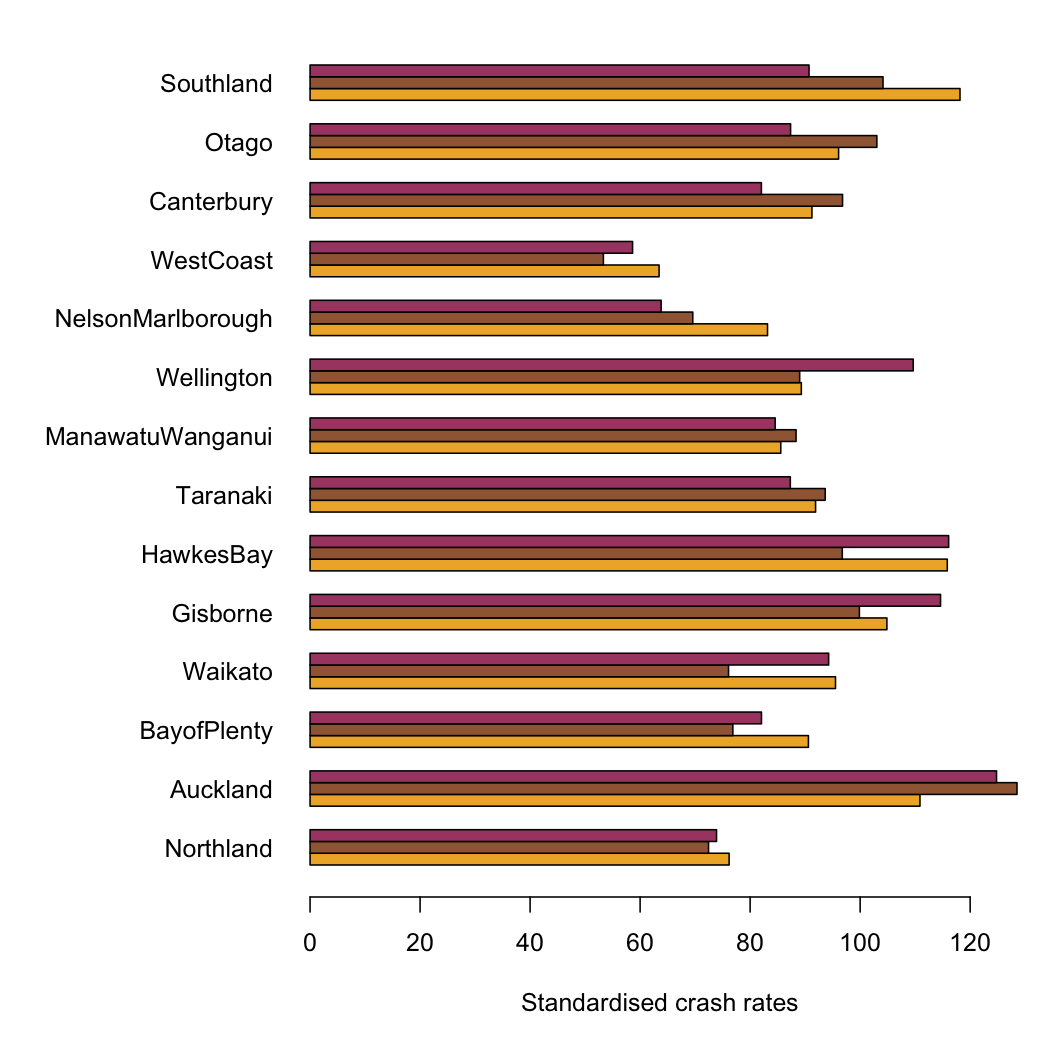
It doesn’t matter a lot which standardisation you use.  The graph below (click to embiggen) shows all three, scaled so NZ as a whole is 100.  The orange bars are by population, the brown bars by km, and the maroon bars by registered vehicles.  The most striking difference is probably for Wellington, where the rate per registered vehicle is high: there are fewer registered vehicles per capita than in the rest of the country.

All three versions confirm that there is much less variation than the Herald story would suggest, and that  urbanisation is likely responsible.  Error bars would be nice, but I don’t know what the uncertainties in the NZTA denominators are like.

March 26, 2012

Student drinking

A story in Stuff about student drinking at Otago illustrates an important problem with surveys.  According to the story, the students drank on average two nights a week, and consumed 7.2 drinks per night of drinking.  That gives an average of about two drinks per day, which is about the same as average for the whole country based on total alcohol sales.

I don’t know about you, but I find this a little hard to believe. The newspapers should find it even harder to believe, since it contradicts their usual line about Otago students.

My guess is that Otago students do drink a bit more than the average Kiwi, but that asking people to report their drinking leads to underreporting compared to looking at total sales.  There could be several reasons.  One is that people might not want to admit how much they drink, another is that there may be difficulties in converting actual glass sizes into standard doses, and a third is that people’s “average week” is usually different from their actual week.  Perhaps you `usually’ drink less, but this week was Sam’s birthday and you drank more.  And last week was the keg party. And before that was the start of semester. And so on.

That’s not the point of the story, though.  The point is that new research finds heavy drinking can make you feel unwell and have difficulty concentrating even the next day;  the effects seem to hang over and affect your daily activities. Perhaps someone could come up with a catchy name for this phenomenon…

Auckland is still bigger than Wellington

According to the Herald,

Figures compiled from 2006 to 2010 show, on average, Auckland makes up about one third of all intersection crashes around the country.

 They don’t say how they are defining “Auckland”, but since the comparisons are with Canterbury and Wellington, it looks like the Auckland Region is what they mean.  The Auckland region has 1/3 of the country’s population and just over 1/3 of the crashes.   Canterbury, with 13% of the population, had 12% of the crashes.
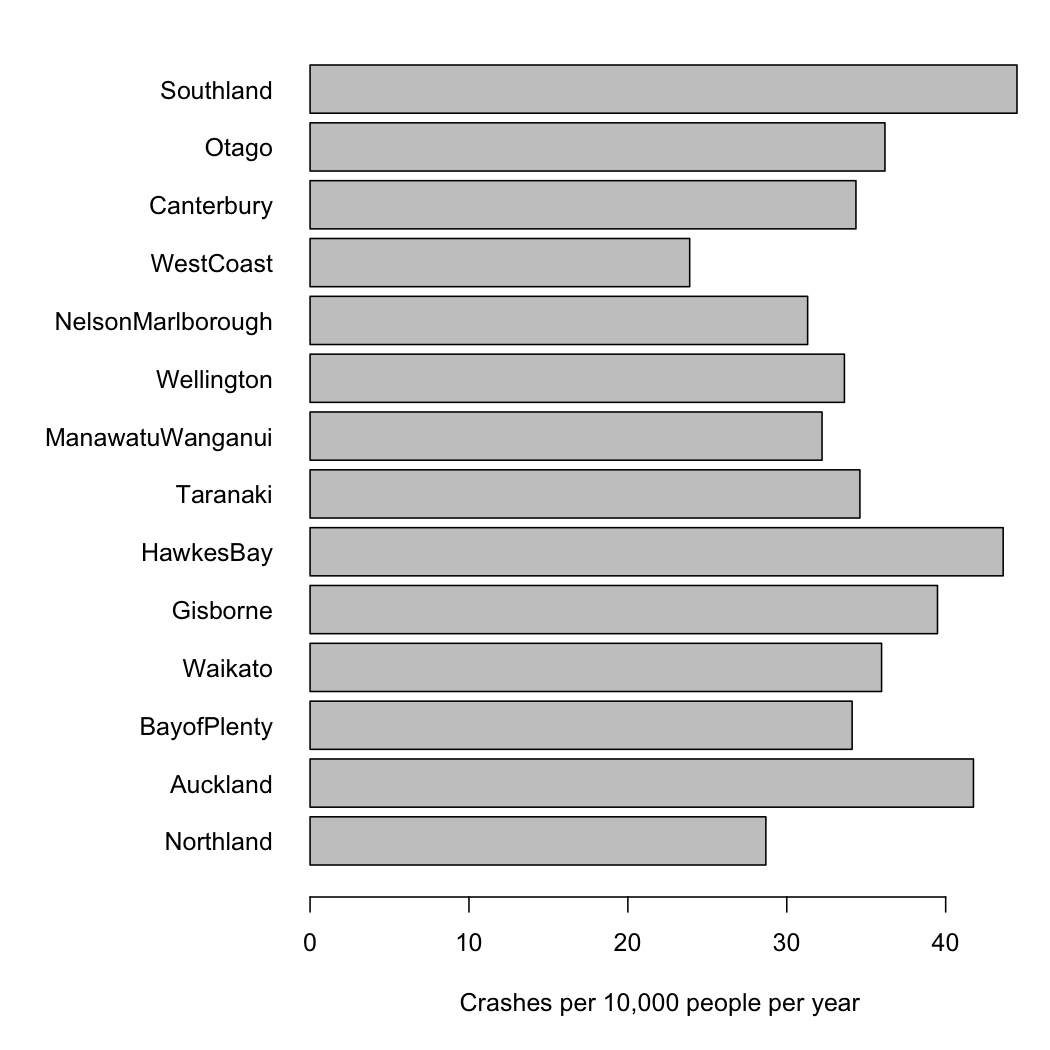
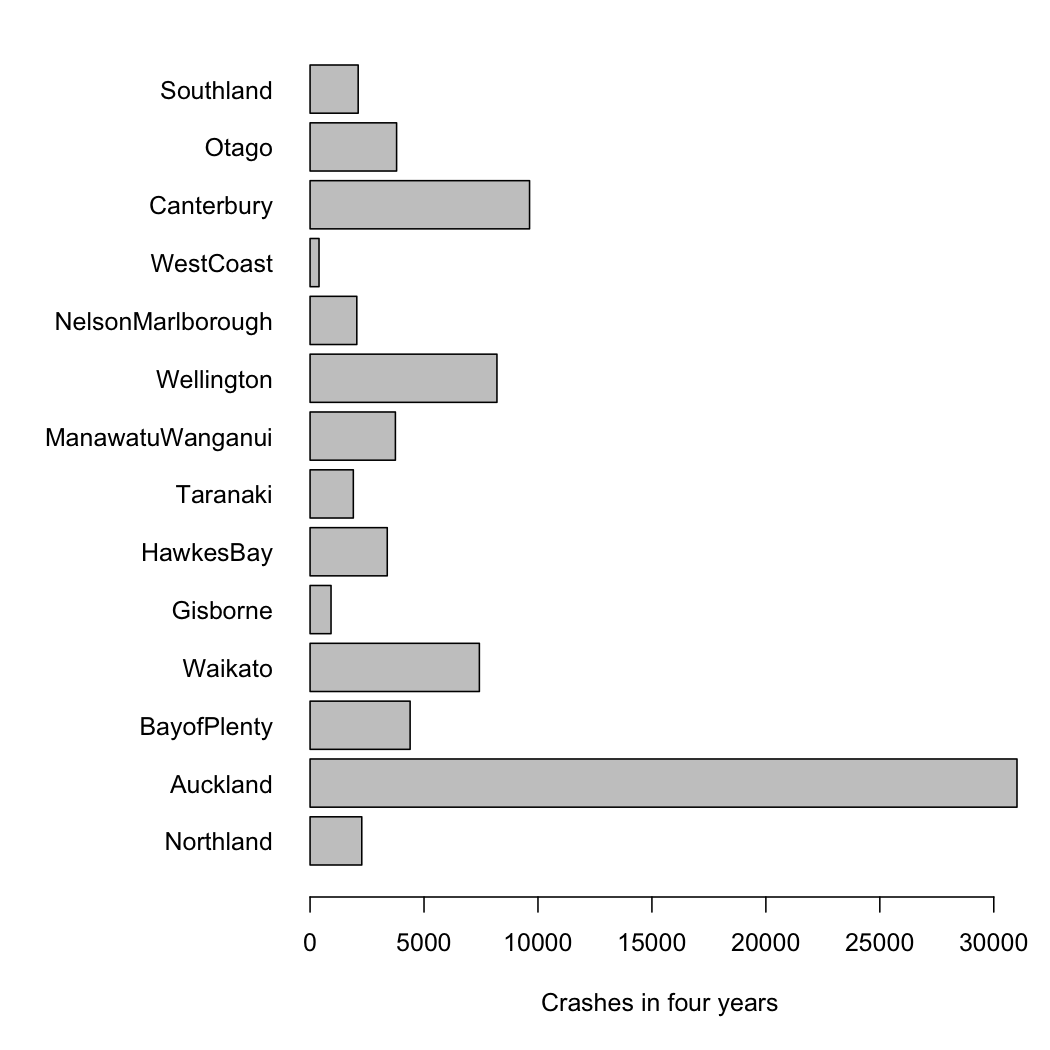
Failing to divide by population size makes it impossible to see any real variations between regions.  For example, you would expect more intersection crashes in more urbanised regions and it would be interesting to see how big this effect is.   The first graph is what the Herald is telling you, total intersection crashs over five years (with more complete data from NZTA).

The variation between regions is almost all due to differences in population, and so doesn’t tell us anything we didn’t already know. The second graph is intersection crashes per year, per 10000 population, which might actually be useful.

Even better would be a graph that indicated the uncertainties, but I don’t have time right now.

NZTA, whose press release is responsible for the story, says

The NZ Transport Agency (NZTA) is providing media organisations with background data on intersection crashes in New Zealand to assist with coverage of the implementation of new give way rules which come into force at 5am on Sunday 25 March.

It probably did assist in getting stories into the paper.  Unfortunately, the story didn’t emphasize what they wanted, which is that intersection crashes are common.  The story tried to do a comparison — as the old journalism rule says, “when you have two numbers, do something with them”. Unfortunately, they divided the wrong two numbers.

Stat of the Week Winner: March 17-23 2012

Thank you for all the nominations, however no winner was awarded this week.

Stat of the Week Competition: March 24-30 2012

Each week, we would like to invite readers of Stats Chat to submit nominations for our Stat of the Week competition and be in with the chance to win an iTunes voucher.

Here’s how it works:

  • Anyone may add a comment on this post to nominate their Stat of the Week candidate before midday Friday March 30 2012.
  • Statistics can be bad, exemplary or fascinating.
  • The statistic must be in the NZ media during the period of March 24-30 2012 inclusive.
  • Quote the statistic, when and where it was published and tell us why it should be our Stat of the Week.

Next Monday at midday we’ll announce the winner of this week’s Stat of the Week competition, and start a new one.

(more…)

March 25, 2012

Best flop ever

The Herald asks “Is John Carter the biggest flop of all time?”

While there isn’t an official definition of `flop’, it’s worth noting that John Carter has grossed $184 million in two weeks.  That’s quite a lot of money. For example, it’s more than the first Harry Potter movie managed.

March 23, 2012

NRL Predictions, Round 4

Team Ratings for Round 4

Here are the team ratings prior to Round 4, along with the ratings at the start of the season. I have created a brief description of the method I use for predicting rugby games. Go to my Department home page to see this.

Current Rating Rating at Season Start
Sea Eagles 8.45 9.83
Broncos 5.98 5.57
Storm 5.78 4.63
Dragons 4.03 4.36
Warriors 3.84 5.28
Bulldogs 3.02 -1.86
Wests Tigers 2.16 4.52
Rabbitohs 0.57 0.04
Knights 0.15 0.77
Cowboys -0.35 -1.32
Roosters -1.63 0.25
Panthers -3.62 -3.40
Sharks -6.18 -7.97
Raiders -6.55 -8.40
Eels -7.92 -4.23
Titans -11.47 -11.80


Performance So Far

So far there have been 24 matches played, 12 of which were correctly predicted, a success rate of 50%.
Here are the predictions for the games so far.

Game Date Score Prediction Correct
1 Knights vs. Dragons Mar 01 14 – 15 0.91 FALSE
2 Eels vs. Broncos Mar 02 6 – 18 -5.30 TRUE
3 Raiders vs. Storm Mar 03 19 – 24 -8.53 TRUE
4 Panthers vs. Bulldogs Mar 03 14 – 22 2.96 FALSE
5 Cowboys vs. Titans Mar 03 0 – 18 14.98 FALSE
6 Warriors vs. Sea Eagles Mar 04 20 – 26 -0.05 TRUE
7 Wests Tigers vs. Sharks Mar 04 17 – 16 16.99 TRUE
8 Rabbitohs vs. Roosters Mar 05 20 – 24 4.29 FALSE
9 Sea Eagles vs. Wests Tigers Mar 09 22 – 18 11.56 TRUE
10 Broncos vs. Cowboys Mar 09 26 – 28 14.56 FALSE
11 Titans vs. Raiders Mar 10 12 – 24 3.45 FALSE
12 Bulldogs vs. Dragons Mar 10 30 – 4 -0.99 FALSE
13 Sharks vs. Knights Mar 11 6 – 18 -2.81 TRUE
14 Roosters vs. Panthers Mar 11 0 – 18 9.69 FALSE
15 Storm vs. Rabbitohs Mar 11 24 – 10 9.47 TRUE
16 Eels vs. Warriors Mar 12 20 – 36 -5.07 TRUE
17 Dragons vs. Wests Tigers Mar 16 36 – 12 3.01 TRUE
18 Knights vs. Broncos Mar 16 10 – 24 1.08 FALSE
19 Titans vs. Storm Mar 17 6 – 30 -10.61 TRUE
20 Cowboys vs. Eels Mar 17 42 – 6 7.51 TRUE
21 Warriors vs. Bulldogs Mar 18 18 – 32 9.00 FALSE
22 Roosters vs. Raiders Mar 18 14 – 8 10.08 TRUE
23 Panthers vs. Rabbitohs Mar 18 24 – 40 3.42 FALSE
24 Sharks vs. Sea Eagles Mar 19 17 – 14 -12.62 FALSE

Predictions for Round 4

Here are the predictions for Round 4

Game Date Winner Prediction
1 Eels vs. Panthers Mar 23 Eels 0.20
2 Rabbitohs vs. Broncos Mar 23 Broncos -0.90
3 Warriors vs. Titans Mar 24 Warriors 19.80
4 Dragons vs. Sea Eagles Mar 24 Dragons 0.10
5 Cowboys vs. Sharks Mar 24 Cowboys 10.30
6 Storm vs. Roosters Mar 25 Storm 11.90
7 Bulldogs vs. Knights Mar 25 Bulldogs 7.40
8 Wests Tigers vs. Raiders Mar 26 Wests Tigers 13.20


Super 15 Predictions, Week 5

Team Ratings for Week 5

Here are the team ratings prior to Week 5, along with the ratings at the start of the season. I have created a brief description of the method I use for predicting rugby games. Go to my Department home page to see this.

Current Rating Rating at Season Start Difference
Crusaders 7.65 10.46 -2.80
Stormers 6.23 6.59 -0.40
Bulls 5.17 4.16 1.00
Reds 3.10 5.03 -1.90
Blues 2.79 2.87 -0.10
Waratahs 2.72 4.98 -2.30
Sharks 1.51 0.87 0.60
Chiefs 0.23 -1.17 1.40
Hurricanes -0.49 -1.90 1.40
Highlanders -2.41 -5.69 3.30
Cheetahs -4.21 -1.46 -2.70
Force -5.16 -4.95 -0.20
Brumbies -6.42 -6.66 0.20
Lions -9.78 -10.82 1.00
Rebels -14.22 -15.64 1.40


Performance So Far

So far there have been 27 matches played, 16 of which were correctly predicted, a success rate of 59.3%.
Here are the predictions for last week’s games.

Game Date Score Prediction Correct
1 Chiefs vs. Brumbies Mar 16 29 – 22 11.90 TRUE
2 Stormers vs. Blues Mar 16 27 – 17 7.50 TRUE
3 Hurricanes vs. Highlanders Mar 17 17 – 19 8.00 FALSE
4 Waratahs vs. Force Mar 17 20 – 21 14.90 FALSE
5 Sharks vs. Reds Mar 17 27 – 22 2.50 TRUE
6 Rebels vs. Cheetahs Mar 18 26 – 33 -5.20 TRUE


Predictions for Week 5

Here are the predictions for Week 5. The prediction is my estimated points difference with a positive margin being a win to the home team, and a negative margin a win to the away team.

Game Date Winner Prediction
1 Blues vs. Hurricanes Mar 23 Blues 7.80
2 Rebels vs. Force Mar 23 Force -4.60
3 Waratahs vs. Sharks Mar 24 Waratahs 5.70
4 Crusaders vs. Cheetahs Mar 24 Crusaders 16.40
5 Brumbies vs. Highlanders Mar 24 Brumbies 0.50
6 Bulls vs. Reds Mar 24 Bulls 6.60
7 Lions vs. Stormers Mar 24 Stormers -11.50