March 23, 2021

Rugby Premiership Predictions for Round 15

Team Ratings for Round 15

The basic method is described on my Department home page.
Here are the team ratings prior to this week’s games, along with the ratings at the start of the season.

Current Rating Rating at Season Start Difference
Exeter Chiefs 6.55 7.35 -0.80
Bristol 4.32 1.28 3.00
Sale Sharks 3.94 4.96 -1.00
Harlequins 3.85 -1.08 4.90
Wasps -0.54 5.66 -6.20
Bath -0.95 2.14 -3.10
Northampton Saints -1.50 -2.48 1.00
Leicester Tigers -4.25 -6.14 1.90
Gloucester -4.29 -1.02 -3.30
London Irish -5.82 -8.05 2.20
Newcastle Falcons -6.94 -10.00 3.10
Worcester Warriors -7.46 -5.71 -1.70


Performance So Far

So far there have been 77 matches played, 47 of which were correctly predicted, a success rate of 61%.
Here are the predictions for last week’s games.

Game Date Score Prediction Correct
1 Bath vs. Worcester Warriors Mar 21 47 – 22 9.40 TRUE
2 Exeter Chiefs vs. Leicester Tigers Mar 21 47 – 31 15.20 TRUE
3 Harlequins vs. Gloucester Mar 21 59 – 24 10.20 TRUE
4 Newcastle Falcons vs. Wasps Mar 21 18 – 20 -1.90 TRUE
5 Northampton Saints vs. Bristol Mar 21 21 – 28 -0.50 TRUE
6 Sale Sharks vs. London Irish Mar 21 41 – 13 12.60 TRUE


Predictions for Round 15

Here are the predictions for Round 15. The prediction is my estimated expected points difference with a positive margin being a win to the home team, and a negative margin a win to the away team.

Game Date Winner Prediction
1 Bristol vs. Harlequins Mar 28 Bristol 5.00
2 Gloucester vs. Exeter Chiefs Mar 27 Exeter Chiefs -6.30
3 Leicester Tigers vs. Newcastle Falcons Mar 29 Leicester Tigers 7.20
4 London Irish vs. Bath Mar 28 Bath -0.40
5 Wasps vs. Sale Sharks Mar 28 Wasps 0.00
6 Worcester Warriors vs. Northampton Saints Mar 28 Northampton Saints -1.50


Pro14 Predictions for the Final and Postponed Matches

Team Ratings for the Final and Postponed Matches

The basic method is described on my Department home page.
Here are the team ratings prior to this week’s games, along with the ratings at the start of the season.

Current Rating Rating at Season Start Difference
Leinster 15.68 16.52 -0.80
Munster 9.76 9.90 -0.10
Ulster 8.80 4.58 4.20
Edinburgh 3.92 5.49 -1.60
Connacht 2.47 0.70 1.80
Glasgow Warriors 2.11 5.66 -3.60
Cardiff Blues 0.72 0.08 0.60
Scarlets 0.59 1.98 -1.40
Cheetahs -0.46 -0.46 0.00
Ospreys -0.76 -2.82 2.10
Dragons -6.69 -7.85 1.20
Treviso -6.70 -3.50 -3.20
Zebre -14.52 -15.37 0.80
Southern Kings -14.92 -14.92 0.00


Performance So Far

So far there have been 94 matches played, 63 of which were correctly predicted, a success rate of 67%.
Here are the predictions for last week’s games.

Game Date Score Prediction Correct
1 Munster vs. Treviso Mar 20 31 – 17 23.90 TRUE
2 Leinster vs. Ospreys Mar 20 19 – 24 24.90 FALSE
3 Ulster vs. Zebre Mar 20 49 – 3 28.50 TRUE
4 Dragons vs. Glasgow Warriors Mar 22 26 – 17 -3.30 FALSE
5 Cardiff Blues vs. Edinburgh Mar 23 34 – 15 2.00 TRUE
6 Scarlets vs. Connacht Mar 23 41 – 36 4.50 TRUE


Predictions for the Final and Postponed Matches

Here are the predictions for the Final and Postponed Matches. The prediction is my estimated expected points difference with a positive margin being a win to the home team, and a negative margin a win to the away team.

Game Date Winner Prediction
1 Dragons vs. Edinburgh Mar 29 Edinburgh -6.90
2 Glasgow Warriors vs. Treviso Mar 28 Glasgow Warriors 14.90
3 Leinster vs. Munster Mar 28 Leinster 10.90


NRL Predictions for Round 3

Team Ratings for Round 3

The basic method is described on my Department home page.
Here are the team ratings prior to this week’s games, along with the ratings at the start of the season.

Current Rating Rating at Season Start Difference
Roosters 14.11 10.25 3.90
Storm 13.14 14.53 -1.40
Panthers 10.44 8.88 1.60
Rabbitohs 8.14 7.73 0.40
Raiders 7.23 6.98 0.30
Eels 2.71 1.68 1.00
Sharks 0.57 -0.76 1.30
Knights -1.45 -2.61 1.20
Warriors -1.59 -1.84 0.30
Wests Tigers -5.34 -3.07 -2.30
Dragons -5.39 -4.95 -0.40
Sea Eagles -7.04 -4.77 -2.30
Titans -7.37 -7.22 -0.10
Cowboys -9.12 -8.05 -1.10
Bulldogs -9.51 -7.62 -1.90
Broncos -11.52 -11.16 -0.40


Performance So Far

So far there have been 16 matches played, 13 of which were correctly predicted, a success rate of 81.2%.
Here are the predictions for last week’s games.

Game Date Score Prediction Correct
1 Eels vs. Storm Mar 18 16 – 12 -9.90 FALSE
2 Warriors vs. Knights Mar 19 16 – 20 0.70 FALSE
3 Titans vs. Broncos Mar 19 28 – 16 6.10 TRUE
4 Bulldogs vs. Panthers Mar 20 0 – 28 -14.60 TRUE
5 Sea Eagles vs. Rabbitohs Mar 20 12 – 26 -11.70 TRUE
6 Cowboys vs. Dragons Mar 20 18 – 25 0.70 FALSE
7 Wests Tigers vs. Roosters Mar 21 6 – 40 -12.80 TRUE
8 Sharks vs. Raiders Mar 21 10 – 12 -4.10 TRUE


Predictions for Round 3

Here are the predictions for Round 3. The prediction is my estimated expected points difference with a positive margin being a win to the home team, and a negative margin a win to the away team.

Game Date Winner Prediction
1 Panthers vs. Storm Mar 25 Panthers 0.30
2 Dragons vs. Sea Eagles Mar 26 Dragons 4.70
3 Rabbitohs vs. Roosters Mar 26 Roosters -3.00
4 Raiders vs. Warriors Mar 27 Raiders 11.80
5 Broncos vs. Bulldogs Mar 27 Broncos 1.00
6 Eels vs. Sharks Mar 27 Eels 5.10
7 Knights vs. Wests Tigers Mar 28 Knights 6.90
8 Cowboys vs. Titans Mar 28 Cowboys 1.20


March 22, 2021

Prior beliefs and evidence

Remember the bin lid?

Case C tested positive in MIQ at their day-12 test. They had a room next door to D and D’s child, E. D is the person who was initially thought to have been infected by touching a bin lid that C had also touched some 20 hours before.

There’s now a published paper by Jemma Geohegan and numerous co-workers, and Siouxsie Wiles has an explainer at the Spinoff:

Now we know that SARS-CoV-2 is airborne, a much more likely scenario is that case D was infected by exposure to airborne virus shed by case C. 

CCTV footage showed that C and D were never outside their MIQ rooms at the same time. But they both got their day 12 swabs taken on the same day. And these were taken from their doorways. C was tested first. Then there was a 50-second window between them closing their door and D opening theirs to be swabbed. It looks like having the hotel room doors open for as long as it took to be swabbed was enough to move airborne virus from C and their room into the enclosed and unventilated corridor and then on to D and into their room. From the genome sequencing, it looks like D then infected their child, E, and another household member, F. 

This might seem strange: we know there was a contaminated bin lid, and the opportunity for airborne* transmission was pretty marginal, so why are we concluding it was airborne*?

Back last year, scientists and public health people worked on the assumption that the Covid virus could spread via contaminated surfaces, because lots of microbes do and it’s a relatively easy fix.  Some of us went as far as washing individual tomatoes when we got them back from the supermarket.  It became clear fairly quickly that airborne*  transmission was important; there were some smoking-gun examples that couldn’t be explained any other way.  It took a lot longer to decide that contaminated surfaces were pretty much never important, because most cases that could have been surface transmission could also have been airborne* transmission. Still, there were no smoking-gun cases of transmission by contaminated surfaces, and you’d expect a few unless it was very rare.

As the numbers of active infections rose, it became harder to track down causes for any individual case.  Except, in New Zealand, it didn’t.  Since the end of the first outbreak we have had a very small number of cases, small enough that contact tracing and genome sequencing is possible for every person involved, plus the sort of hotel surveillance that’s unusual in the public sector outside prisons.  Here, it is possible to track most individual transmissions. So, the ‘bin lid’ case was interesting because it looked like an unambiguous case of transmission from a contaminated surface.

What we know now is that it wasn’t. That is, it wasn’t an unambiguous case of transmission from a contaminated surface; it could have been airborne*  transmission.  The ‘bin lid’ case

  • definitely isn’t the smoking gun for surface transmission that it first appeared
  • and so, based on everything else we know, probably was airborne*  transmission

It’s not that we have strong evidence for airborne*  transmission from the facts of this specific case, but we don’t have strong evidence against it, and other evidence definitely points that way.


* for some definition of the word, let’s not be dicks about it.

March 16, 2021

Top 14 Predictions for Round 20

Team Ratings for Round 20

The basic method is described on my Department home page.
Here are the team ratings prior to this week’s games, along with the ratings at the start of the season.

Current Rating Rating at Season Start Difference
Stade Toulousain 8.90 4.80 4.10
Clermont Auvergne 6.67 3.22 3.50
Racing-Metro 92 6.08 6.21 -0.10
La Rochelle 5.72 2.32 3.40
Bordeaux-Begles 4.07 2.83 1.20
Lyon Rugby 4.01 5.61 -1.60
RC Toulonnais 3.41 3.56 -0.20
Montpellier 1.37 2.30 -0.90
Stade Francais Paris -0.67 -3.22 2.60
Castres Olympique -1.06 -0.47 -0.60
Brive -3.08 -3.26 0.20
Section Paloise -3.69 -4.48 0.80
Aviron Bayonnais -6.73 -4.13 -2.60
SU Agen -14.44 -4.72 -9.70


Performance So Far

So far there have been 133 matches played, 89 of which were correctly predicted, a success rate of 66.9%.
Here are the predictions for last week’s games.

Game Date Score Prediction Correct
1 Aviron Bayonnais vs. SU Agen Mar 14 48 – 20 12.20 TRUE


Predictions for Round 20

Here are the predictions for Round 20. The prediction is my estimated expected points difference with a positive margin being a win to the home team, and a negative margin a win to the away team.

Game Date Winner Prediction
1 Aviron Bayonnais vs. Racing-Metro 92 Mar 28 Racing-Metro 92 -7.30
2 Bordeaux-Begles vs. La Rochelle Mar 28 Bordeaux-Begles 3.80
3 Brive vs. SU Agen Mar 28 Brive 16.90
4 Castres Olympique vs. Section Paloise Mar 28 Castres Olympique 8.10
5 Lyon Rugby vs. RC Toulonnais Mar 28 Lyon Rugby 6.10
6 Stade Francais Paris vs. Clermont Auvergne Mar 28 Clermont Auvergne -1.80
7 Stade Toulousain vs. Montpellier Mar 28 Stade Toulousain 13.00


Super Rugby Predictions for Week 5

Team Ratings for Week 5

The basic method is described on my Department home page.
Here are the team ratings prior to this week’s games, along with the ratings at the start of the season.

Current Rating Rating at Season Start Difference
Crusaders 15.41 14.49 0.90
Blues 8.85 7.80 1.10
Hurricanes 6.15 7.13 -1.00
Chiefs 3.69 4.38 -0.70
Brumbies 2.91 1.47 1.40
Highlanders 2.39 2.70 -0.30
Reds 2.29 1.59 0.70
Rebels -3.59 -3.51 -0.10
Waratahs -7.36 -5.02 -2.30
Western Force -12.76 -13.05 0.30


Performance So Far

So far there have been 14 matches played, 10 of which were correctly predicted, a success rate of 71.4%.
Here are the predictions for last week’s games.

Game Date Score Prediction Correct
1 Western Force vs. Rebels Mar 12 7 – 10 -3.80 TRUE
2 Crusaders vs. Chiefs Mar 13 39 – 17 16.60 TRUE
3 Brumbies vs. Reds Mar 13 38 – 40 6.80 FALSE
4 Blues vs. Highlanders Mar 14 39 – 17 11.20 TRUE


Predictions for Week 5

Here are the predictions for Week 5. The prediction is my estimated expected points difference with a positive margin being a win to the home team, and a negative margin a win to the away team.

Game Date Winner Prediction
1 Rebels vs. Waratahs Mar 19 Rebels 9.30
2 Hurricanes vs. Chiefs Mar 20 Hurricanes 8.00
3 Reds vs. Western Force Mar 20 Reds 20.50
4 Blues vs. Crusaders Mar 21 Crusaders -1.10


Rugby Premiership Predictions for Round 14

Team Ratings for Round 14

The basic method is described on my Department home page.
Here are the team ratings prior to this week’s games, along with the ratings at the start of the season.

Current Rating Rating at Season Start Difference
Exeter Chiefs 6.48 7.35 -0.90
Bristol 3.93 1.28 2.60
Sale Sharks 3.13 4.96 -1.80
Harlequins 2.62 -1.08 3.70
Wasps -0.55 5.66 -6.20
Northampton Saints -1.11 -2.48 1.40
Bath -1.78 2.14 -3.90
Gloucester -3.06 -1.02 -2.00
Leicester Tigers -4.19 -6.14 1.90
London Irish -5.01 -8.05 3.00
Worcester Warriors -6.63 -5.71 -0.90
Newcastle Falcons -6.93 -10.00 3.10


Performance So Far

So far there have been 71 matches played, 41 of which were correctly predicted, a success rate of 57.7%.
Here are the predictions for last week’s games.

Game Date Score Prediction Correct
1 Bristol vs. Wasps Mar 13 37 – 20 7.90 TRUE
2 Exeter Chiefs vs. Harlequins Mar 14 21 – 20 9.30 TRUE
3 Gloucester vs. Leicester Tigers Mar 14 14 – 20 7.00 FALSE
4 London Irish vs. Worcester Warriors Mar 15 20 – 17 6.70 TRUE
5 Newcastle Falcons vs. Bath Mar 14 19 – 38 1.40 FALSE
6 Northampton Saints vs. Sale Sharks Mar 14 17 – 14 -0.30 FALSE


Predictions for Round 14

Here are the predictions for Round 14. The prediction is my estimated expected points difference with a positive margin being a win to the home team, and a negative margin a win to the away team.

Game Date Winner Prediction
1 Bath vs. Worcester Warriors Mar 21 Bath 9.40
2 Exeter Chiefs vs. Leicester Tigers Mar 21 Exeter Chiefs 15.20
3 Harlequins vs. Gloucester Mar 21 Harlequins 10.20
4 Newcastle Falcons vs. Wasps Mar 21 Wasps -1.90
5 Northampton Saints vs. Bristol Mar 21 Bristol -0.50
6 Sale Sharks vs. London Irish Mar 21 Sale Sharks 12.60


Pro14 Predictions for Round 16

Team Ratings for Round 16

The basic method is described on my Department home page.
Here are the team ratings prior to this week’s games, along with the ratings at the start of the season.

Current Rating Rating at Season Start Difference
Leinster 16.65 16.52 0.10
Munster 10.20 9.90 0.30
Ulster 8.13 4.58 3.50
Edinburgh 4.58 5.49 -0.90
Glasgow Warriors 2.63 5.66 -3.00
Connacht 2.52 0.70 1.80
Scarlets 0.55 1.98 -1.40
Cardiff Blues 0.06 0.08 -0.00
Cheetahs -0.46 -0.46 0.00
Ospreys -1.73 -2.82 1.10
Treviso -7.15 -3.50 -3.60
Dragons -7.21 -7.85 0.60
Zebre -13.85 -15.37 1.50
Southern Kings -14.92 -14.92 0.00


Performance So Far

So far there have been 88 matches played, 59 of which were correctly predicted, a success rate of 67%.
Here are the predictions for last week’s games.

Game Date Score Prediction Correct
1 Zebre vs. Leinster Mar 13 31 – 48 -25.50 TRUE
2 Glasgow Warriors vs. Ospreys Mar 13 30 – 25 12.10 TRUE
3 Munster vs. Scarlets Mar 13 28 – 10 15.70 TRUE
4 Connacht vs. Edinburgh Mar 14 14 – 15 5.60 FALSE
5 Dragons vs. Ulster Mar 14 22 – 26 -9.90 TRUE
6 Treviso vs. Cardiff Blues Mar 15 14 – 29 0.50 FALSE


Predictions for Round 16

Here are the predictions for Round 16. The prediction is my estimated expected points difference with a positive margin being a win to the home team, and a negative margin a win to the away team.

Game Date Winner Prediction
1 Munster vs. Treviso Mar 20 Munster 23.90
2 Leinster vs. Ospreys Mar 20 Leinster 24.90
3 Ulster vs. Zebre Mar 20 Ulster 28.50
4 Dragons vs. Glasgow Warriors Mar 22 Glasgow Warriors -3.30
5 Cardiff Blues vs. Edinburgh Mar 23 Cardiff Blues 2.00
6 Scarlets vs. Connacht Mar 23 Scarlets 4.50


NRL Predictions for Round 2

Team Ratings for Round 2

The basic method is described on my Department home page.
Here are the team ratings prior to this week’s games, along with the ratings at the start of the season.

Current Rating Rating at Season Start Difference
Storm 14.35 14.53 -0.20
Roosters 12.29 10.25 2.00
Panthers 9.26 8.88 0.40
Rabbitohs 7.91 7.73 0.20
Raiders 7.43 6.98 0.50
Eels 1.50 1.68 -0.20
Sharks 0.37 -0.76 1.10
Warriors -1.15 -1.84 0.70
Knights -1.89 -2.61 0.70
Wests Tigers -3.53 -3.07 -0.50
Dragons -6.08 -4.95 -1.10
Sea Eagles -6.81 -4.77 -2.00
Titans -7.91 -7.22 -0.70
Bulldogs -8.34 -7.62 -0.70
Cowboys -8.43 -8.05 -0.40
Broncos -10.97 -11.16 0.20


Performance So Far

So far there have been 8 matches played, 8 of which were correctly predicted, a success rate of 100%.
Here are the predictions for last week’s games.

Game Date Score Prediction Correct
1 Storm vs. Rabbitohs Mar 11 26 – 18 9.80 TRUE
2 Knights vs. Bulldogs Mar 12 32 – 16 8.00 TRUE
3 Broncos vs. Eels Mar 12 16 – 24 -9.80 TRUE
4 Warriors vs. Titans Mar 13 19 – 6 5.40 TRUE
5 Roosters vs. Sea Eagles Mar 13 46 – 4 18.00 TRUE
6 Panthers vs. Cowboys Mar 13 24 – 0 19.90 TRUE
7 Raiders vs. Wests Tigers Mar 14 30 – 12 13.00 TRUE
8 Dragons vs. Sharks Mar 14 18 – 32 -1.20 TRUE


Predictions for Round 2

Here are the predictions for Round 2. The prediction is my estimated expected points difference with a positive margin being a win to the home team, and a negative margin a win to the away team.

Game Date Winner Prediction
1 Eels vs. Storm Mar 18 Storm -9.90
2 Warriors vs. Knights Mar 19 Warriors 0.70
3 Titans vs. Broncos Mar 19 Titans 6.10
4 Bulldogs vs. Panthers Mar 20 Panthers -14.60
5 Sea Eagles vs. Rabbitohs Mar 20 Rabbitohs -11.70
6 Cowboys vs. Dragons Mar 20 Cowboys 0.70
7 Wests Tigers vs. Roosters Mar 21 Roosters -12.80
8 Sharks vs. Raiders Mar 21 Raiders -4.10


March 15, 2021

Obesity and Covid deaths

Q: Did you see 90% of Covid deaths are due to obesity?

A: No

Q: It’s on Newshub: “90 percent or 2.2 million of the 2.5 million deaths from the pandemic disease so far were in countries with high levels of obesity.”

A: So, if that’s true, what countries are we talking about?

Q: With high levels of obesity? Australia, New Zealand, some of the Pacific Island nations, USA, UK,…

A: And what don’t those countries have in common?

Q: Lots of Covid deaths, I suppose.  But Australia and NZ and the Pacific Island countries didn’t have many deaths just because they didn’t have many cases. They don’t tell you anything about the risk

A: Neither does the ‘report’, which says, according to Newshub, “the majority of global COVID-19 deaths have been in countries where many people are obese, with coronavirus fatality rates 10 times higher in nations where at least 50 percent of adults are overweight”

Q: That sounds bad, though? Ten times higher is a lot!

A: How much do you think being overweight increases the risk of death?

Q: Well, if 50% overweight means ten times the risk, maybe a factor of twenty?

A: Yeah nah. Less than double, according to that very same report. (PDF, p13)

Q: So where do they get such a strong association?

A: Well, what are the main risk factors for dying of Covid?

Q: Um. Age?

A: And?

Q: Heart disease? Diabetes?

A:

Q:

A:

Q: Having Covid?

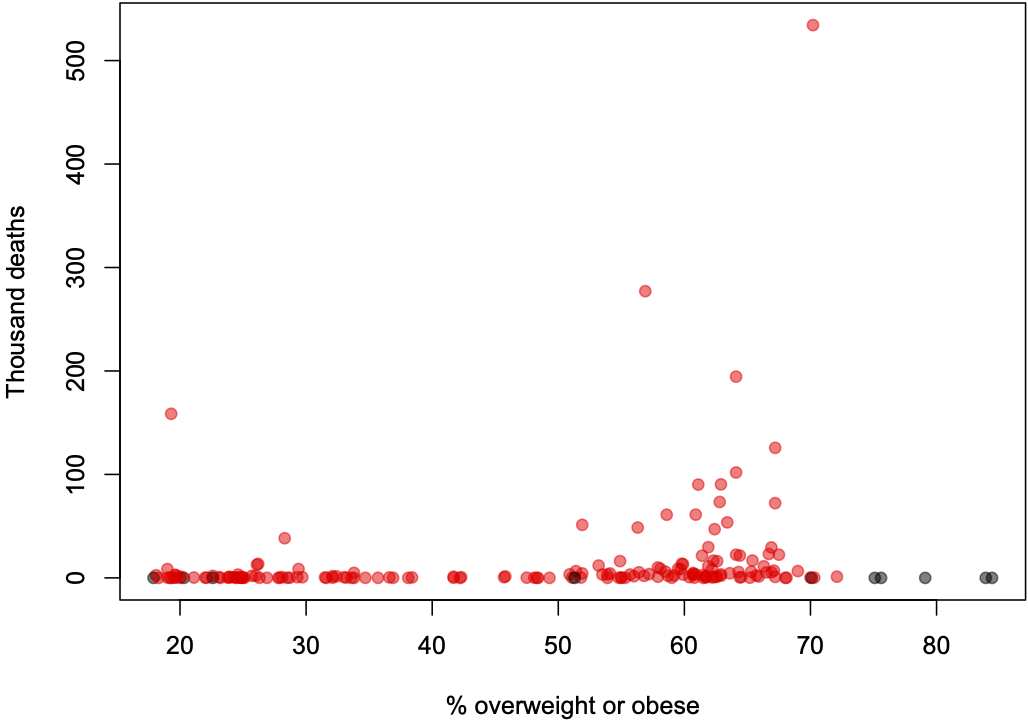
A: Exactly.  So we’d need to look at the proportion of infected people dying (the case fatality rate), not the total number of deaths, and we’d ideally want to compare countries with similar age profiles. Instead, Newshub shows us a graph of deaths, basically like this

Q: Why are some of the dots black?

A: They are countries that were missing from the Johns Hopkins Covid data, and so were missing from the original graph, mostly small nations like Samoa and Tonga and Timor-Leste with very few cases

Q: And what’s the dot on the left that isn’t in the graph on Newshub?

A: Afghanistan. I don’t know why it’s not there.

Q: So what about for risk of dying if you get Covid?

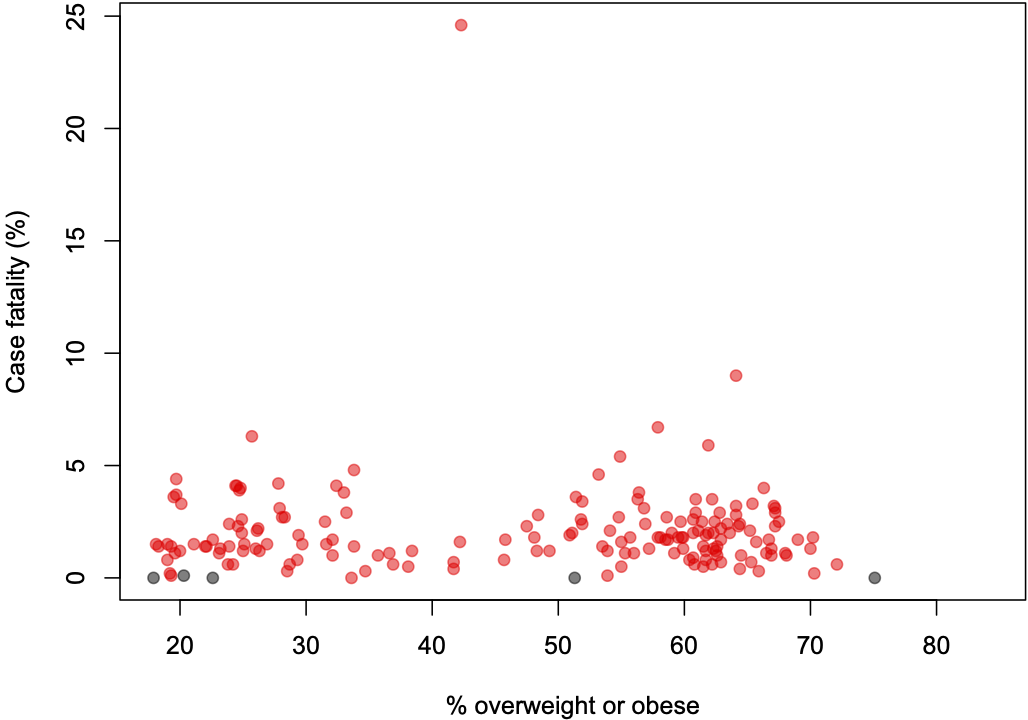
A: Here’s what it looks like for case fatality rate

Q: That’s…surprisingly unimpressive. Well, except for that one country…

A: Yemen

Q: Things they don’t need right now, number #1

A:  Too true.

Q: So the massive correlation?

A: Well, overweight is common in the USA, the UK, Brazil, and various other large countries that have handled the pandemic badly. While I suppose you could argue that handling the pandemic well should go with handling other public health issues well, the empirical evidence would not really be in your favour on that one.  You could also listen to a slightly different approach to the data from David Spiegelhalter and Tim Harford on BBC’s “More or Less”