Posts filed under General (3152)

November 7, 2018

Graph of the week

From Axios

The wealth of the world’s billionaires rose by $1.4 trillion in 2017, the largest annual increase ever.

The details: Nearly all of that increase was driven by the Asia-Pacific region, and specifically China, where billionaire wealth rose 39%.
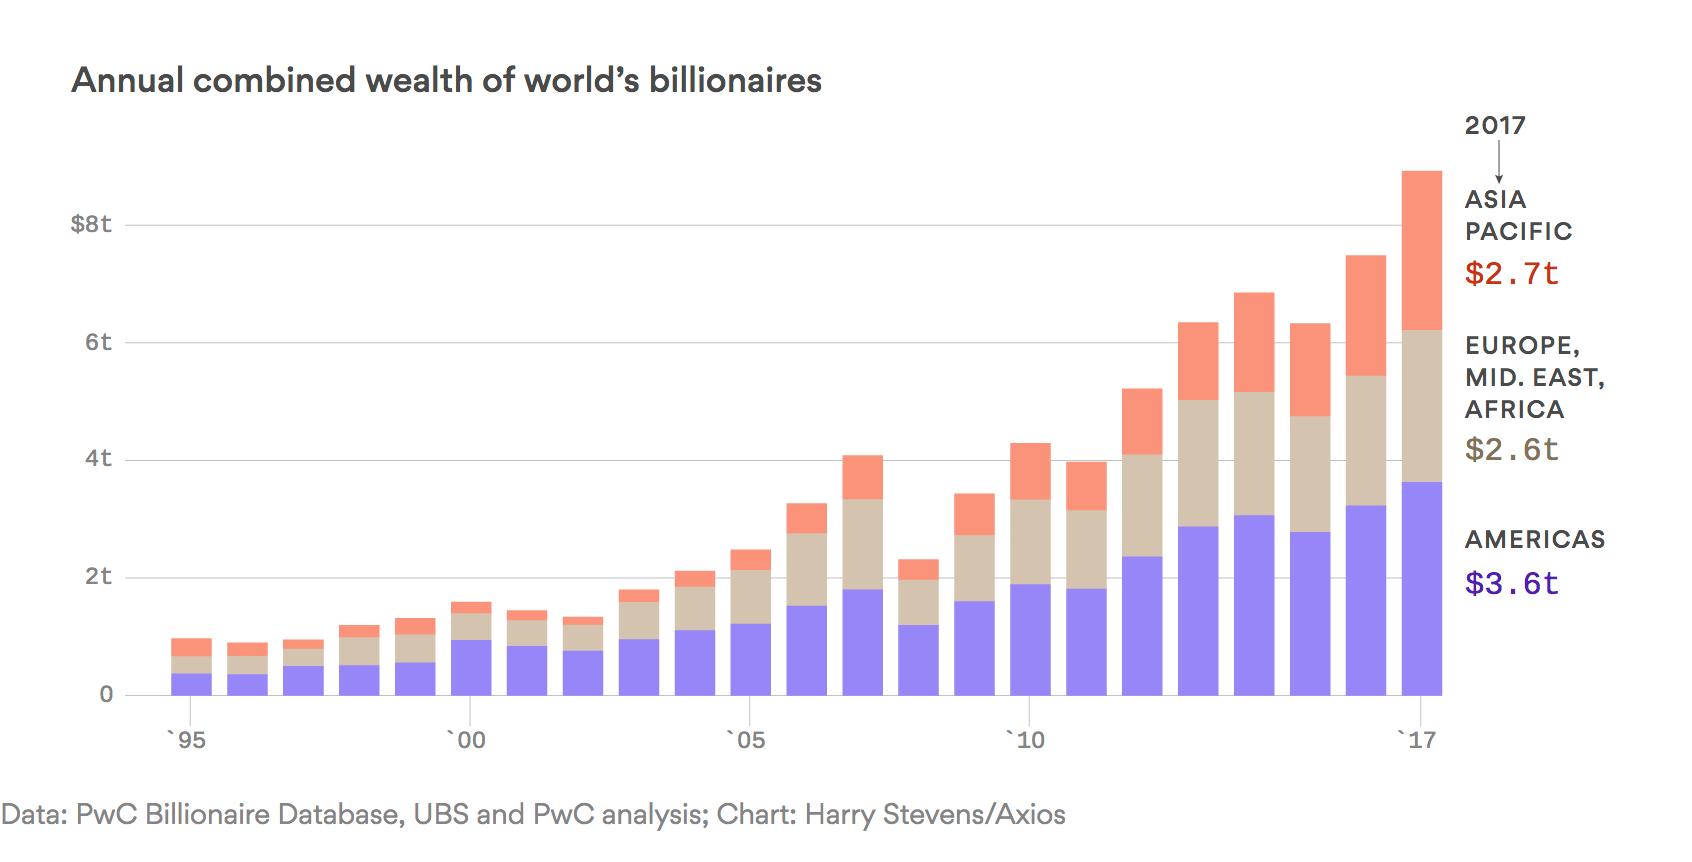
The graph is not well designed for illustrating the claim about billionaires: in a stacked bar chart like this it is easy to compare the first level, the sum of the first two, and the sum of all three, but not the top level.  If the chart had been stacked the other way up it would be more obvious that it doesn’t seem to go along with the claim.

Measuring the height of the bars in MacOS Preview (because it’s not possible to read the graph to high enough precision) I get 35 pixels increase in the Asia-Pacific region and 46 in the rest of the world, so the growth in the Asia-Pacific region actually is less than half the total growth.  Estimating the total growth by counting pixels does agree with the $1.4 trillion total, so what has gone wrong?

Clicking through to the UBS/PwC press release gives a bit more detail:

Chinese billionaires increased in number to 373 in 2017 from 318 in 2016 and their wealth rose by 39 percent to USD 1.12 trillion

So, the net increase in total wealth for Chinese billionaires is about $0.44 trillion. That hardly qualifies as “nearly all” of the increase for the Asia-Pacific region, let alone for the world

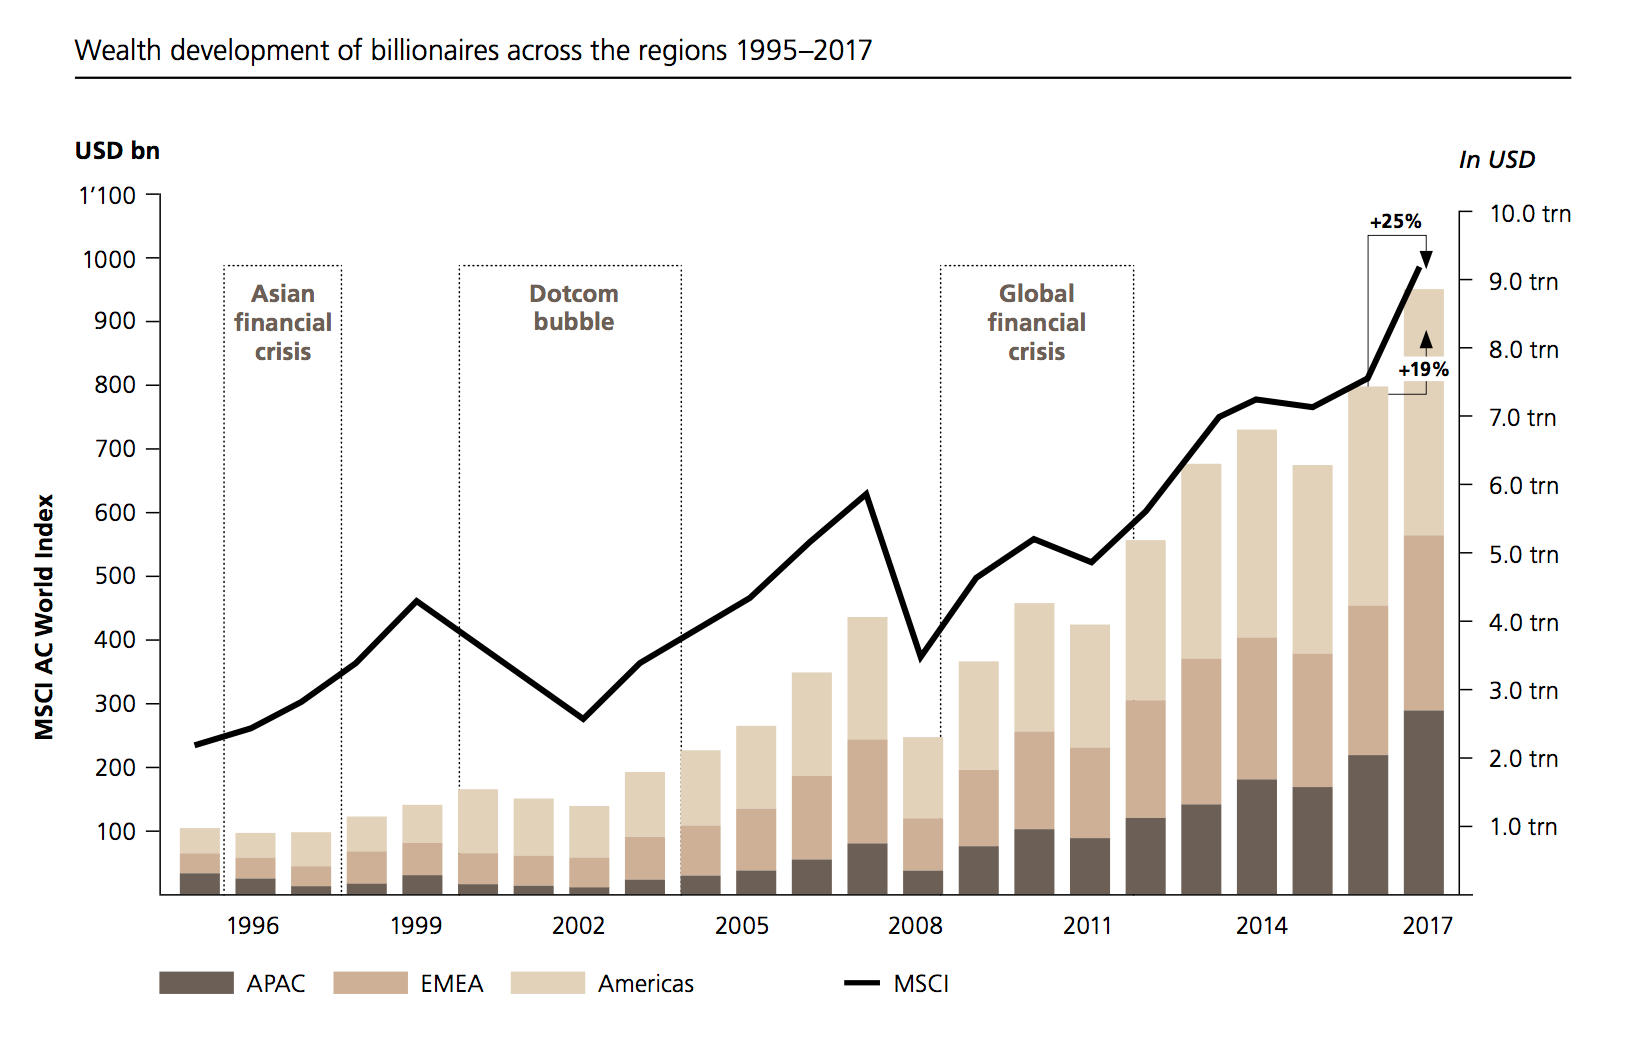
The original source is the the UBS/PwC Billionaires report. Their graph is better (apart maybe from the second y-axis). Not only is it the right way up for looking at increases in Asia vs the rest of the world, but it’s got tick marks on the right-hand axis where they’re actually useful. And it shows some historical context.
Normally I wouldn’t go to this much effort for a business news item — but the Axios Edge newsletter where I read this is edited by Felix Salmon, who is usually better at the difference between “nearly all” and “nearly half”


P.S. Yes, I did think of titling this post Crazy Rich Asians. No, I’m not sorry I didn’t.

October 31, 2018

Briefly

  • “even though men [in China] were responsible for 4.6 times more traffic incidents, news reports about accidents caused by women were 3.8 times more common in Chinese publications than articles about accidents caused by men” from Sixth Tone
  • You have about one week left to submit comments to the review of the Statistics Act (if you are NZ or otherwise care about NZ official statistics)
  • “Simple questions such as: “I wonder how they know that?”; “Is that better or worse than I might have expected?”; “What exactly do they mean?” often unlock far more insight than narrow technical queries.Tim Harford 
  • Halloween costume names generated by a neural network, as an illustration of how they work. By Janelle Shane, in the New York Times
  • Nice detailed description of a election forecasting model from Montgomery Blair High School, nearly in Washington DC.
  • Worthwhile Canadian Institution (or, the value of trusted official statistics in the ‘truth decay’ era)
  • From Reddit, a map of recorded meteorite impacts in the last century in the US.

    “Recorded” is doing a lot of the work here. Meteorite impacts have no preference as to longitude and a relatively weak preference for being closer to the equator.  The map also over-represents areas further from the equator, making the density look lower, but these factors must be relatively weak compared to the likelihood of an impact being recorded


October 23, 2018

Mitre 10 Cup Predictions for the Mitre 10 Cup Finals

Team Ratings for the Mitre 10 Cup Finals

The basic method is described on my Department home page.
Here are the team ratings prior to this week’s games, along with the ratings at the start of the season.

Current Rating Rating at Season Start Difference
Canterbury 14.09 15.32 -1.20
Wellington 11.41 12.18 -0.80
Auckland 11.16 -0.50 11.70
Tasman 9.06 2.62 6.40
Waikato 6.98 -3.24 10.20
North Harbour 5.56 6.42 -0.90
Otago -0.61 0.33 -0.90
Counties Manukau -2.03 1.84 -3.90
Taranaki -4.85 6.58 -11.40
Bay of Plenty -4.95 0.27 -5.20
Hawke’s Bay -6.26 -13.00 6.70
Northland -6.51 -3.45 -3.10
Manawatu -11.83 -4.36 -7.50
Southland -23.39 -23.17 -0.20


Performance So Far

So far there have been 74 matches played, 53 of which were correctly predicted, a success rate of 71.6%.
Here are the predictions for last week’s games.

Game Date Score Prediction Correct
1 Waikato vs. Northland Oct 19 48 – 26 16.50 TRUE
2 Tasman vs. Canterbury Oct 19 16 – 21 -0.20 TRUE
3 Auckland vs. Wellington Oct 20 38 – 17 -0.00 FALSE
4 Otago vs. Hawke’s Bay Oct 20 20 – 19 11.50 TRUE


Predictions for the Mitre 10 Cup Finals

Here are the predictions for the Mitre 10 Cup Finals. The prediction is my estimated expected points difference with a positive margin being a win to the home team, and a negative margin a win to the away team.

Game Date Winner Prediction
1 Waikato vs. Otago Oct 26 Waikato 11.60
2 Auckland vs. Canterbury Oct 27 Auckland 1.10


Currie Cup Predictions for the Currie Cup Final

Team Ratings for the Currie Cup Final

The basic method is described on my Department home page.
Here are the team ratings prior to this week’s games, along with the ratings at the start of the season.

Note that Cheetahs2 refers the Cheetahs team when there is a Pro14 match. The assumption is that the team playing in the Pro14 is the top team and the Currie Cup team is essentially a second team.


Current Rating Rating at Season Start Difference
Western Province 8.16 4.66 3.50
Sharks 4.52 4.18 0.30
Lions 2.56 3.23 -0.70
Cheetahs 2.23 3.86 -1.60
Blue Bulls 0.18 0.94 -0.80
Pumas -8.17 -8.36 0.20
Griquas -11.05 -9.78 -1.30
Cheetahs2 -29.69 -30.00 0.30


Performance So Far

So far there have been 23 matches played, 20 of which were correctly predicted, a success rate of 87%.
Here are the predictions for last week’s games.


Game Date Score Prediction Correct
1 Sharks vs. Lions Oct 20 33 – 24 6.00 TRUE
2 Western Province vs. Blue Bulls Oct 20 35 – 32 13.30 TRUE


Predictions for the Currie Cup Final

Here are the predictions for the Currie Cup Final. The prediction is my estimated expected points difference with a positive margin being a win to the home team, and a negative margin a win to the away team.


Game Date Winner Prediction
1 Western Province vs. Sharks Oct 27 Western Province 8.10


October 18, 2018

Rugby Premiership Predictions for Round 7

Team Ratings for Round 7

The basic method is described on my Department home page.
Here are the team ratings prior to this week’s games, along with the ratings at the start of the season.

Current Rating Rating at Season Start Difference
Saracens 12.58 11.19 1.40
Exeter Chiefs 12.24 11.13 1.10
Wasps 6.28 8.30 -2.00
Leicester Tigers 4.75 6.26 -1.50
Gloucester Rugby 2.83 1.23 1.60
Northampton Saints 2.62 3.42 -0.80
Harlequins 2.16 2.05 0.10
Bath Rugby 1.32 3.11 -1.80
Sale Sharks -1.24 -0.81 -0.40
Worcester Warriors -2.05 -5.18 3.10
Newcastle Falcons -3.30 -3.51 0.20
Bristol -6.60 -5.60 -1.00


Performance So Far

So far there have been 36 matches played, 26 of which were correctly predicted, a success rate of 72.2%.
Here are the predictions for last week’s games.

Game Date Score Prediction Correct
1 Bath Rugby vs. Exeter Chiefs Oct 05 24 – 39 -4.40 TRUE
2 Wasps vs. Gloucester Rugby Oct 06 21 – 35 11.00 FALSE
3 Sale Sharks vs. Newcastle Falcons Oct 06 20 – 7 6.40 TRUE
4 Northampton Saints vs. Leicester Tigers Oct 06 15 – 23 4.60 FALSE
5 Harlequins vs. Saracens Oct 06 20 – 25 -4.90 TRUE
6 Worcester Warriors vs. Bristol Oct 07 52 – 7 7.30 TRUE


Predictions for Round 7

Here are the predictions for Round 7. The prediction is my estimated expected points difference with a positive margin being a win to the home team, and a negative margin a win to the away team.

Game Date Winner Prediction
1 Gloucester Rugby vs. Leicester Tigers Nov 16 Gloucester Rugby 3.60
2 Harlequins vs. Newcastle Falcons Nov 16 Harlequins 11.00
3 Bath Rugby vs. Worcester Warriors Nov 17 Bath Rugby 8.90
4 Northampton Saints vs. Wasps Nov 17 Northampton Saints 1.80
5 Saracens vs. Sale Sharks Nov 17 Saracens 19.30
6 Bristol vs. Exeter Chiefs Nov 18 Exeter Chiefs -13.30


October 17, 2018

Briefly

  • The Crime Machine: two podcast episodes (with transcripts) on New York City police and the good and bad effects of trying to measure crime and police effort
  • You may have heard that Senator Elizabeth Warren had a genetic ancestry test. Carl Zimmer has a very good Twitter thread on what the results don’t mean
  • The Robots Learn By Watching Us’. Bloomberg columnist Matt Levine on training computers to behave like humans in stock picking and employment
  • The New York Times has a map of every building in the United States.
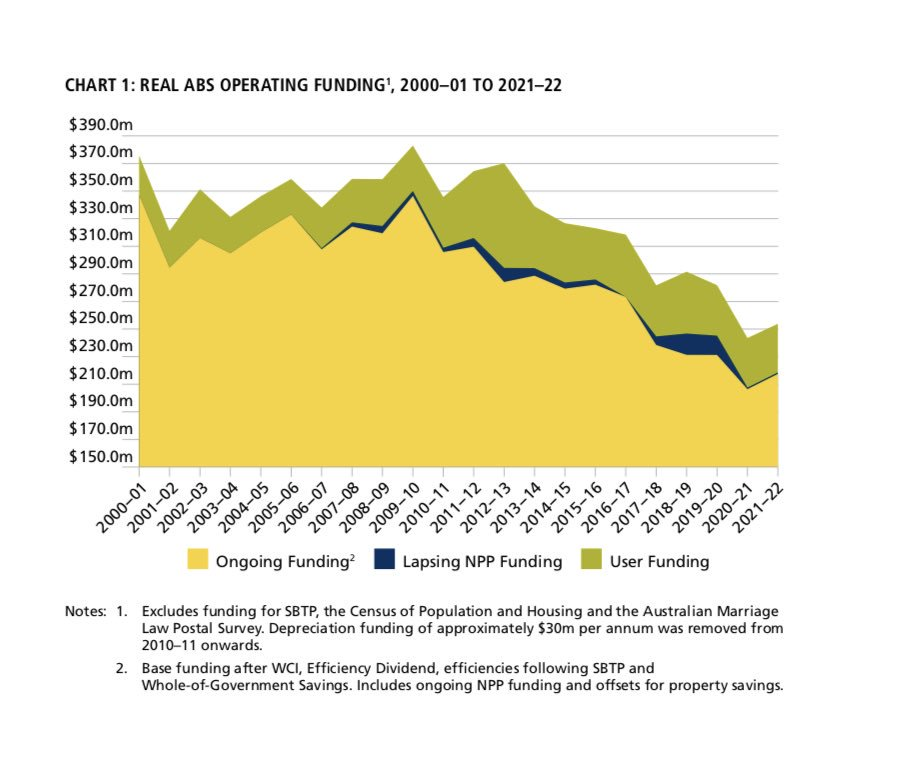
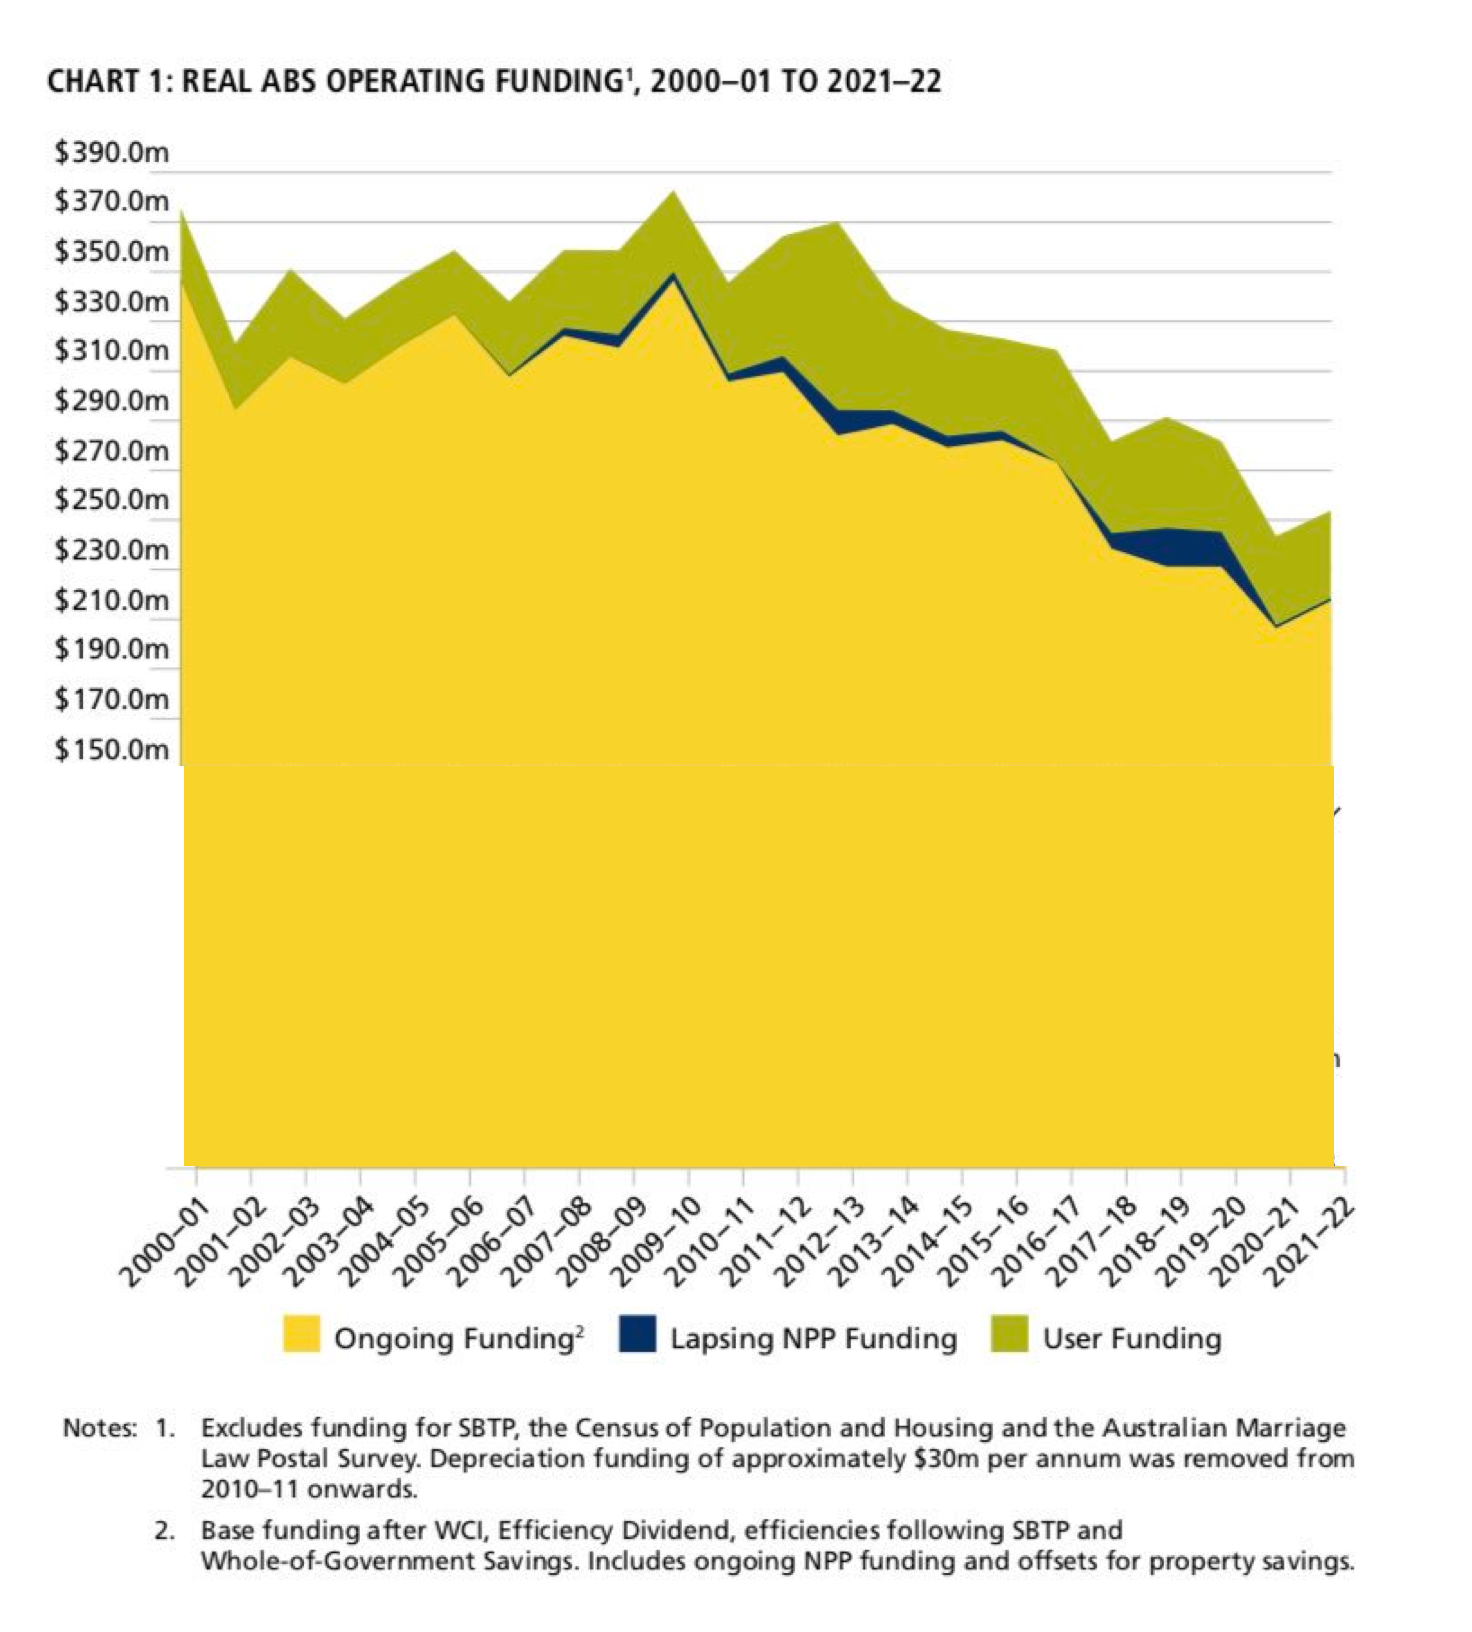
  • The Australian Bureau of Statistics is having its funding cut over time, which is probably not a good thing (via).  This graph, though:
    For barcharts and other area charts, the area is carrying the information, so you can’t just chop the bottom half off the graph. I put it back on:
  •  
October 16, 2018

Restart a heart

I see from Twitter that it’s World Restart A Heart Day,  encouraging people to learn CPR. Which you should do. It’s not hard. Nowadays there are even Spotify playlists of songs with the right beat for chest compressions.

However, two statistical points:

  1. Even if you don’t know CPR, the nice people at the ambulance service (111 emergency number in NZ) can tell you what to do. This works well enough that there have been randomised trials (in the US) comparing the effectiveness of different sets of instructions
  2. The success rate of CPR in real life is not as high as on television. If you give someone CPR it’s quite likely not to work, and that won’t be your fault. The success rate of CPR is still higher than no CPR.

Mitre 10 Cup Predictions for the Mitre 10 Cup Semi-Finals

Team Ratings for the Mitre 10 Cup Semi-Finals

The basic method is described on my Department home page.
Here are the team ratings prior to this week’s games, along with the ratings at the start of the season.

Current Rating Rating at Season Start Difference
Canterbury 13.65 15.32 -1.70
Wellington 13.30 12.18 1.10
Tasman 9.50 2.62 6.90
Auckland 9.27 -0.50 9.80
Waikato 6.49 -3.24 9.70
North Harbour 5.56 6.42 -0.90
Otago 0.34 0.33 0.00
Counties Manukau -2.03 1.84 -3.90
Taranaki -4.85 6.58 -11.40
Bay of Plenty -4.95 0.27 -5.20
Northland -6.02 -3.45 -2.60
Hawke’s Bay -7.21 -13.00 5.80
Manawatu -11.83 -4.36 -7.50
Southland -23.39 -23.17 -0.20


Performance So Far

So far there have been 70 matches played, 50 of which were correctly predicted, a success rate of 71.4%.
Here are the predictions for last week’s games.

Game Date Score Prediction Correct
1 Southland vs. Auckland Oct 10 8 – 56 -23.80 TRUE
2 Tasman vs. Hawke’s Bay Oct 11 29 – 0 18.90 TRUE
3 Taranaki vs. Wellington Oct 12 10 – 34 -12.00 TRUE
4 Bay of Plenty vs. Northland Oct 13 38 – 35 5.50 TRUE
5 Waikato vs. Otago Oct 13 19 – 23 13.30 FALSE
6 Counties Manukau vs. Canterbury Oct 13 14 – 19 -13.10 TRUE
7 Auckland vs. North Harbour Oct 14 45 – 29 3.70 TRUE
8 Manawatu vs. Southland Oct 14 38 – 26 14.20 TRUE


Predictions for the Mitre 10 Cup Semi-Finals

Here are the predictions for the Mitre 10 Cup Semi-Finals. The prediction is my estimated expected points difference with a positive margin being a win to the home team, and a negative margin a win to the away team.

Game Date Winner Prediction
1 Waikato vs. Northland Oct 19 Waikato 16.50
2 Tasman vs. Canterbury Oct 19 Canterbury -0.20
3 Auckland vs. Wellington Oct 20 Wellington -0.00
4 Otago vs. Hawke’s Bay Oct 20 Otago 11.50


Currie Cup Predictions for the SemiFinals

Team Ratings for the SemiFinals

The basic method is described on my Department home page.
Here are the team ratings prior to this week’s games, along with the ratings at the start of the season.

Note that Cheetahs2 refers the Cheetahs team when there is a Pro14 match. The assumption is that the team playing in the Pro14 is the top team and the Currie Cup team is essentially a second team.


Current Rating Rating at Season Start Difference
Western Province 8.57 4.66 3.90
Sharks 4.28 4.18 0.10
Lions 2.80 3.23 -0.40
Cheetahs 2.23 3.86 -1.60
Blue Bulls -0.22 0.94 -1.20
Pumas -8.17 -8.36 0.20
Griquas -11.05 -9.78 -1.30
Cheetahs2 -29.69 -30.00 0.30


Performance So Far

So far there have been 21 matches played, 18 of which were correctly predicted, a success rate of 85.7%.
Here are the predictions for last week’s games.


Game Date Score Prediction Correct
1 Pumas vs. Lions Oct 12 21 – 33 -5.40 TRUE
2 Griquas vs. Sharks Oct 13 11 – 41 -9.50 TRUE
3 Blue Bulls vs. Western Province Oct 13 7 – 34 -2.80 TRUE


Predictions for the SemiFinals

Here are the predictions for the SemiFinals. The prediction is my estimated expected points difference with a positive margin being a win to the home team, and a negative margin a win to the away team.


Game Date Winner Prediction
1 Sharks vs. Lions Oct 20 Sharks 6.00
2 Western Province vs. Blue Bulls Oct 20 Western Province 13.30


October 11, 2018

Briefly

  • How good is ‘good’? YouGov looks at how various words rate in the UK. “Average” gets 5 on a 10-point scale, which is more positive than I think it would rate here, though they didn’t ask about “a bit average” or “pretty average”
  • Nepal introduced a ban on internet porn. It cut Nepal’s traffic to porn site xHamster by about 50%. For about two weeks.  (not NSFW apart from being about porn)
  • The UK has a Statistics Authority to remind government and parliament not to misuse official statistics. This week, in correspondence with the Department for Education: “figures were presented in such a way as to misrepresent changes in school funding.
    In the tweet, school spending figures were exaggerated by using
    a truncated axis, and by not adjusting for per pupil spend.”  (Note: using nominal, aggregate figures rather than real, per capita figures to report spending and truncating bar chart axes are just as wrong here as in the UK)
  • Seek.co.nz are promoting their guide to salaries on Twitter again. This is based on advertised salaries/wages for positions advertised on Seek, not actual money paid to any group — and, for example, I’d be pleasantly surprised if “Kitchen and Sandwich Hands” actually averaged over $41,000 annual wages.