Posts filed under General (3152)

March 14, 2017

Super 18 Predictions for Round 4

Team Ratings for Round 4

The basic method is described on my Department home page.

Here are the team ratings prior to this week’s games, along with the ratings at the start of the season.

Current Rating Rating at Season Start Difference
Hurricanes 16.98 13.22 3.80
Chiefs 11.28 9.75 1.50
Highlanders 8.08 9.17 -1.10
Crusaders 8.08 8.75 -0.70
Lions 6.71 7.64 -0.90
Waratahs 2.92 5.81 -2.90
Brumbies 2.89 3.83 -0.90
Stormers 2.68 1.51 1.20
Sharks 2.05 0.42 1.60
Blues 0.88 -1.07 2.00
Bulls -0.76 0.29 -1.00
Jaguares -2.83 -4.36 1.50
Cheetahs -7.01 -7.36 0.40
Force -8.10 -9.45 1.40
Reds -9.14 -10.28 1.10
Rebels -12.37 -8.17 -4.20
Kings -19.01 -19.02 0.00
Sunwolves -20.42 -17.76 -2.70


Performance So Far

So far there have been 26 matches played, 18 of which were correctly predicted, a success rate of 69.2%.
Here are the predictions for last week’s games.

Game Date Score Prediction Correct
1 Chiefs vs. Hurricanes Mar 10 26 – 18 -3.60 FALSE
2 Brumbies vs. Force Mar 10 25 – 17 15.40 TRUE
3 Sharks vs. Waratahs Mar 10 37 – 14 0.40 TRUE
4 Blues vs. Highlanders Mar 11 12 – 16 -3.70 TRUE
5 Reds vs. Crusaders Mar 11 20 – 22 -14.70 TRUE
6 Cheetahs vs. Sunwolves Mar 11 38 – 31 18.80 TRUE
7 Kings vs. Stormers Mar 11 10 – 41 -16.50 TRUE
8 Jaguares vs. Lions Mar 11 36 – 24 -7.90 FALSE


Predictions for Round 4

Here are the predictions for Round 4. The prediction is my estimated expected points difference with a positive margin being a win to the home team, and a negative margin a win to the away team.

Game Date Winner Prediction
1 Crusaders vs. Blues Mar 17 Crusaders 10.70
2 Rebels vs. Chiefs Mar 17 Chiefs -19.70
3 Bulls vs. Sunwolves Mar 17 Bulls 23.70
4 Hurricanes vs. Highlanders Mar 18 Hurricanes 12.40
5 Waratahs vs. Brumbies Mar 18 Waratahs 3.50
6 Lions vs. Reds Mar 18 Lions 19.80
7 Sharks vs. Kings Mar 18 Sharks 24.60
8 Jaguares vs. Cheetahs Mar 18 Jaguares 8.20


NRL Predictions for Round 3

Team Ratings for Round 3

The basic method is described on my Department home page.

Here are the team ratings prior to this week’s games, along with the ratings at the start of the season.

Current Rating Rating at Season Start Difference
Storm 8.88 8.49 0.40
Cowboys 7.46 6.90 0.60
Sharks 7.40 5.84 1.60
Raiders 7.04 9.94 -2.90
Panthers 5.37 6.08 -0.70
Broncos 5.15 4.36 0.80
Eels 1.27 -0.81 2.10
Roosters 0.12 -1.17 1.30
Bulldogs -1.22 -1.34 0.10
Rabbitohs -1.70 -1.82 0.10
Titans -3.77 -0.98 -2.80
Wests Tigers -4.67 -3.89 -0.80
Sea Eagles -5.52 -2.98 -2.50
Dragons -5.91 -7.74 1.80
Warriors -7.31 -6.02 -1.30
Knights -14.65 -16.94 2.30


Performance So Far

So far there have been 16 matches played, 7 of which were correctly predicted, a success rate of 43.8%.
Here are the predictions for last week’s games.

Game Date Score Prediction Correct
1 Roosters vs. Bulldogs Mar 09 28 – 24 5.00 TRUE
2 Warriors vs. Storm Mar 10 10 – 26 -11.30 TRUE
3 Broncos vs. Cowboys Mar 10 20 – 21 1.70 FALSE
4 Knights vs. Titans Mar 11 34 – 26 -10.20 FALSE
5 Sea Eagles vs. Rabbitohs Mar 11 18 – 38 3.30 FALSE
6 Raiders vs. Sharks Mar 11 16 – 42 8.30 FALSE
7 Wests Tigers vs. Panthers Mar 12 2 – 36 -1.70 TRUE
8 Dragons vs. Eels Mar 12 16 – 34 -1.00 TRUE


Predictions for Round 3

Here are the predictions for Round 3. The prediction is my estimated expected points difference with a positive margin being a win to the home team, and a negative margin a win to the away team.

Game Date Winner Prediction
1 Storm vs. Broncos Mar 16 Storm 7.20
2 Bulldogs vs. Warriors Mar 17 Bulldogs 10.10
3 Titans vs. Eels Mar 17 Eels -1.50
4 Knights vs. Rabbitohs Mar 18 Rabbitohs -9.50
5 Panthers vs. Roosters Mar 18 Panthers 8.80
6 Cowboys vs. Sea Eagles Mar 18 Cowboys 16.50
7 Raiders vs. Wests Tigers Mar 19 Raiders 15.20
8 Sharks vs. Dragons Mar 19 Sharks 16.80


March 13, 2017

But, fear itself

new research paper from Alastair Woodward and co-workers at the University of Auckland looks at the the risks of cycling in New Zealand. Jamie Morton at the Herald has written about it.  Basically, cycling isn’t as dangerous as you probably thought: the risk of an injury severe enough to report to ACC or to go to the emergency department is about one incident per 10,000 half-hour trips.  Or, for me, about once in 25-30 years.

There are two caveats for this as a pro-cycling message.  First, there’s some selection bias: the people who currently cycle are more likely to have safe routes available than those who currently don’t cycle — bike paths really work.  So if more people started cycling with the current infrastructure the ‘safety in numbers’ effect would be reduced by the increased use of dangerous roads.

Second,  it isn’t just actual injury that’s a problem.  The research paper talks about the social context of risk perception, and how the fact that cycling is regarded as weird makes the risks seem higher, which is true and an important factor. But. One morning recently, I stopped at the traffic lights coming off Grafton Bridge, and the bus behind me didn’t.  I didn’t come that close to being hit; It’s still not a fun way to start the day.  Russell Brown, who can actually write, covers this aspect better than I can.  He concludes

Cycling is much safer than people think. But until things change, fear of cycling will keep many reasonable people off the roads.

March 12, 2017

Highchart of the week

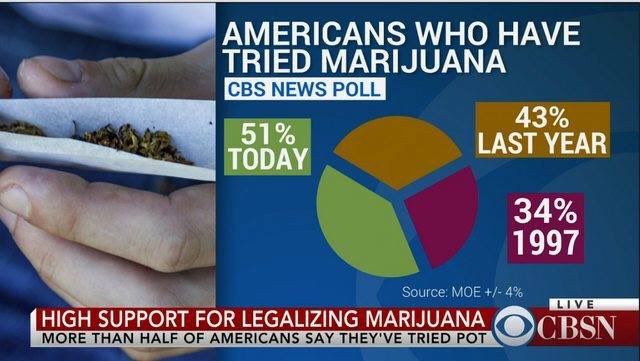
C6mMjf5U8AEC794

It’s not a piechart, because the wedges don’t add up to anything, which is the only possible justification for a pie chart.  On the other hand, unlike the pizzachart it is trying to display numerical data.

Also, “51% of Americans have tried marijuana today” is presumably not the intended reading, but the graphic doesn’t make that as clear as it might.

And the source for the data isn’t a guy named Moe. That’s an abbreviation for Margin of Error.  Google suggests the source is a CBS News Poll (PDF report), but that’s from last year.

(via @seanjtaylor)

Briefly

  • False positives: many people who think they are allergic to penicillin actually aren’t, and so don’t need to be given broader-spectrum antibiotics (which have more impact on resistance). Ars Technica, the research paper.
  • Cancer genomics researcher accused of data falsification. Long NY Times story, including very clever animation of Western blot duplication.
  • A bill in the US House of Representatives wouldn’t quite let employers demand genetic data from employees, but it would let employers make employees pay not to give it. (STAT news)
  • President Trump described good employment numbers under the previous government as ‘phony’.  After the first month of his government, the White House press secretary said “They may have been phony in the past, but it’s very real now”.  (via Vox)
  • “Cause of death” is complicated: the BBC has a story “The biggest killer you may not know” about sepsis. The story says it “kills more people in the UK each year than bowel, breast and prostate cancer combined.” But it’s not either/or. A substantial number of sepsis deaths are due to cancer or cancer treatment.
  • Cathy O’Neil on how looking harder for crimes by any group (such as immigrants) is bound to increase the crime rate — if a spurious increase wasn’t the aim, you’d need to be careful about interpreting the data.
March 8, 2017

Briefly

  • “Exploding boxplots”: although a boxplot is a lot better than just showing a mean, it’s usually worse than showing the data
  • The US state of Michigan used an automated system to detect unemployment benefit fraud. Late last year, an audit of 22427 cases of fraud overturned 93% of them! Now, a class-action lawsuit has been filed (PDF), giving (a one-sided view of) more of the details.
  • StatsChat has been saying for quite some time that people shouldn’t be making generalisations about road crash rates without evaluating the statistical evidence for increases or decreases.  It’s good to see someone doing the analysis: the Ministry of Transport has a big long report (PDF, from here) including (p37)[updated link]

    110. However, since 2013 the fatality rate has injury rate has begun to increase. We conducted statistical tests (Poisson) to see whether this increase was more than natural variation, and found strong evidence that the fatality and injury rates are actually rising.

  • Fascinating blog by John Grimwade, an infographics (as opposed to data visualisation) expert (via Kieran Healy)
  • “Not only does Google, the world’s preeminent index of information, tell its users that caramelizing onions takes “about 5 minutes”—it pulls that information from an article whose entire point was to tell people exactly the opposite.”  Another problem with Google’s new answer box, less serious than the claims about a communist coup in the US, but likely to be believed by more people.
March 7, 2017

Super 18 Predictions for Round 3

Team Ratings for Round 3

The basic method is described on my Department home page.

Here are the team ratings prior to this week’s games, along with the ratings at the start of the season.

Current Rating Rating at Season Start Difference
Hurricanes 17.67 13.22 4.40
Chiefs 10.59 9.75 0.80
Crusaders 8.84 8.75 0.10
Highlanders 8.06 9.17 -1.10
Lions 7.90 7.64 0.30
Waratahs 4.27 5.81 -1.50
Brumbies 3.33 3.83 -0.50
Stormers 1.81 1.51 0.30
Blues 0.90 -1.07 2.00
Sharks 0.69 0.42 0.30
Bulls -0.76 0.29 -1.00
Jaguares -4.02 -4.36 0.30
Cheetahs -6.31 -7.36 1.10
Force -8.54 -9.45 0.90
Reds -9.91 -10.28 0.40
Rebels -12.37 -8.17 -4.20
Kings -18.14 -19.02 0.90
Sunwolves -21.13 -17.76 -3.40


Performance So Far

So far there have been 18 matches played, 12 of which were correctly predicted, a success rate of 66.7%.
Here are the predictions for last week’s games.

Game Date Score Prediction Correct
1 Force vs. Reds Mar 02 26 – 19 4.60 TRUE
2 Chiefs vs. Blues Mar 03 41 – 26 12.90 TRUE
3 Hurricanes vs. Rebels Mar 04 71 – 6 29.80 TRUE
4 Highlanders vs. Crusaders Mar 04 27 – 30 3.50 FALSE
5 Brumbies vs. Sharks Mar 04 22 – 27 8.20 FALSE
6 Sunwolves vs. Kings Mar 04 23 – 37 3.10 FALSE
7 Lions vs. Waratahs Mar 04 55 – 36 6.10 TRUE
8 Stormers vs. Jaguares Mar 04 32 – 25 10.20 TRUE
9 Cheetahs vs. Bulls Mar 04 34 – 28 -3.10 FALSE


Predictions for Round 3

Here are the predictions for Round 3. The prediction is my estimated expected points difference with a positive margin being a win to the home team, and a negative margin a win to the away team.

Game Date Winner Prediction
1 Chiefs vs. Hurricanes Mar 10 Hurricanes -3.60
2 Brumbies vs. Force Mar 10 Brumbies 15.40
3 Sharks vs. Waratahs Mar 10 Sharks 0.40
4 Blues vs. Highlanders Mar 11 Highlanders -3.70
5 Reds vs. Crusaders Mar 11 Crusaders -14.70
6 Cheetahs vs. Sunwolves Mar 11 Cheetahs 18.80
7 Kings vs. Stormers Mar 11 Stormers -16.50
8 Jaguares vs. Lions Mar 11 Lions -7.90


NRL Predictions for Round 2

Team Ratings for Round 2

The basic method is described on my Department home page.

Here are the team ratings prior to this week’s games, along with the ratings at the start of the season.

Current Rating Rating at Season Start Difference
Raiders 9.62 9.94 -0.30
Storm 8.46 8.49 -0.00
Cowboys 7.22 6.90 0.30
Broncos 5.39 4.36 1.00
Sharks 4.82 5.84 -1.00
Panthers 2.92 6.08 -3.20
Roosters 0.21 -1.17 1.40
Eels -0.06 -0.81 0.70
Bulldogs -1.31 -1.34 0.00
Wests Tigers -2.23 -3.89 1.70
Titans -2.36 -0.98 -1.40
Rabbitohs -3.48 -1.82 -1.70
Sea Eagles -3.73 -2.98 -0.80
Dragons -4.58 -7.74 3.20
Warriors -6.89 -6.02 -0.90
Knights -16.07 -16.94 0.90


Performance So Far

So far there have been 8 matches played, 3 of which were correctly predicted, a success rate of 37.5%.
Here are the predictions for last week’s games.

Game Date Score Prediction Correct
1 Sharks vs. Broncos Mar 02 18 – 26 5.00 FALSE
2 Bulldogs vs. Storm Mar 03 6 – 12 -6.30 TRUE
3 Rabbitohs vs. Wests Tigers Mar 03 18 – 34 5.60 FALSE
4 Dragons vs. Panthers Mar 04 42 – 10 -10.30 FALSE
5 Cowboys vs. Raiders Mar 04 20 – 16 0.50 TRUE
6 Titans vs. Roosters Mar 04 18 – 32 3.70 FALSE
7 Warriors vs. Knights Mar 05 26 – 22 14.90 TRUE
8 Sea Eagles vs. Eels Mar 05 12 – 20 1.30 FALSE


Predictions for Round 2

Here are the predictions for Round 2. The prediction is my estimated expected points difference with a positive margin being a win to the home team, and a negative margin a win to the away team.

Game Date Winner Prediction
1 Roosters vs. Bulldogs Mar 09 Roosters 5.00
2 Warriors vs. Storm Mar 10 Storm -11.30
3 Broncos vs. Cowboys Mar 10 Broncos 1.70
4 Knights vs. Titans Mar 11 Titans -10.20
5 Sea Eagles vs. Rabbitohs Mar 11 Sea Eagles 3.30
6 Raiders vs. Sharks Mar 11 Raiders 8.30
7 Wests Tigers vs. Panthers Mar 12 Panthers -1.70
8 Dragons vs. Eels Mar 12 Eels -1.00


March 6, 2017

Cause of death

In medical research we distinguish ‘hard’ outcomes that can be reliably and objectively measured (such as death, blood pressure, activated protein C concentrations) from ‘soft’ outcomes that depend on subjective reporting.  We also distinguish ‘patient-centered’ or ‘clinical’ or ‘real’ outcomes that matter directly to patients (such as death, pain, or dependency) from ‘surrogate’  or ‘intermediate’ outcomes that are biologically meaningful but don’t directly matter to patients.  ‘Death’ is one of the few things we can measure that’s on both lists.

Cause of death, however, is a much less ideal thing to measure.  If some form of cancer screening makes it less likely that you die of that particular type of cancer but doesn’t increase how long you live, it’s going to be less popular than if it genuinely postpones death.  What’s more surprising is that cause of death is hard to measure objectively and reliably. But it is.

Suppose someone smokes heavily for many years and as a result develops chronic lung disease, and as a result develops pneumonia, and as a result is in hospital, has a cardiac arrest due to a medical error, and dies. Is the cause of death ‘cardiac arrest’ or ‘medical error’ or ‘pneumonia’ or ‘COPD’ or ‘smoking’?  The best choice is a subjective matter of convention: what’s the most useful way to record the primary cause of death? But even with a convention in place, there’s a lot of work to make sure it is followed.  For example, a series of research papers in Thailand estimated that more than half the deaths from the main causes (eg stroke, HIV/AIDs, road traffic accidents, types of heart disease) were misclassified as less-specific causes, and came up with a way to at least correct the national totals.

In Western countries, things are better on average. However, as Radio NZ described today, in Australia (and probably NZ) deaths of people with intellectual disability tend to be reported as due to their intellectual disability rather than to whatever specific illness or injury they had.  You can see why this happens, but you should also be able to see why it’s not ideal in improving healthcare for these people.  Listen to the Radio NZ story; it’s good. If you want a reference to the open-access research paper, though, you won’t find it at Radio NZ. It’s here


Briefly

  • Newshub had a story about the Accommodation Survey not specifically excluding people in hotels who were there as emergency housing.  Nerds across the NZ political spectrum (eg, me, Keith Ng, and Eric Crampton) were unimpressed with this story. Eric actually wrote a blog post, so I’ll refer you there for more details.
  • Russell Brown wrote about the overuse of workplace drug tests that aren’t tests for impairment.
  • A research paper in PLoS One shows that newspapers write about news.  That is, they write `breakthrough’ stories about new treatments but give a lot less prominence to later studies that are less favorable.  Interestingly, this didn’t apply to ‘lifestyle’ stories, where ‘coffee is Good/Bad this week’ can always find a place.
  • The Herald had a story last week about “The $2m+ price tag for a top decile Auckland education.” In contrast to their story two years ago, this doesn’t make any attempt to estimate the premium for the top school zones. That is, if a family with school-age kids doesn’t live in the ‘Double Grammar Zone’ and pay $2 million for a house, they’ll still have to live somewhere and pay something for a house.  In the 2015 story, the cost of a house just outside a top school zone was about 20% lower than just inside. Even that probably overestimates the school premium, but the total cost of a house obviously does.