Posts filed under General (3152)

June 28, 2016

Updated Super Rugby Predictions

I posted predictions for Round 15 before the international games. I have just updated the predictions because I had not taken into account that the Chiefs versus Crusaders game is to be on a neutral ground.

See the updated post atSuper 18 Predictions for Round 15

NRL Predictions for Round 17

Team Ratings for Round 17

The basic method is described on my Department home page.

Here are the team ratings prior to this week’s games, along with the ratings at the start of the season.

Current Rating Rating at Season Start Difference
Cowboys 9.60 10.29 -0.70
Storm 8.57 4.41 4.20
Broncos 6.39 9.81 -3.40
Sharks 5.71 -1.06 6.80
Bulldogs 4.96 1.50 3.50
Raiders 2.90 -0.55 3.50
Eels 1.23 -4.62 5.90
Panthers -0.59 -3.06 2.50
Roosters -1.35 11.20 -12.60
Dragons -2.11 -0.10 -2.00
Sea Eagles -2.14 0.36 -2.50
Warriors -2.56 -7.47 4.90
Rabbitohs -3.23 -1.20 -2.00
Titans -3.37 -8.39 5.00
Wests Tigers -5.23 -4.06 -1.20
Knights -17.13 -5.41 -11.70


Performance So Far

So far there have been 118 matches played, 71 of which were correctly predicted, a success rate of 60.2%.
Here are the predictions for last week’s games.

Game Date Score Prediction Correct
1 Panthers vs. Rabbitohs Jun 24 28 – 26 6.30 TRUE
2 Knights vs. Dragons Jun 25 18 – 30 -12.00 TRUE
3 Sharks vs. Warriors Jun 25 19 – 18 14.10 TRUE
4 Bulldogs vs. Broncos Jun 25 40 – 14 -2.30 FALSE
5 Titans vs. Raiders Jun 26 22 – 30 -2.40 TRUE
6 Storm vs. Wests Tigers Jun 26 29 – 20 18.10 TRUE
7 Cowboys vs. Sea Eagles Jun 27 30 – 26 16.50 TRUE


Predictions for Round 17

Here are the predictions for Round 17. The prediction is my estimated expected points difference with a positive margin being a win to the home team, and a negative margin a win to the away team.

Game Date Winner Prediction
1 Roosters vs. Bulldogs Jun 30 Bulldogs -3.30
2 Broncos vs. Storm Jul 01 Broncos 0.80
3 Warriors vs. Titans Jul 02 Warriors 4.80
4 Wests Tigers vs. Panthers Jul 02 Panthers -1.60
5 Sharks vs. Eels Jul 02 Sharks 7.50
6 Raiders vs. Knights Jul 03 Raiders 23.00
7 Rabbitohs vs. Cowboys Jul 03 Cowboys -9.80
8 Sea Eagles vs. Dragons Jul 04 Sea Eagles 3.00


June 27, 2016

Graph of the week

bbc-eu
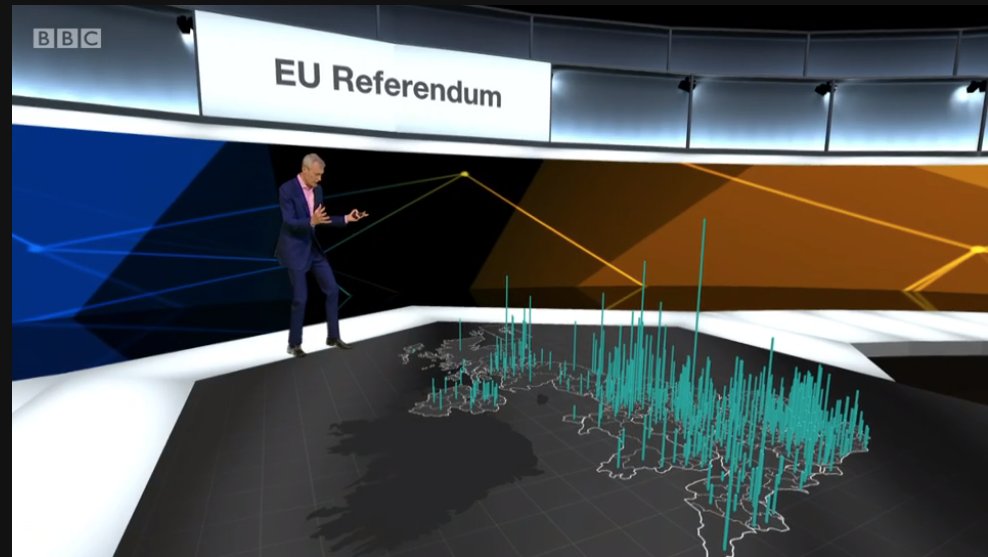
From the BBC coverage of the Brexit referendum. With great power comes great responsibility.

Briefly

  • In Brexit, the YouGov estimate that I mentioned last week was pretty accurate, but the result genuinely was too close to call.  The real-time forecasts from Chris Hanretty at the University of East Anglia seemed to work well.
  • If you combine turnout estimates with voting estimates by age group, the proportion of 18-24 year olds voting Remain (75% of the 36% turnout) was less than the proportion of 65+ year olds (39% of the 83% turnout).  Turnout matters.
  • You’re much more likely to survive a cardiac arrest on TV than in real life.
  • What theoretical physicists (statisticians, etc,) look like when working (Dr Katie Mack, astrophysics/cosmology). No lab coats; no brighly coloured Erlenmeyer flasks.
June 22, 2016

Eat up your doormats

Q: Did you see food allergies are caused by diet?

A: That makes sense, I suppose.

Q: Does it make sense that low-fibre diets are why people get peanut allergy more now?

A: Ah. No.

Q: Why not?

A: Because fibre in the typical diet hasn’t changed much in recent years and peanut allergies have become much more common.

Q: It could still be true that adding more fibre would stop people getting peanut allergies, though?

A: Could be.

Q: And that’s what the research found?

A: Up to a point.

Q:  Mice?

A: Mice.

Q: But peanut allergy and dietary fibre?

A: Yes, pretty much. And a plausible biological reason for how it might work.

Q: So it’s worth trying in humans?

A: Probably, though getting little kids to eat that much fibre would be hard.

Q: But the story just says “a simple bowl of bran and some dried apricots in the morning”

A: Sadly, yes.

Q: So how much fibre did they give the rats?

A: They compared a zero-fibre diet to 35% fibre

Q: Is 35% a lot?

A: Well, it’s more than All-Bran, and that was their whole diet.

Q: A more reasonable dose might still work, though?

A: Sure. But you wouldn’t want to assume it did before the trials happened.


Briefly

  • The Data Journalism Awards from the Global Editors Network (scroll down past the ceremony stuff to get the links to the award-winners). And a commentary from Simon Rogers
  • Colorado legalised cannabis recently. They have data on teenage cannabis use over time. It hasn’t gone up, probably because teens who wanted pot could already get it.
    I still haven’t seen anything on the two more important potential health impacts: do car crashes go up or down, does alcohol consumption go up or down.
  • A nice detailed explanation of how YouGov is doing its predictions for the Brexit referendum.  At the moment they are robustly unsure, estimating 48%-53% vote for “Leave”.  They do discuss how badly the last election polling went, and conclude  “if we have a problem, it will probably not be the same problem as last time.” (via Andrew Gelman)

NRL Predictions for Round 16

Team Ratings for Round 16

The basic method is described on my Department home page.

Here are the team ratings prior to this week’s games, along with the ratings at the start of the season.

Current Rating Rating at Season Start Difference
Cowboys 10.48 10.29 0.20
Storm 9.22 4.41 4.80
Broncos 8.30 9.81 -1.50
Sharks 6.64 -1.06 7.70
Bulldogs 3.05 1.50 1.60
Raiders 2.45 -0.55 3.00
Eels 1.23 -4.62 5.90
Panthers -0.24 -3.06 2.80
Roosters -1.35 11.20 -12.60
Dragons -2.11 -0.10 -2.00
Titans -2.92 -8.39 5.50
Sea Eagles -3.03 0.36 -3.40
Warriors -3.48 -7.47 4.00
Rabbitohs -3.57 -1.20 -2.40
Wests Tigers -5.88 -4.06 -1.80
Knights -17.13 -5.41 -11.70


Performance So Far

So far there have been 111 matches played, 65 of which were correctly predicted, a success rate of 58.6%.
Here are the predictions for last week’s games.

Game Date Score Prediction Correct
1 Rabbitohs vs. Eels Jun 17 12 – 30 0.80 FALSE
2 Dragons vs. Storm Jun 18 20 – 10 -11.20 FALSE
3 Warriors vs. Roosters Jun 19 12 – 10 1.80 TRUE
4 Titans vs. Sea Eagles Jun 20 30 – 10 0.40 TRUE


Predictions for Round 16

Here are the predictions for Round 16. The prediction is my estimated expected points difference with a positive margin being a win to the home team, and a negative margin a win to the away team.

Game Date Winner Prediction
1 Panthers vs. Rabbitohs Jun 24 Panthers 6.30
2 Knights vs. Dragons Jun 25 Dragons -12.00
3 Sharks vs. Warriors Jun 25 Sharks 14.10
4 Bulldogs vs. Broncos Jun 25 Broncos -2.30
5 Titans vs. Raiders Jun 26 Raiders -2.40
6 Storm vs. Wests Tigers Jun 26 Storm 18.10
7 Cowboys vs. Sea Eagles Jun 27 Cowboys 16.50


June 19, 2016

Cheese addiction hoax again

Two more news sites have fallen for the cheese addiction story.

A recap for those who missed the earlier episodes:

  • There was a paper using the Yale Food Addiction Scale that evaluated a lot of foods for (alleged) addictiveness.
  • Pizza came top.
  • Someone (we don’t know who) pushed a story to various media sites saying the research had found cheese-based foods were the most addictive (false), and that this was because of milk protein fragments called casomorphins (which aren’t even mentioned in the research paper, as you can check for yourself, and which haven’t been shown to be addictive even in mice).
  • The people behind the research have disclaimed these weird interpretations of what they found. Here’s a detailed story


Are stay-at-home dads the end of civilisation?

In a Herald (Daily Telegraph) story this week

When confronted, he confessed he’d been having an affair with a single mother he met at the school gates.

“She was vulnerable,” says Janet. “I guess he liked that. It made him feel like a hero.”

Her experience sadly chimes with the findings of a new study of more than 2,750 young married people by the University of Connecticut, which showed that men who are financially dependent on their spouses are the most likely to be unfaithful. In fact, the bigger the earning gap, the more likely they are to have an affair, with those who rely solely on their wives for their income the biggest cheats.

It turns out there are things wrong with this story, even restricting to statistical issues. To find them, you’d need to look at the research paper, which you probably can’t, because it’s paywalled.  I should note that these aren’t necessarily all criticisms of the paper for the question it was answering (which was about motivations for fidelity/infidelity). but they are for how it has been used — to turn a couple of anecdotes into a Deeply Worrying Social Trend.

First, the income data. The researcher writes

I calculated the measure from respondents’ and their spouse’s total income earned during the previous year from wages, salaries, commissions, and tips. I excluded self-employment income, because the division between labor income and business income is often measured with substantial error.

That means the group described as ‘rely solely on their wives for income‘ includes all the self-employed men, no matter how much they earn. There may well be more of them than voluntarily unemployed house-husbands.

Second, a somewhat technical point, which I think I last covered in 2012, with two posts on a story about mid-life crisis in chimpanzees.

Here’s a summary of the model given in the research paper
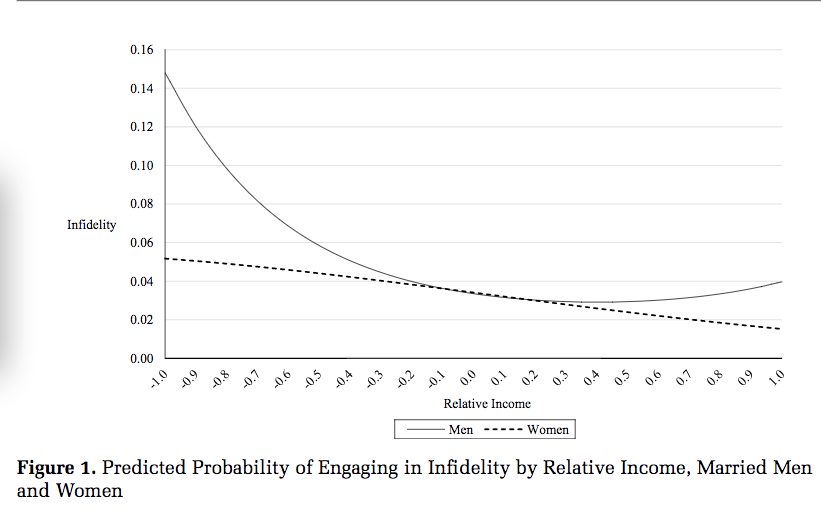
cheat

Notice how the curved line for men bends away from the straight line for women on both sides? And that the deviation from a straight line looks pretty symmetric? That’s forced by the statistical model.

Conceptually, the left and right sides of this graph show quite different phenomena. The right side says that the decrease in infidelity with higher relative income flattens out in men, but not in women. The left side says that the increase with lower relative income accelerates in men. The model forces these to be the same, and uses the same data to estimate both.

Since there are more men with positive than negative relative income, most of the actual evidence for men is on the right-hand side, but the newspaper story is looking at the left-hand side.
Selfies can damage your credibility

A Herald story, under the headline Selfies can damage your health

Dermatologists now believe that regularly exposing the face to the light and electromagnetic radiation from smartphones can speed up ageing and wrinkles.

The people making that claim don’t seem to be giving any evidence. You’d need a lot of evidence to believe a claim like that, given how much more light and electromagnetic radiation we get from the sun. Sure, sunlight doesn’t have quite the same frequency spectrum, but it’s so much brighter that it will be giving you more exposure at any frequency.

Also, when you’re taking selfies, your phone is usually not particularly close to your face.  After all, that’s why selfie sticks were invented. If the claim were true, the real message would be that selfies protect your health.

Doctors even claim they can tell which hand a person holds their phone in just by looking at which side of the face is most damaged.

I have no real doubt that this doctor can tell which hands his patients hold their phones in — for example, by observing what hand they use for other things, or what pocket the phone is kept in.  But, again, people nowadays don’t spend much time holding their phones up to one side of their faces. You only do that for phone calls, and only then if you don’t have a headset, and that’s such a twentieth century way to use a phone.

And, yes, the people involved are all selling something.

(This story comes from the Daily Telegraph, though it didn’t say so when I first read it, and according to a credible witness it said Daily Mail earlier)