Posts filed under General (3152)

March 7, 2016

Briefly

  • From Public Address: An example of unfunded drugs other than Keytruda (pembrolizumab) that might be higher up a priority list
  • Sensible presentation of stats in a Herald story on seatbelts and crashes
  • From Fusion: “How this company tracked 16,000 Iowa caucus-goers via their phones”
  • And finally, two notes on the flag referendum. First, if the current flag doesn’t win, New Zealand will go down in history as the new example of opinion-poll failure, since current polls give it an almost 2-1 lead. Second, in case it turns out to be necessary, a mnemonic for the official number of leaflets on the fern: it’s the number of players on a team for the Silver Ferns (netball, 7), plus the White Ferns (cricket, 11), plus the Black Ferns (rugby union, 15) — a celebration of NZ women’s sports.
March 2, 2016

Better living through genetics

Q: So the Herald headline asks “Could this drug stop hair going grey?” Could it?

A: Which drug?

Q: The one in the story?

A: There isn’t a drug in the story.

Q: Ok, what is in the story and why do the Herald and the Daily Telegraph think it’s a drug?

A: There’s a gene. Called IRF4

Q: So people can be given this gene and their hair will stop going grey?

A: No, everyone already has this gene. That’s how genes work.

Q: You know what I mean. The version of the gene that stops greying; are the scientists are going to give people that?

A: No.

Q: What, then?

A: “They are confident that it will be possible to produce drugs or cosmetics to switch it off.”

Q: How confident should I be?

A: Well, we’ve known one of the gene responsible for baldness for about a decade…

Q: So I shouldn’t hold my breath. How much of hair greyness does this genetic variant explain?

A: Among people old enough for it to matter, about 0.1 points on a 5-point scale where most people were 1 or 2.

Q: That doesn’t sound like that much.

A: A lot more of the hair greyness seemed to be genetic, just not explained by that one genetic variant

Q: Doesn’t that make it worse for trying to make drugs?

A: Yes, but more interesting for science

Q: I think you have your priorities wrong.

A: Then you won’t be interested in the stories that talk about the real point of the research and its findings.

Briefly

  • From STAT news, a story about doctors who promote treatments on Twitter without disclosing significant conflicts of interest. “Simon said the extensive work he does for drug companies, including helping them develop drugs, would be too long to include as a disclosure in social media.
    (At the other extreme, Stephen Senn’s disclosure statement)
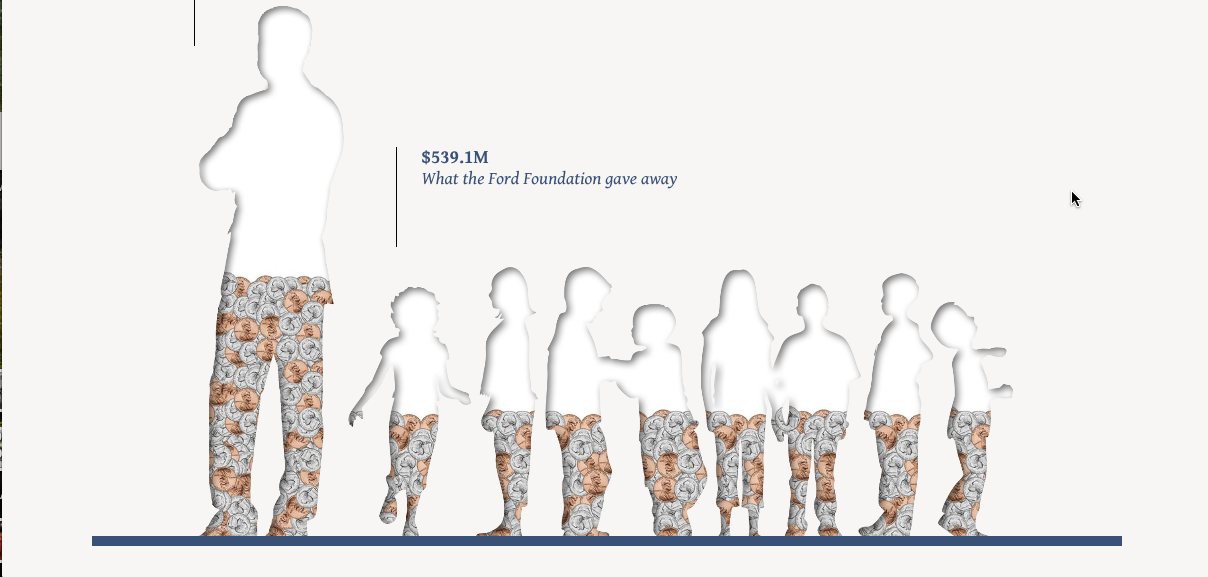
  • This (good) Huffington Post story about good and bad ways to give away large sums of money has an.. um..unique graphic about halfway throughff
    The bunch of children on the right represent donation by the Ford Foundation; the guy on the left represents payments to consultants. The blue and brown flowers are actually coins, and they surge up and down in the silhouettes in what must be intended to be a helpful way? (via @felixsalmon)
  • Overly-sensitive tests: assays for cocaine: a US drug labs was asked to develop a forensic test for cocaine on money that could be used as evidence against drug traffickers. The test worked, but it returned positive results on seven of 21 random samples of destroyed $50 notes removed from circulation.
  • There was a widely circulated story (Guardian, Fusion) reporting a study that showed women on Github wrote better code but were less likely to have it accepted. The truth is more complicated: here’s one discussion including the key graph. (via Heather Piwowar)
  • The Newmarket Business Association has released a poll on the flag referendum where they surveyed “Newmarket residents, commuters, and workers”.  They found 40% support for the new flag,  but didn’t explain why anyone would care about their particular sample.

Super 18 Predictions for Round 2

Team Ratings for Round 2

The basic method is described on my Department home page.

Here are the team ratings prior to this week’s games, along with the ratings at the start of the season.

Current Rating Rating at Season Start Difference
Crusaders 8.84 9.84 -1.00
Highlanders 6.15 6.80 -0.60
Brumbies 5.68 3.15 2.50
Waratahs 4.99 4.88 0.10
Hurricanes 4.73 7.26 -2.50
Chiefs 3.68 2.68 1.00
Stormers 0.60 -0.62 1.20
Sharks -0.05 -1.64 1.60
Lions -1.28 -1.80 0.50
Bulls -1.96 -0.74 -1.20
Blues -4.86 -5.51 0.60
Rebels -5.89 -6.33 0.40
Force -8.88 -8.43 -0.40
Cheetahs -9.62 -9.27 -0.30
Jaguares -9.66 -10.00 0.30
Reds -9.92 -9.81 -0.10
Sunwolves -10.53 -10.00 -0.50
Kings -15.25 -13.66 -1.60


Performance So Far

So far there have been 9 matches played, 4 of which were correctly predicted, a success rate of 44.4%.
Here are the predictions for last week’s games.

Game Date Score Prediction Correct
1 Blues vs. Highlanders Feb 26 33 – 31 -8.80 FALSE
2 Brumbies vs. Hurricanes Feb 26 52 – 10 -0.10 FALSE
3 Cheetahs vs. Jaguares Feb 26 33 – 34 4.70 FALSE
4 Sunwolves vs. Lions Feb 27 13 – 26 -4.20 TRUE
5 Crusaders vs. Chiefs Feb 27 21 – 27 10.70 FALSE
6 Waratahs vs. Reds Feb 27 30 – 10 18.20 TRUE
7 Force vs. Rebels Feb 27 19 – 25 1.40 FALSE
8 Kings vs. Sharks Feb 27 8 – 43 -8.50 TRUE
9 Stormers vs. Bulls Feb 27 33 – 9 3.60 TRUE


Predictions for Round 2

Here are the predictions for Round 2. The prediction is my estimated expected points difference with a positive margin being a win to the home team, and a negative margin a win to the away team.

Game Date Winner Prediction
1 Crusaders vs. Blues Mar 04 Crusaders 17.20
2 Brumbies vs. Waratahs Mar 04 Brumbies 4.20
3 Chiefs vs. Lions Mar 05 Chiefs 9.00
4 Highlanders vs. Hurricanes Mar 05 Highlanders 4.90
5 Reds vs. Force Mar 05 Reds 2.50
6 Bulls vs. Rebels Mar 05 Bulls 7.90
7 Cheetahs vs. Stormers Mar 05 Stormers -6.70
8 Sharks vs. Jaguares Mar 05 Sharks 13.60


NRL Predictions for Round 1

Team Ratings for Round 1

The basic method is described on my Department home page.

Here are the team ratings prior to this week’s games, along with the ratings at the start of the season.

Current Rating Rating at Season Start Difference
Roosters 11.20 11.20 -0.00
Cowboys 10.29 10.29 -0.00
Broncos 9.81 9.81 0.00
Storm 4.41 4.41 -0.00
Bulldogs 1.50 1.50 0.00
Sea Eagles 0.36 0.36 -0.00
Dragons -0.10 -0.10 -0.00
Raiders -0.55 -0.55 0.00
Sharks -1.06 -1.06 -0.00
Rabbitohs -1.20 -1.20 0.00
Panthers -3.06 -3.06 -0.00
Wests Tigers -4.06 -4.06 -0.00
Eels -4.62 -4.62 0.00
Knights -5.41 -5.41 0.00
Warriors -7.47 -7.47 -0.00
Titans -8.39 -8.39 -0.00


Predictions for Round 1

Here are the predictions for Round 1. The prediction is my estimated expected points difference with a positive margin being a win to the home team, and a negative margin a win to the away team.

Game Date Winner Prediction
1 Eels vs. Broncos Mar 03 Broncos -11.40
2 Sea Eagles vs. Bulldogs Mar 04 Sea Eagles 1.90
3 Raiders vs. Panthers Mar 05 Raiders 5.50
4 Wests Tigers vs. Warriors Mar 05 Wests Tigers 7.40
5 Cowboys vs. Sharks Mar 05 Cowboys 14.40
6 Roosters vs. Rabbitohs Mar 06 Roosters 15.40
7 Titans vs. Knights Mar 06 Titans 0.00
8 Storm vs. Dragons Mar 07 Storm 7.50


February 25, 2016

Thinking about chocolate

Q: Did you see that smart people like chocolate?

A: Isn’t it nice when studies confirm your prejudices? But that’s not what they’re claiming

Q: The headline says “Chocolate intake associated with better cognitive function”, doesn’t it?

A: Yes, but the story starts “Eating chocolate improves brain function, regardless of what else you’re scoffing, a study has found.” 

Q: That’s even better! How much did people’s brain function improve?

A: They don’t know

Q: It was mice?

A: No, it was people, but they only measured cognitive function once, so they couldn’t see any improvements.

Q: Ok, how much better was cognitive function in the people given chocolate?

A: No-one was given chocolate; these were free-range participants in a longitudinal study

Q: So at least they measured chocolate intake over time and then looked at cognitive function later on?

A: Sadly, no.

Q: But the story says it was a rigorous study.

A: Yes. Yes it does.

Q: And I suppose the alleged effects of chocolate are really small, right?

A: If the cognitive function score was scaled like IQ, it would be about 3 IQ points.

Q: That’s not tiny

A: Indeed. Especially when you consider that they didn’t measure how much chocolate people ate or what type of chocolate or how much it had of the flavonols they think are responsible. They just divided people into eating chocolate less than once/week, once/week, and more than once/week.

Q: Aren’t flavonols in other things, too?

A: Yes: tea, red wine, a bunch of other favourites for this sort of story

Q: So if it really was flavonols, the true effect must be huge

A: Yes. So it probably isn’t.

Q: What does the research paper say about the cause-effect relationship?

A: “This precludes any conclusions regarding a causal relationship between chocolate intake and cognition from being drawn.”

Q: Ok. That makes sense.

A: On the other hand, they say “It is evident that nutrients in foods exert differential effects on the brain. As has been repeatedly demonstrated, isolating these nutrients and foods enables the formation of dietary interventions to optimise neuropsychological health.”

Q: “Repeatedly demonstrated” that you can give people diets or supplements to make their brains better? Isn’t that the sort of claim where “Name three” is the appropriate response?

A: Pretty much.

February 24, 2016

Super 18 Predictions for Round 1

Team Ratings for Round 1

The basic method is described on my Department home page.

Here are the team ratings prior to this week’s games, along with the ratings at the start of the season.

Current Rating Rating at Season Start Difference
Crusaders 9.84 9.84 0.00
Hurricanes 7.26 7.26 0.00
Highlanders 6.80 6.80 0.00
Waratahs 4.88 4.88 0.00
Brumbies 3.15 3.15 0.00
Chiefs 2.68 2.68 0.00
Stormers -0.62 -0.62 0.00
Bulls -0.74 -0.74 -0.00
Sharks -1.64 -1.64 0.00
Lions -1.80 -1.80 0.00
Blues -5.51 -5.51 -0.00
Rebels -6.33 -6.33 0.00
Force -8.43 -8.43 0.00
Cheetahs -9.27 -9.27 0.00
Reds -9.81 -9.81 0.00
Jaguares -10.00 -10.00 0.00
Sunwolves -10.00 -10.00 0.00
Kings -13.66 -13.66 0.00


Predictions for Round 1

Here are the predictions for Round 1. The prediction is my estimated expected points difference with a positive margin being a win to the home team, and a negative margin a win to the away team.

Game Date Winner Prediction
1 Blues vs. Highlanders Feb 26 Highlanders -8.80
2 Brumbies vs. Hurricanes Feb 26 Hurricanes -0.10
3 Cheetahs vs. Jaguares Feb 26 Cheetahs 4.70
4 Sunwolves vs. Lions Feb 27 Lions -4.20
5 Crusaders vs. Chiefs Feb 27 Crusaders 10.70
6 Waratahs vs. Reds Feb 27 Waratahs 18.20
7 Force vs. Rebels Feb 27 Force 1.40
8 Kings vs. Sharks Feb 27 Sharks -8.50
9 Stormers vs. Bulls Feb 27 Stormers 3.60


Briefly

  • Places“:  Interactive maps of place name distribution in the US. For example “Lake” — with high density in the “Land of Lakes” but also in some less-expected placesplaces
  • “Spreadsheets, the original analytics dashboard’, from Simply Statistics, about the origin of spreadsheets and what they were good for.
  • Cats can see the ‘rotating snake’ optical illusion: video evidence from Rasmus Bååth
  • As we’ve mentioned before, most people think teenagers have more risky behaviours now than in the Good Old Days. Most people are wrong. This time, from Vox.
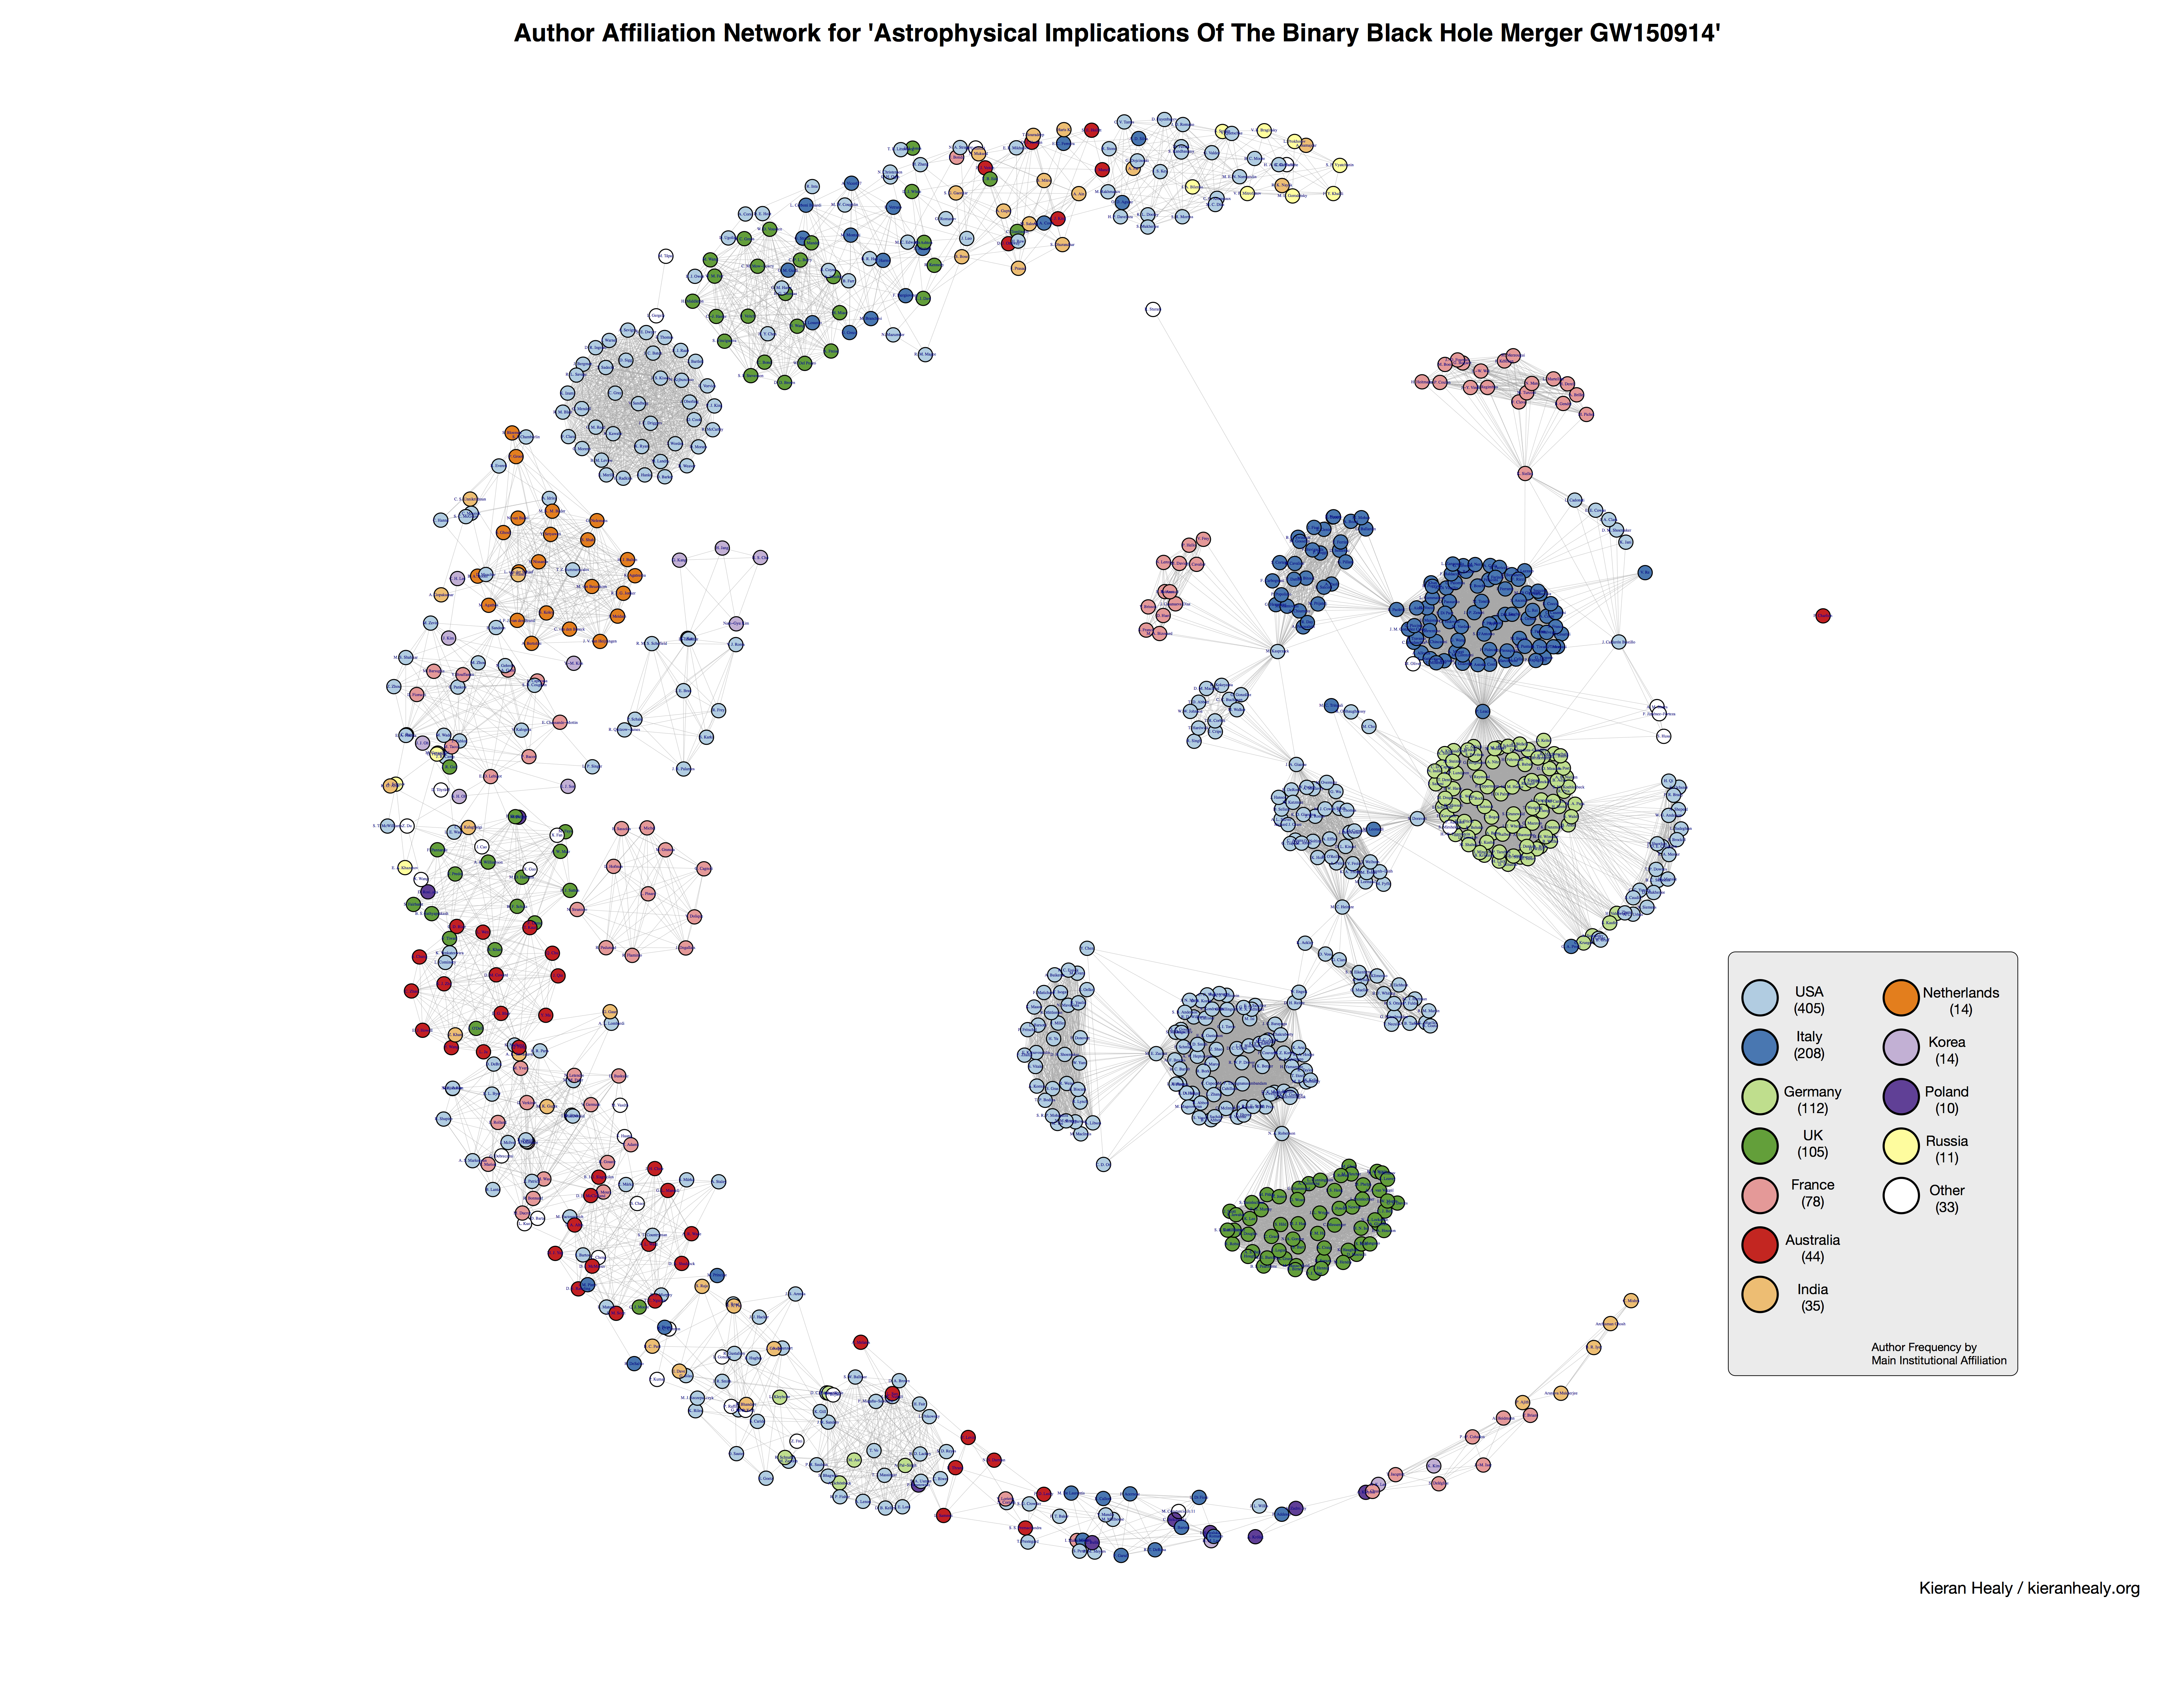
  • From Kieran Healy, the network of shared institutional affiliations for the 1000+ authors of the LIGO gravitational waves paper (click to embiggen). That is, many scientists have some sort of connection with more than one university; the graph shows how these link up the LIGO researchers.
    person-bp-edit
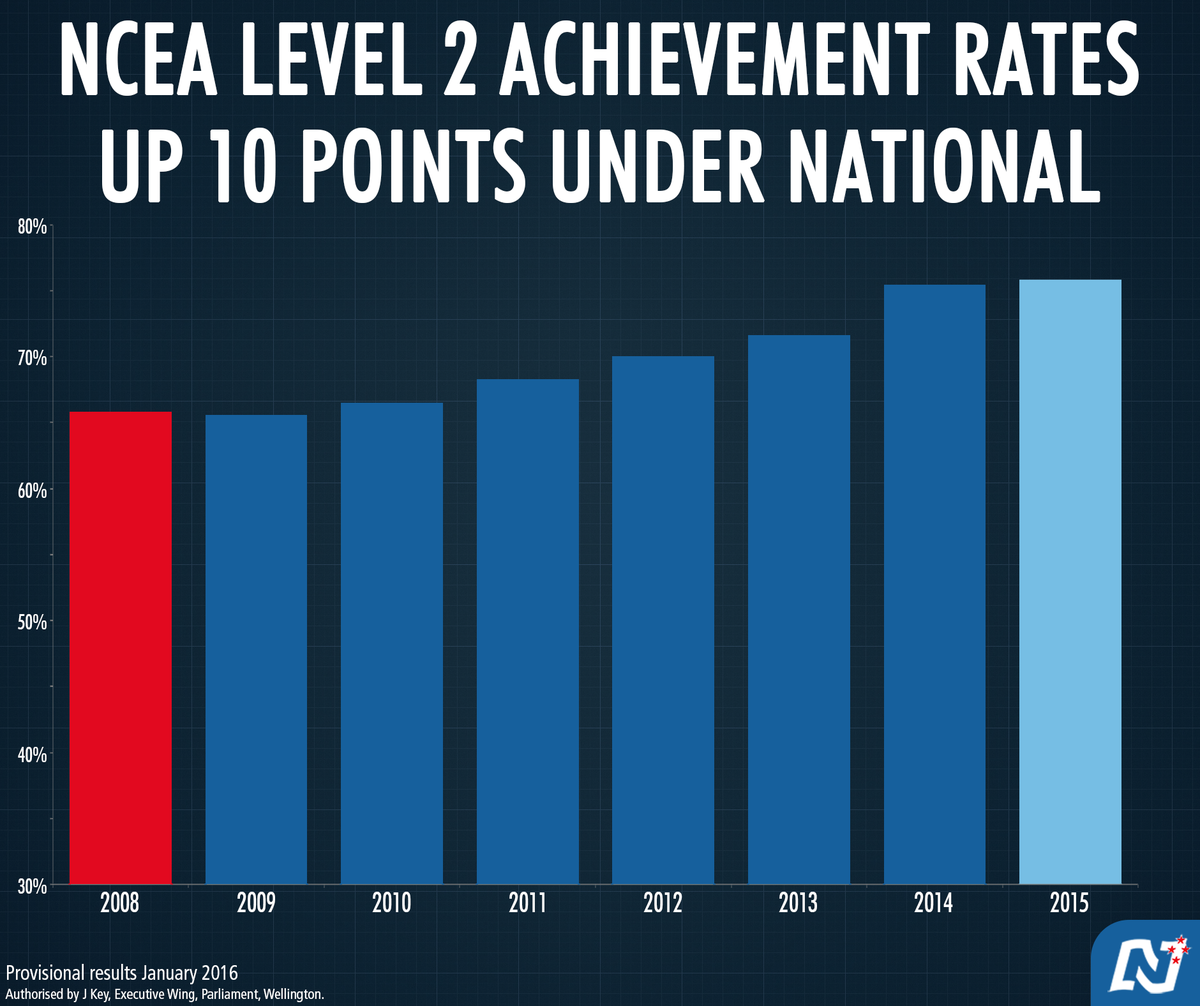
  • Come on, major political parties. Barchart axes start at zero unless you want to look like Fox News. There are reasons for this. If you don’t want to start the axis at zero use some other sort of chart.
    Cb3nqizUYAAnkgu
February 21, 2016

Crushing and crashing

The Herald saysPolice Minister Judith Collins has released figures to show crushing boy racers’ cars has worked“.  The data are more consistent with the political interpretation than is usual for claims about crashes, but not as strong as the Minister would like us to think.

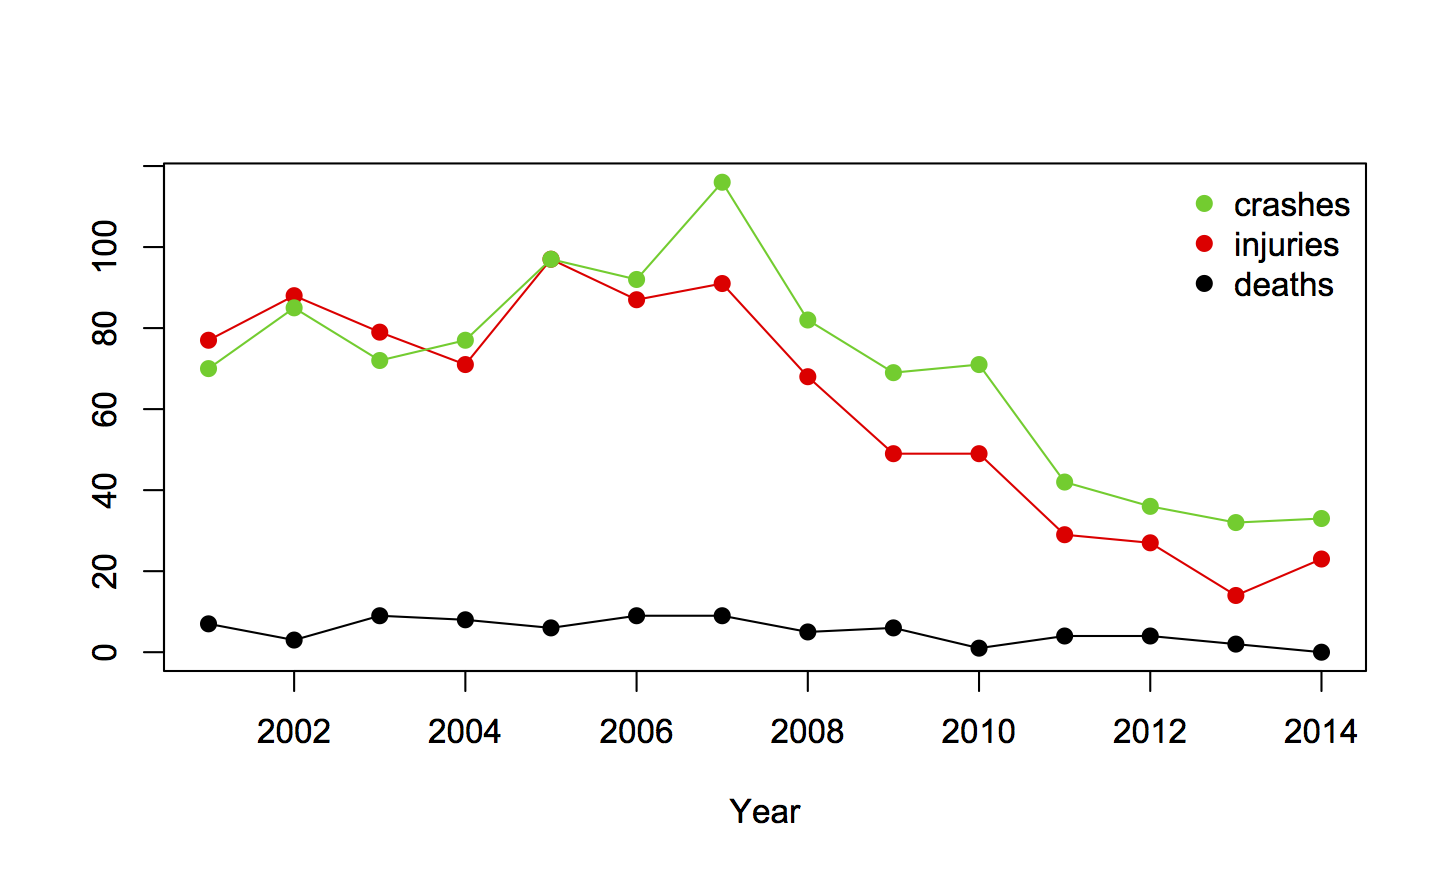
Here’s a graph of the data (supplied to the Herald by the Minister’s office), showing crashes, injuries, and deaths where the police reported ‘racing’ as a cause:

crusher

It’s fairly clear that something changed. Based purely on the graph you’d say the downwards trend started after 2007; 2009 isn’t unreasonable, but it fits the data a bit less well. This an example of a graph being much more useful than a table.

The next thing to check is other crashes — the road toll has been down in recent years, so this could just have been a general improvement. It’s not; the evidence for a change is a little weaker when considering racing deaths or injuries as a proportion of all fatal or injury crashes, but it’s still there.

In principle there could have been changes in reporting, but it’s hard to see how a government crackdown would make police less likely to report ‘racing’ involvement in a crash.

Finally, there’s publication bias.  The reporter, Nicholas Jones, didn’t notice that Ms Collins was back and decide to pull figures on car crushing; the Minister decided to release the figures. She wouldn’t have done that if they didn’t look favourable. It’s hard to tell how much to discount the evidence for that, but a discount is needed.

Overall, the data are definitely consistent with a deterrent effect of car crushing, but the evidence isn’t all that strong — the best fit to the data suggests things changed earlier than 2009, and looking at the numbers was the Minister’s idea, not the reporter’s.


Updates:

  • in addition to the useful comments, I’ve been pointed to Dog & Lemon where Clive Matthew-Wilson says there is reason to believe the ‘boy racer’ thing was already going away on its own.  If so, that would fit the trend starting earlier than the legislation.
  • If you check the crash numbers against the Road Crash Statistics system they don’t match.  I think that’s because Table 26 of the Road Crash Statistics only includes crashes causing injury or death — that’s explicit in the 2012 spreadsheet, and I think it’s still true.
February 16, 2016

Models for livestock breeding

One of the early motivating applications for linear mixed models was agricultural field studies looking at animal breeding or plant breeding. These are statistical models that combine differences between groups of observations with correlations between similar observations in order to get better comparisons.

John Oliver’s “Last Week Tonight” argues that these models shouldn’t be used to evaluate teachers , because they have been useful in animal breeding (with suitable video footage of a bull mounting a cow).  It’s really annoying when someone bases a reasonable conclusion on totally bogus arguments.

As the American Statistical Association has said on value-added models for teaching (PDF), the basic idea makes some sense, but there are a lot of details you have to get right for the results to be useful. That doesn’t mean rejecting the whole idea of considering the different ways in which classes can be different, or giving up on averages over relevant groups. On the other hand, the mere fact that someone calls something a “value-added model” doesn’t mean it tells you some deep truth.

It would be a real sign of progress if we could discuss whether a model adequately captures educational difficulties due to deprivation and family advantage without automatically rejecting it because it also applies to cows, or without automatically accepting it because it has the words “value-added.”

But it probably wouldn’t be as funny.