Posts filed under General (3156)

February 2, 2016

Not everything is a breakthrough. But.

Jack Scanlan, at Lateral

Steps could be taken to reduce the hype associated with every tiny step towards curing a disease or developing a new technology, but the trade-off would be a reduction in the amount of science making its way to the public.

Helpful prediction vs recycled prejudice

From What World Are We Building?  by danah boyd

One of the perennial problems with the statistical and machine learning techniques that underpin “big data” analytics is that they rely on data entered as input. When the data you input is biased, what you get out is just as biased. These systems learn the biases in our society, and they spit them back out at us.


January 27, 2016

Meet Statistics summer scholar Xiangjie Xue

XiangjieEvery summer, the Department of Statistics offers scholarships to a number of students so they can work with staff on real-world projects. Xiangjie, right, is working on vector generalized linear and additive models (VGAM) for R with Dr Thomas Lee. Xiangjie explains:

“I am trying to help Dr Yee to improve the functionality of the VGAM package. This includes writing some functions from scratch, improving the efficiency of the existing functions and testing functions. To do this, I will need to learn the underlying structure of R and write or translate some functions from other computing languages to C or R.

“I came to the University of Auckland to do my undergraduate Applied Mathematics and Operations Research in 2012.

“After I finished, I received offers to do both Applied Mathematics and Statistics. When I was trying to decide the topic of my Honours project, I realised that Statistics covers a very broad range of topics and that they are very closely related to each other – I could learn data analysis, computing or probability theory and stochastic processes. All of these topics are really useful in our daily lives. I was really fascinated by this, so I decided to study Statistics instead of Applied Mathematics. I am thinking about pursuing a masters degree or a PhD in Statistics this year.

“This summer, I am hoping to travel more in New Zealand. In fact I went camping recently with my high-school friends in Whangarei and the Bay of Islands region and I had a great time. Besides travelling, I’d like to spend some time relaxing at home, watching my favourite shows.”


January 25, 2016

Briefly

  • “Claims that forensic experts can match a bullet or shell casing found at a crime scene to a specific weapon lack a scientific basis and should be barred from criminal trials as misleading, a D.C. Court of Appeals judge wrote this week.”  The judge objected to claims that the evidence proved a ‘unique’ match. And quite right, too.
  • You can prove that a treatment works without knowing how it works, but it’s much harder to find treatments that way. Lithium for bipolar and other mood disorders is an excellent example
  • You might have heard of CRISPR in the news and wondered what exactly it was.  It’s a technique for cutting DNA at very easily customised locations, for example, to allow for new sequences to be inserted. Good references

Meet Statistics summer scholar Eva Brammen

photo_brammenEvery summer, the Department of Statistics offers scholarships to a number of students so they can work with staff on real-world projects. Eva, right, is working on a sociolinguistic study with Dr Steffen Klaere. Eva, right,  explains:

“How often do you recognise the dialect of a neighbour and start classifying them into a certain category? Sociolinguistics studies patterns and structures in spoken language to identify some of the traits that enable us to do this kind of classification.

“Linguists have known for a long time that this involves recognising relevant signals in speech, and using those signals to differentiate some speakers and group others. Specific theories of language predict that some signals will cluster together, but there are remarkably few studies that seriously explore the patterns that might emerge across a number of signals.

“The study I am working on was carried out on Bequia Island in the Eastern Caribbean. The residents of three villages, Mount Pleasant, Paget Farm and Hamilton, say that they can identify which village people come from by their spoken language. The aim of this study was to detect signals in speech that tied the speaker to a location.

“One major result from this project was that the data are sometimes insufficient to answer the researchers’ questions satisfactorily. So we are tapping into the theory of experimental design to develop sampling protocols for sociolinguistic studies that permit researchers to answer their questions satisfactorily.

“I am 22 and come from Xanten in Germany. I studied Biomathematics at the Ernst-Moritz-Arndt-University in Greifswald, and have just finished my bachelor degree.

“What I like most about statistics is its connection with mathematical theory and its application to many different areas. You can work with people who aren’t necessarily statisticians.

“This is my first time in New Zealand, so with my time off I am looking forward to travelling around the country. During my holidays I will explore Northland and the Bay of Islands. After I have finished my project, I want to travel from Auckland to the far south and back again.”

January 24, 2016

Tracing a data factoid

I saw on Twitter this morning the claim “90% of the worlds data was created in the last 12 months”, raising the twin questions “Says who?” and “What does that even mean?”.

The tweet linked to a story at the Huffington Post, which attributed the claim to Constellation Research, but with no further information on how they found it out or when, or what they meant by it. Further Google searches find that most occurrences of the claim are either completely unsourced, attributed to the guy who wrote the HuffPo story, or also just say “Constellation Research”.

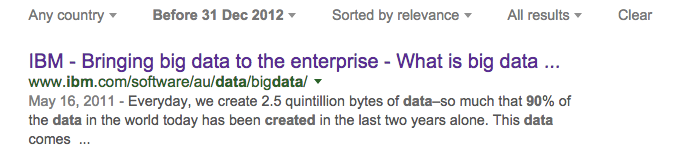
IBM has claimed “Everyday, we create 2.5 quintillion bytes of data–so much that 90% of the data in the world today has been created in the last two years alone.” But that’s two years, not 12 months. And they’ve been saying it for some time:
ibm

In 2012, the skeptics site at stackexchange.com discussed the IBM claim and found it plausible then — assuming that ‘data has been created’ meant that ‘data has been stored in some permanent medium of the sort IBM sells’. It’s not just business data, as some of the citations imply — it will include cat videos on mobile phones, data from the Large Hadron Collider, the NSA’s archive of your email, and lots and lots of porn.

It still could be that Constellation Research has a new estimate, not the recycled one from the days before Siri. However, a 2015 Oracle presentation (PDF, slide 7) says “90% of the world’s data has been created in the last two years“, and cites “ Constellation Research: “Businesses Must Answer the Call for Cloud Based Integration”“. So I’m guessing maybe not.

January 22, 2016

There’s nothing like a good joke

Q: Did you see that laughing can burn as many calories as a brisk walk?

A: In the Herald? Yes.

Q: Can it?

A: A very short brisk walk, yes.

Q: What do you mean?

A: They say “flat out, uncontrollable, roll on the floor howling – was found to burn 120 calories an hour, similar to the amount burnt by walking at a moderate pace.”

Q: So you just need to do that for an hour, nonstop?

A: That’s right.

Q: This was a British scientist, right?

A: ….yes?

Q: The BBC has pretty good comedies

A: Not that good

Q: Do they have any real estimates of how much exercise you could get?

A: Not in the Herald, but another newspaper says their estimated maximum for the funniest show they looked at was 32 ­calories of laughter over 45 minutes.

Q: So like a quarter of an hour of brisk walking?

A: Pretty much

Q: Which show?

A: Taskmaster

Q: ?

A: I think you had to be there.

Q: And how about humour producing wry smiles and the occasional snigger?

A: That burns about as much energy as reading blogs.

Q: It doesn’t sound like a serious suggestion. Is it possible that the papers which printed this story just didn’t get the joke?

A: Could easily be.

January 21, 2016

Meet Statistics summer scholar David Chan

David ChanEvery summer, the Department of Statistics offers scholarships to a number of students so they can work with staff on real-world projects. David, right, is working on the New Zealand General Social Survey 2014 with Professor Thomas Lumley and Associate Professor Brian McArdle of Statistics, and  Senior Research Fellow Roy Lay-Yee and Professor Peter Davis from COMPASS, the Centre of Methods and Policy Application in the Social Sciences. David explains:

“My project involves exploring the social network data collected by the New Zealand General Social Survey 2014, which measures well-being and is the country’s biggest social survey outside the five-yearly census. I am essentially profiling each respondent’s social network, and then I’ll investigate the relationships between a person’s social network and their well-being.

“Measurements of well-being include socio-economic status, emotional and physical health, and overall life satisfaction. I intend to explore whether there is a link between social networks and well-being. I’ll then identify what kinds of people make a social network successful and how they influence a respondent’s well-being.

“I have just completed a conjoint Bachelor of Music and Bachelor of Science, majoring in composition and statistics respectively.  When I started my conjoint, I wasn’t too sure why statistics appealed to me. But I know now – statistics appeals to me because of its analytical nature to solving both theoretical and real-life problems.

“This summer, I’m planning to hang out with my friends and family. I’m planning to work on a small music project as well.”


January 18, 2016

Meet Statistics summer scholar Oliver Stevenson

Oliver StevensonEvery summer, the Department of Statistics offers scholarships to a number of students so they can work with staff on real-world projects. Oliver, right, is working on visualising conservation data with Associate Professor Rachel Fewster. Oliver explains:

“This summer project is called Maps, graphs, and data analysis for community conservation projects, and builds on my Honours project from the past year. It involves developing interactive applications that automate the display of catch data from various conservation projects around New Zealand.

“The aim of this project is to allow volunteers to engage with their data in more depth than ever before. After a day in the field, a conservation volunteer is able to go online and use these applications to produce maps or graphics to view their day’s work. The graphics illustrate exactly how a volunteer’s work is impacting their local environment and will ideally keep them motivated to continue with what they are doing.

“I graduated from the University of Otago in 2014 with a Bachelor of Science majoring in Statistics and minoring in Psychology, before completing an Honours degree in Statistics at the University of Auckland in 2015. In 2016, I plan on pursuing a Master of Science in statistics, completing this degree as a research masters.

“I enjoy statistics due to its numerous applications. Nowadays, data exists in almost every facet of life, and wherever there is data, we can use statistics to try and gain a deeper understanding of what is really going on around us.

“In my spare time this summer, I will, hopefully, be able to watch the Black Caps as they continue with their summer of cricket.”


January 15, 2016

Meet Statistics summer scholar Hubert Liang

Every summer, the Department of Statistics offers scholarships to a number of students so they can work with staff on real-world projects. Hubert, right, is working on ways to graphically represent community conservation effHubert Liangorts with Associate Professor Rachel Fewster. Hubert explains:

“Conservation efforts are needed to protect the natural flora and fauna of our beautiful country. This exciting project involves preparing and analysing data collected from volunteers involved in conservation efforts against pests such as rats.

“The data is analysed and uploaded to a website called CatchIT, which is an interactive website that allows the bait and trap information to be presented in graphic form to volunteers, which provides feedback on their pest-control efforts. The data comes to life on the screen, and this engages current and future volunteers in tracking the success of their pest-control projects.

“I am in the final year of my Bachelor of Science majoring in Statistics and Biological Science, having previously finished a Bachelor of Pharmacy (Hons). Statistics has a wide applicability to a wide range of disciplines, and appeals to me because I am passionate about the simple process of getting the most from raw data. It is a very rewarding process knowing that you can make the data more appealing and important to the end user.

“This summer, besides doing this studentship, I’ll be enjoying the sunshine, and relaxing on the beach with family and friends.”