Posts filed under General (3156)

January 14, 2016

Meet Statistics summer scholar Alexander Stuteley

Every summer, the Department of Statistics offers scholarships to a number of students so they can work with staff on real-world projects. Alexander, right, is exploring New Zealand mortality data with Senior Research Fellow Andrew Sporle. Alexander explains:Alexander Stuteley

“The goal is to construct an online data visualiser that will enable the user to analyse and visualise complex population data by simply pointing and clicking from a selection of menus.  This involves collating health and population data and creating software that automatically does the complex statistical calculations based on the user’s selections, but in a way that ensures the confidentiality of the information. This project is part of a larger project on preventable Māori mortality funded by the Health Research Council.

“Our health infrastructure in New Zealand has some of the best and most comprehensive datasets available in the world and, it will be very useful to streamline the analysis process so that users without advanced statistical training can see and understand what is going on. In the longer term, this approach could also be applied to other health and social data, making data more accessible and useful.

“I have recently finished my undergraduate degree in science, majoring in statistics and computer science. I am looking to progress in medical statistics for my honours degree.

“Statistics appeals to me because I am passionate about figuring out ways to develop and enhance understanding between cause and effect, and use that to make improvements – whether small or large, intricate or structural – to whatever situation I find myself in.

“Over summer, I hope to fit in some travel, try to get to the beach, and go tramping; Great Barrier Island will be the first port of call.”



January 13, 2016

New UK alcohol recommendations

From David Spiegelhalter, at the Understanding Uncertainty blog

Last week, the Chief Medical Officer announced new guidelines for alcohol consumption. The summary says:

‘The proposed guidelines and the expert group report that underpins them, have been developed on the basis of the following principles: People have a right to accurate information and clear advice about alcohol and its health risks.

‘There is a responsibility on government to ensure this information is provided for citizens in an open way, so they can make informed choices.’

This admirable aim of treating the public as adults capable of making up their own minds seems in stark contrast with the authoritarian tone of publicity from the Department of Health, which baldly says: ‘Men should not drink more than 14 units of alcohol each week, the same as women’.

Read the rest

January 12, 2016

When it’s still not worth playing the lottery

Following up on the recording-breaking Powerball jackpoint in the US, there’s a story on Time.com headlined “The One Time It’s Mathematically Advantageous to Play Powerball.”  They’re still wrong, but they have taken many more of the relevant factors into account than usual, and it’s definitely worth reading.

On top of the microscopic chance of getting the winning numbers, they also look at the likelihood that you will have to share the jackpoint, the benefit of the minor prizes,  the US federal tax payable on the winnings, and the fact that the advertised payout is actually inflated by about 60% — it’s the total future payment for a 30-year annuity you can buy with the prize, not the value of the prize itself.

They come to the conclusion that a jackpot worth more than about $2.2 billion is worth buying tickets for, in the sense that it has positive expected cash return.  The one thing they don’t take into account is the non-linear utility of money. Two billion dollars isn’t actually worth two billion times as much as one dollar, unless you’re the US government or something.  If this sounds strange, all that it’s saying is that each extra dollar is worth more to you than it is to a billionaire.

The diminishing value of extra money means that playing the lottery basically can’t be worthwhile if you evaluate it in terms of winning. The only way playing the lottery can make sense is if you get enough enjoyment from thinking about winning to be worth the upfront cost.

January 11, 2016

Meet Statistics summer scholar Christopher Nottingham

Chris NottinghamEvery summer, the Department of Statistics offers scholarships to a number of students so they can work with staff on real-world projects. Christopher, right, is working with Associate Professor David Scott on All Blacks-related data. Christopher explains:

“My project is aimed at predicting the career lengths of current and future All Blacks based on data from all of the past All Blacks. This project will be useful as it will aid the planning within the All Blacks camp.

“This coming year, I will be studying a research-based MSc in Statistics. My thesis is in the area of quantitative fisheries science and will involve translating ADMB code into STAN code.

“Statistics appeals to me because of its diversity. For example, one day you could be analysing fisheries data, and the next, data relating to the All Blacks.

“In my spare time I enjoying walks along the beach, sailing and cycling around the waterfront with my wife.”


January 6, 2016

Meet Statistics summer scholar Katie Fahy

Every summer, the Department of Statistics offers scholarships to a number of students so they can work with staff on real-world projects. Katie, right, is working on the New Zealand Socio-Economic Index with Dr Barry Milne of COMPASS (Katie FahyCentre of Methods and Policy Application in the Social Sciences) and Professor Alan Lee from the Department of Statistics. Katie explains:

“The New Zealand Socio-Economic Index (NZSEI) assigns occupations a score that enables us to measure the socio-economic status of people in that occupation. It’s calculated using the average age, income and education level of people with each job. For example, doctors would have a very high socio-economic index, because they’re typically high-earning and well-educated people.

“The NZSEI has been created from Census data since the 90s, but has not yet been updated for the most recent Census in 2013. In this project, my job is to update the NZSEI using path analysis, and check that this updated version is appropriate for all people in New Zealand. A couple of examples include assessing that the index is valid for all ethnicities, and valid for workers in both urban and rural regions.

“The index is important to measure any changes to New Zealand over time, as it is updated with each Census. As well as this, the NZSEI uses a similar methodology to international scales, so international comparisons are possible.

“I am currently in my third year of studying Mathematics and Statistics at the University of Sheffield in England, and I’m halfway through my year here in Auckland as an exchange student. I’ve always been interested in Statistics and studying it at university level has shown me how applicable it is in a variety of fields, from finance to biology.

“Over the summer, I’m looking forward to exploring New Zealand more.”


January 5, 2016

Some things don’t need exaggerating

Stuff:

The Dow Jones industrial average was set for its worst start to a year since 1932 as stock markets tanked after weak Chinese economic data reignited fears of a global slowdown.

Herald

The U.S. blue-chip index tumbled toward its worst start to a year since 1932, while banks and technology shares led the Standard & Poor’s 500 Index lower.

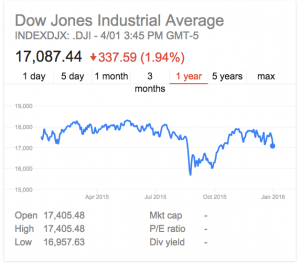
That’s presumably true, and bad news, but “start to a year” is doing a lot of work. Here’s the past year’s Dow:

dow

Unless there’s something especially predictive about the first trading day of the year, this is no worse than some quite recent days. And, the Herald says further down in the story

S&P Dow Jones Indices data indicate the first day of trading has no predictive power for the rest of the year. The index ends the year in the same direction it takes on the opening day 50.6 percent of the time, the data show. The first month of the year has proved more telling — the gauge’s return in January determines its direction for the year 72.4 percent of the time.


New things to read

Lateral is a relatively new science magazine produced by a bunch of mostly Australian, mostly young over-achievers. Their sixth issue is about Data.

And I think I’ve mentioned STAT, the new health and medicine (and not statistics) news site, but it’s worth mentioning again.

January 3, 2016

Briefly

  • True-colour photos of Earth from space — why it’s not as simple as that, by Emily Lakadawalla
  • “The ranks of the wealthy grew in 2013, with 1.38 million households making it into the Top 1%, up from 1.36 million a year earlier.”  From CNN Money (who should understand percentages) via Felix Salmon
  • Translation of international new reprints matters. The Herald had a headline “North Pole now 50 degrees above normal“, which was 50 Fahrenheit degrees. In NZ terms, just under 30 Celsius degrees.
  • From the Christmas edition of BMJ, famous for its joke (but accurate) articles, a functional MRI imaging study comparing people who do and don’t celebrate Christmas, found differences in brain activation. These differences could be argued as a biological “Christmas Spirit” locus, plausible in terms of previous research.  The point, obviously, is how easy it is to overinterpret such things.
  • A group in the US did a randomised, blinded trial to see what effect faster internet speeds would have: they raised the bandwidth for 1500 people from 105Mbps to 250Mbps without telling them. People used the internet more, and it wasn’t primarily the heaviest users whose use increaseed.

Meet Statistics summer scholar Jale Basten

Jale BastenEvery summer, the Department of Statistics offers scholarships to a number of students so they can work with staff on real-world projects. Jale, right, is exploring evolutionary relationships with Dr Steffen Klaere. Jale explains: 

“To understand the evolution of life on earth, we need to make inferences about evolutionary events leading up to the diversity of life we see now. My project is about phylogenetic inference – the set of bioinformatic tools for estimating evolutionary relationships between different species, or taxa.

“The set of taxa and their divergence is usually represented by a DNA-sequence alignment. The basic assumption is that each sequence represents a taxon and the evolutionary divergence between species is identified by differences in the respective sequences. The relatedness of taxa is then represented by a phylogenetic tree, where closely-related species are identified with leaves that are close together in the tree.

“In my project, I will investigate different statistics to assess the fitness between model and data. In particular, I am interested in identifying sites in the alignment that are not well represented by the model.

“It has been established that alignments for species with an old, most common recent ancestor will have more sites that will not inform the phylogenetic hypothesis. Such sites are often called saturated sites due to the assumption that they accumulated a lot of mutations over time. It has been hypothesised that such sites can lead to systematic error in the inference.

“That is why we want to identify influential outliers and mask them for the inference. Statistics like observed variability (OV) distances have been proposed, which are easier to compute, but tend to overestimate the number of saturated sites.

“My task will be to investigate methods that propose to identify saturated sites and test them on datasets known to suffer from systematic error. In particular, I want to test the utility of combining different statistics to address such problems.

“I am from Duelmen in Germany, but I have lived and studied in Greifswald for the past three years. I have just completed my Bachelor of Science in Biomathematics at the University of Greifswald. After this research project, I would like to pursue my Master of Science in Statistics at the University of Dortmund, also in Germany.

“What I like about statistics is that it has a wide area of use and deals with diverse topics in biology, medical science and economics. Furthermore, I like that statistics deals with all aspects of data, including the planning of data collection in terms of the design of surveys and experiments. You can work together with people from different institutions and you benefit from the different knowledge they bring.

“As I have some free time over Christmas and New Year, I am thinking about travelling to the Bay of Islands to spend some time at the beaches and enjoy the beautiful countryside. After the research project, I will also have some time to travel to the South Island before flying back to Germany.”


December 31, 2015

One of those end of year post thingies

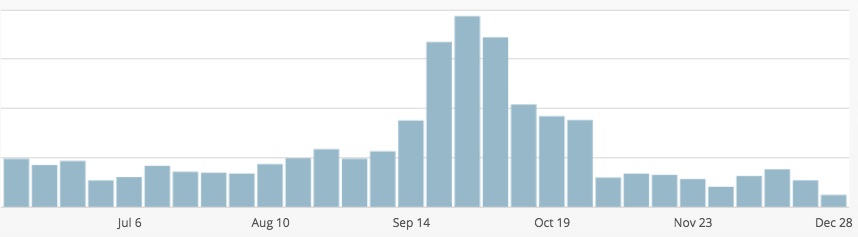
The most obvious thing in the StatsChat logs: the Rugby World Cup:

rugby

Also, back last January, there was a study on the relationship between cell divisions and cancer risk across human tissues. The popular misinterpretations of the research — “cancer is mostly bad luck” — led to our most popular post ever.

The question of what it means for something to be a Group I carcinogen gets us a lot of low-level traffic, but interest peaked after the IARC report on red meat and processed meat.

Posts on the risk posed by foreign drivers were popular early in the year. In July, though, they were displaced by foreign-sounding home buyers.

I wrote about the largest human randomised controlled trial of mānuka honey to prevent illness, when it was reported in June. It was done by kids at a London primary school. They didn’t find a benefit.

Finally, there’s a steady trickle of people interested in the mathematics of the lottery, presumably in the mistaken hope that we’ll tell them how to beat the martingale optional sampling theorem.