Posts filed under General (3156)

December 17, 2015

Briefly

  • “Polls Suggest Trump Will Win Between 8 Percent And 64 Percent Of The Vote”: on the actual predictive accuracy of polls this far in advance, from 538.
  • A social-network analysis to find which European Union staff members are most worth influencing
  •  

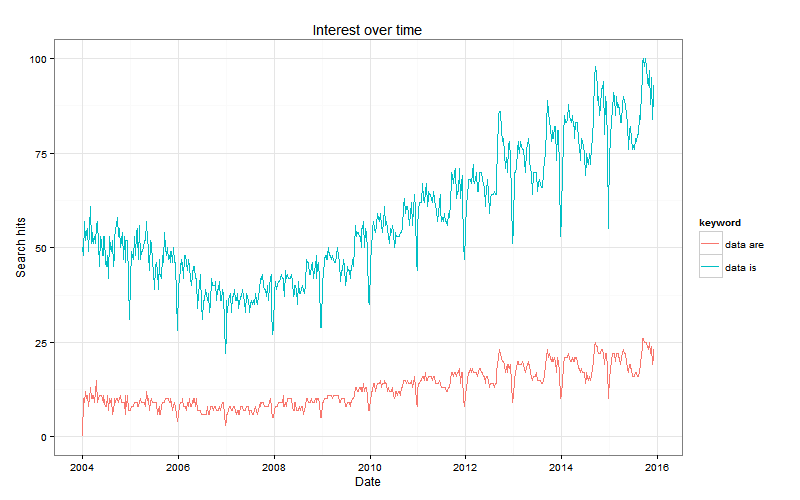
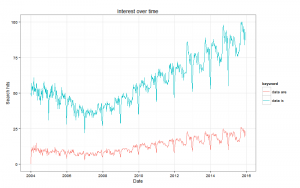
  • Google trends for “data is” vs “data are”. The red line is people correctly treating ‘data’ as plural; the blue line is people correctly treating ‘data’ as a mass noun. (via David Smith)

    6a010534b1db25970b01b7c7f7cbc8970b

December 14, 2015

New StatsNZ data interface


The service lets you click on a map and see data for that location (eg, that meshblock).  You can also download the data and map information, or write computer queries to its API.

Briefly

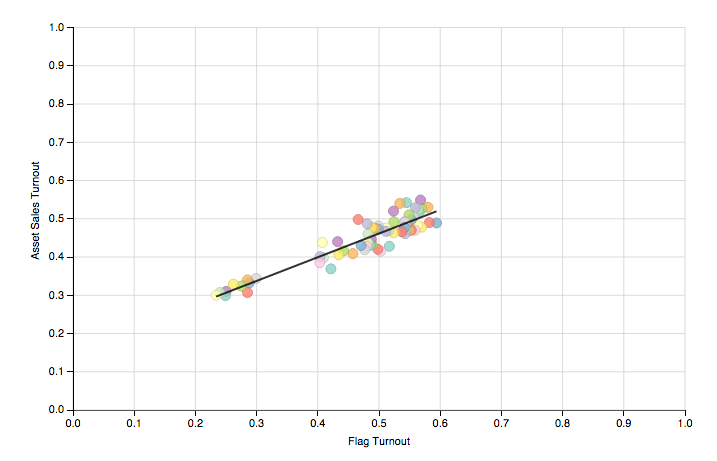
  • Andrew Chen has some interestingly boring graphs of election turnout:
    flagout
    Voting in referendums is lower than in general elections, but in a fairly uniform way.
  • The Herald, which usually does better than this, ran a story about voting intentions for round two based on a bogus clicky poll
  • “What’s the likelihood you will run into a 0-4 year to lighten up your day? “  In Vancouver, toddlers tend to live in apartments. (via @vb_jens)
  • ” 70% Of Iran’s Science And Engineering Students Are Women”  from Amy Guttman at Forbes
December 11, 2015

Flag notes

So, the preliminary count is up and it’s a victory for opinion polling, if not aesthetics.

As the UMR poll predicted, the two Lockwood ferns were very close, and everything else was well back.  Red Peak did a bit worse than in the opinion poll.

It’s notable that each of the two Lockwood ferns got more votes than Red Peak, Hypnoflag, Qualmark Fern, Informal, and Invalid put together.

It is, of course,  theoretically possible that there is a Condorcet winner other than one of the Lockwood ferns, because almost anything is theoretically possible in voting-system maths. All you’d need is about three-quarters of the votes ending up at each fern at stage 3 to have Red Peak rather than the other fern next on their preference list.

December 10, 2015

#!;@? punctuation


From Stuff

Ending your texts with a full stop is truly monstrous. We all know this. Grammar be darned, it just doesn’t look friendly.

Now a study has confirmed it. Researchers led by Binghamton University’s Celia Klin report that text messages ending with a full stop are perceived as being less sincere, probably because the people sending them are heartless.

Or from The Wireless, which at least knows what ‘grammar’ means:

Researchers at the University of Binghamton in the US have released a study concluding that the full stop is evil. Or, in their own words: “Inclusion of a sentence-final period in text messages affects readers’ perception of the sincerity of the messages”. 

The quote is correct; that is what the researchers said! But as graphics guru Edward Tufte points out, one of the characteristics of numbers is that they have a magnitude as well as a direction!

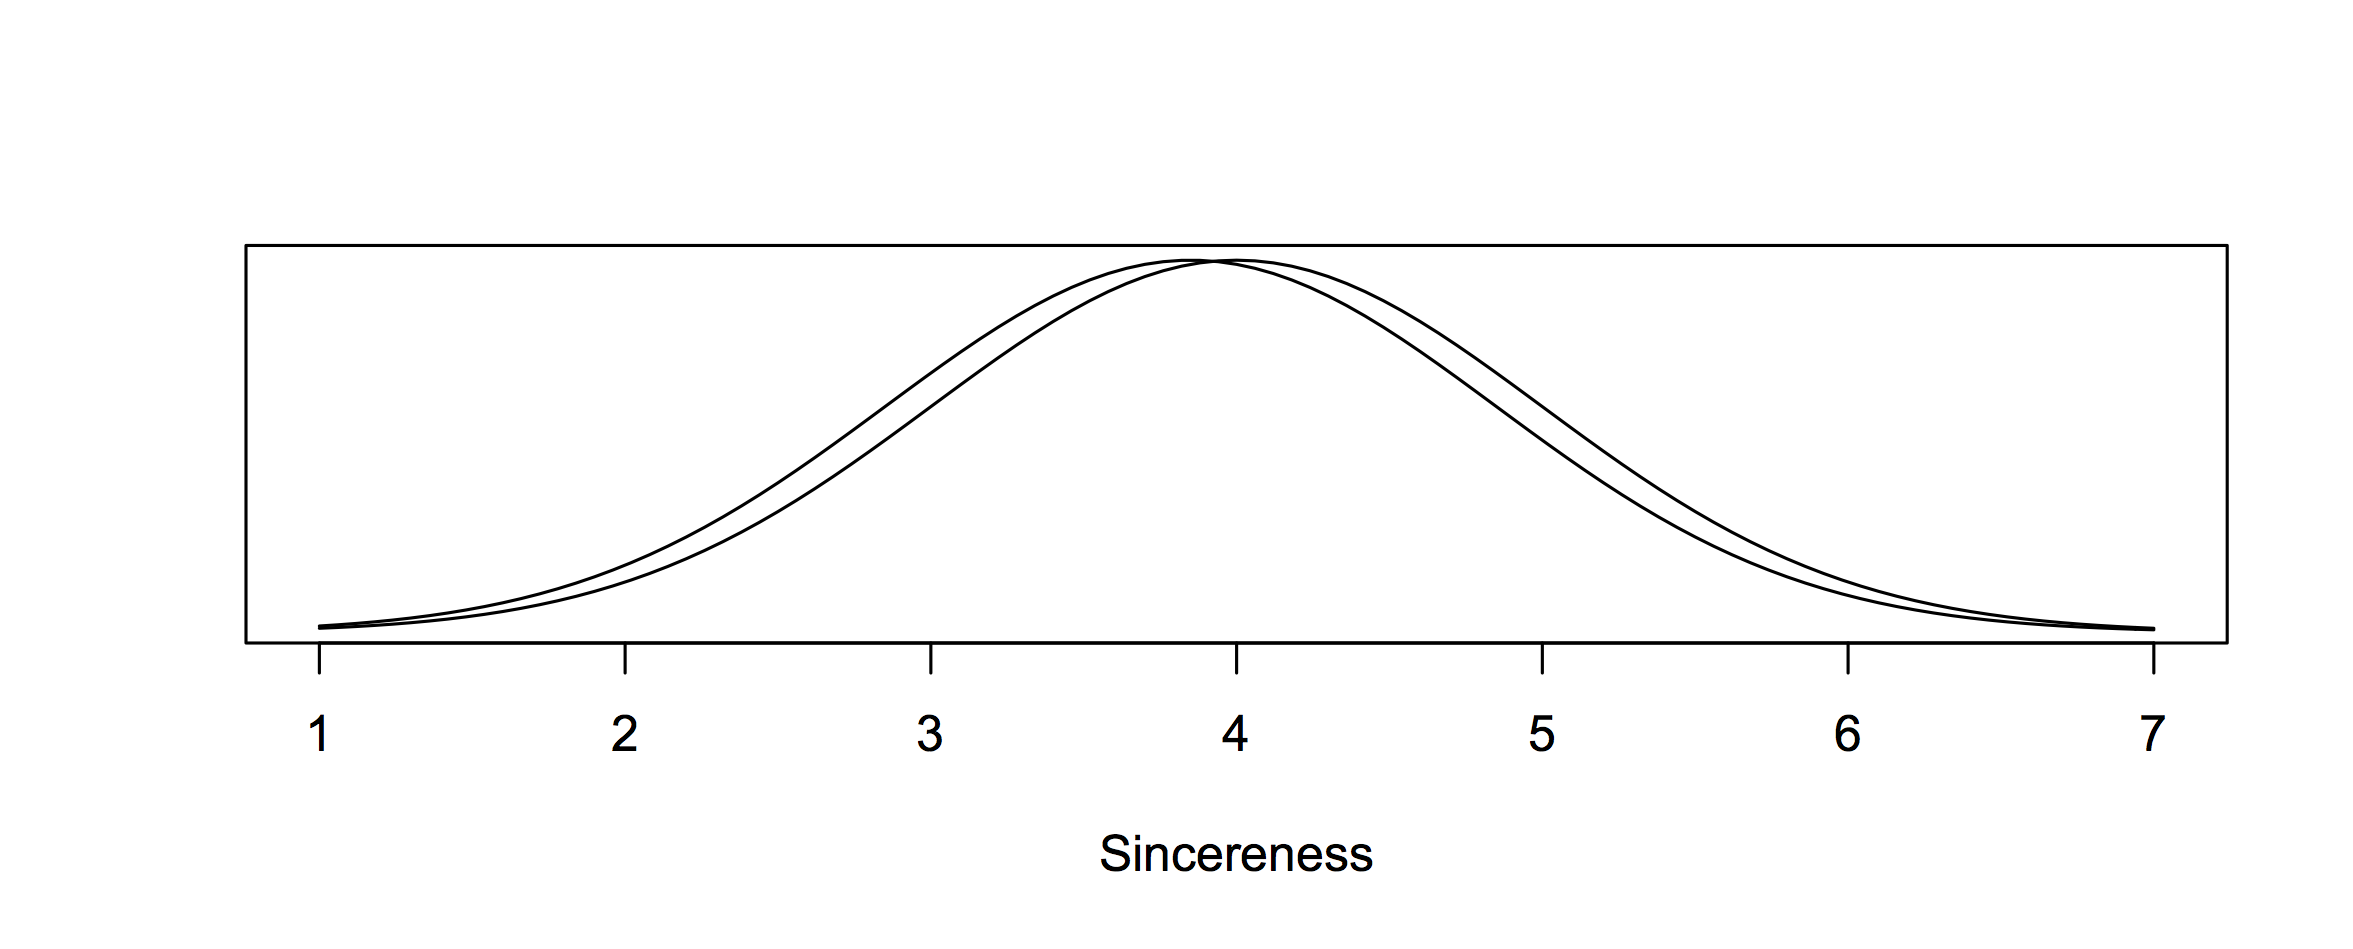
How evil is the full stop? Well, assuming the people you text have the same assumptions about writing as undergraduate students in upstate New York, the following graph gives a picture! These are two Normal distributions with the mean and variance that the researchers found for messages with and without a full stop!

 sincereness  

Truly monstrous and evil!!

The press release also says

In some very recent follow-up work, Klin’s team found that a text response with an exclamation mark is interpreted as more, rather than less, sincere.

That’s a relief!!!!

December 9, 2015

Briefly

  • “Clearly, they had to train the model against some existing data set, and the one they chose was Nazi Germany in the run-up to Operation BARBAROSSA.” There are newly declassified documents about the USSR’s computer model for the risk of a US surprise attack.  As Alex Harrowell writes “The neural network that classifies cat photos must by definition contain enough information to make a random collection of pixels catlike, although uncannily not quite right. Similarly, RYAN picked up a lot of unrelated data and invariably made it vaguely Hitler-y.”
  • The usually-reliable New York Times has an infographic saying luxury hotels spend $1200 per room per month on bathroom products. Felix Salmon doesn’t believe it. Neither do I.
  • As I’ve pointed out from time to time, you don’t have to choose which of the AA and the petrol companies to believe about costs and prices: MBIE monitors the ‘importer margin’ on a weekly basis.
  • A book recommendation list from people involved with the UK charity Sense about Science
  • A description of how an infographic about bacteria in house dust was designed, at Scientific American
November 27, 2015

To find the mind’s construction near the face

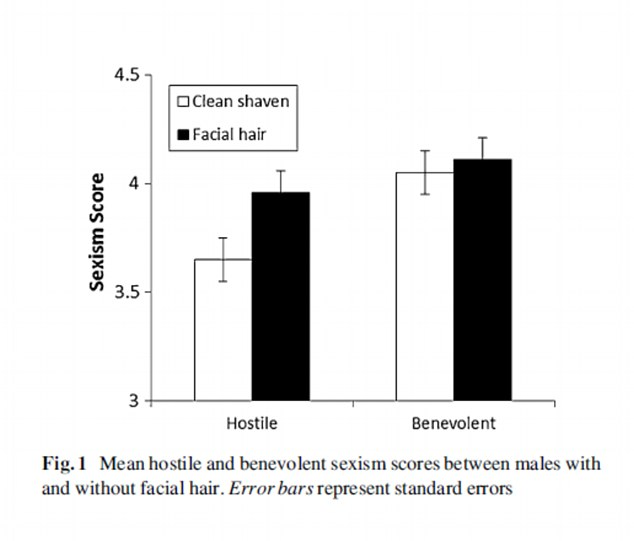
Q: This Herald photo caption says “Men with facial hair showed much higher levels of hostile sexism, the study found.”  Did it?

A: No.

Q: Ok, how about the introduction “Bearded men will just have to take it on the chin – they are, apparently, more sexist.”?

A: Not really.

Q:  <sigh> Was this mice again?

A: No, there aren’t good animal models for these variables, as far as I know.  It was people.

Q: University students?

A: No, that’s so five years ago. It was a survey on Amazon’s Mechanical Turk, of men from the US and India.

Q: A representative survey?

A: Well, they paid people US$0.25 to participate, so I’m guessing maybe not. It’s probably better than using an undergraduate psychology class, though.

Q: And they measured sexism and beards over the internet?

A: The sexism was a standard questionnaire, so I think we should accept it. The participants were shown a set of facial hair images and asked to pick what their facial hair looked like. Probably ok, too.

Q: And men with beards were the most sexist?

A: No, men with moustaches, goatees, or soul patches.

Q: Then men with beards?

A: Then ‘light beards’, then light and heavy stubble, then heavy beards, then clean-shaven, then light medium beards.

Q: So it’s not primarily beards, it’s more other sorts of facial hair?

A: That’s what the study suggests

Q: Just like the photo caption?

A: Up to a point. “Much higher” is pushing it.

Q: How much higher?

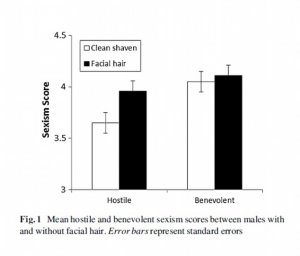
A: About a third of a point, on a six point scale. About 1.5% of the variation between men could be predicted by their facial hair.

Q: Is there a bar chart, perhaps cut off at some non-zero value?

A: You’ve been reading the Daily Mail, haven’t you? Yes, there is:
hairbar

Q: That’s not a very big difference, is it?

A: No

Q: So some men with facial hair are probably ok?

A: Probably.
 

November 25, 2015

What do statisticians do all day?

The New Zealand Statistical Association is having its annual meeting at the moment in Christchurch. It’s hard for a lot of people to imagine how there could be new research in statistics, so here are some examples from the awards.

Maxine Pfannkuch won the Association’s lifetime achievement award, for her work on statistics education. She studies how people (mostly schoolkids) draw informal statistical conclusions from data and from graphics, and looks for ways to teach them to do it better. A lot of the improvements in the high-school stats curriculum are her fault.

Mark Holmes won the research award. His research is harder to explain in simple terms, but he studies random processes that accumulate over time — like the shape of the trail left by a randomly-moving point.

Blair Robertson won the junior research award. He used to be an applied mathematician, working on optimisation — finding the best value of a complicated function. He now uses similar techniques to come up with improved ways to choose sets of locations in space and time for environmental sampling.

Maarten Kruijver won a `young statistician’ talk award. He works in forensic statistics, looking at ways to estimate the chance that a DNA sample from a crime scene will coincidentally look as if it is from a close relative of someone in the police database.

Anjali Gupta won the other `young statistician’ talk award. She is studying a laser-based technique for measuring chemical composition of things, with forensics being one application.  She was studying the variation in measurements for the same object over time, to understand more about the accuracy of the technique.

November 24, 2015

Book recommendations

It’s the time of year when people are asking “What can I buy for my favourite nerd?”. Here are some books s/he might like, a mixture of older and new.

  • Thing Explainer by Randall Munroe (of XKCD fame). A coffee-table book of annotated drawings, along the lines of his 2012 Up Goer Five. I reviewed this for the Listener.  It’s really good.
  • Eureka: Discovering Your Inner Scientist by Chad Orzel.  I’ve mentioned this book before on StatsChat. It’s a great look at how science works. In the process, it attacks a lot of the myths about scientists.
  • Thinking, Fast and Slow by Daniel Kahneman. With Amos Tversky, he pioneered the study of why people are bad at probability and risk assessments. He won a Nobel-like Prize for Economics shortly after the book came out. Unlike many books of its kind, it doesn’t need the subtitle “Why I am Right About Everything”.
  • The Immortal Life of Henrietta Lacks, by Rebecca Skloot. The HeLa cell line is a mainstay of laboratory research, but until fairly recently even most scientists didn’t know where it came from. Skloot’s book tells the story of an African-American woman treated for cervical cancer at Johns Hopkins, and how her cells lived on without her or her family’s knowledge.
  • How Not To Be Wrong by Jordan Ellenberg. Ellenberg is a highly-respected pure mathematician, but his book is about statistical thinking in everyday life.
  • The Canon, by Natalie Angier. A survey of the most important things we’ve learned about the universe. Includes a chapter on probability and statistics featuring the wonderful Deb Nolan.
  • The Secret Life of Money, by Daniel Davies and Tess Read. One of the many books trying to explain the world in terms of microeconomics or vice versa. Less everything-you-know-is-wrong and more entertaining writing than Freakonomics.  I’m not sure if reading Davies’s account of a visit to New Zealand will make you more or less likely to want the book.
  • The Philadephia Chromosome, by Jessica Wapner. This tells the story of the selective tyrosine kinase inhibitor imitanib (Gleevec),  and its (largely unfulfilled) promise of cancer treatment targeting the cause of disease without toxic side-effects.
  • The Disappearing Spoon, by Sam Kean. The eponymous spoon is made of gallium, which melts at about 30C; the book is an entertaining and informative survey of the periodic table.
November 22, 2015

Briefly

  • There’s a survey put out by the World Bank with what it calls basic financial literacy questions. Lots of people didn’t give the intended answers.  As Felix Salmon explains, that’s because they were silly questions:

Nothing useful can be learned by going up to poor workers in, say, Afghanistan (to take the very first country on the list), and asking them this question. They don’t have banks, and if they do have banks they don’t have savings accounts, and if they do have savings accounts they don’t hold on to them for five years, and if they do hold on to them for five years they’ll probably end up with nothing at all…

  • From Andrew Gelman’s blog, a couple of posts on accidental and deliberate wrong answers in surveys.
  • Graeme Edgeler explains again why you don’t need deliberate wrong answers in the flag referendum
  • Some things shouldn’t be maps. One example is homes of 187 victims of child homicide over the past 23 years, mapped with the 2013 deprivation index in Stuff.  On top of the inappropriateness of the map, and the time misalignment, there does actually exist serious research on risk factors for child abuse, both here and abroad: it’s not a matter of Stuff ‘discovering’ things.
  • David Spiegelhalter on an example of misreporting of criticism of misreporting of stats
  • US artist Chad Hagen has a lovely set of prints titled “Nonsensical Infographics“, with the form of data visualisation but no content3626_largeview_cbca1479-548b-467f-9997-e25d0ff76662_large