Posts filed under General (3156)

June 17, 2015

Chocolate: the new health food?

A UK cohort study published a paper yesterday with the title “Habitual chocolate consumption and risk of cardiovascular disease among healthy men and women.”  In contrast to the last chocolate study to make headlines, this is actual research, involving 20,000 people followed up for twelve years, and was published in a respectable medical journal.

The study found that people who ate more chocolate back in the mid-1990s had less cardiovascular disease over the period to 2008. Of course, this makes for a great press release and headlines

  • StuffEating chocolate every day linked to lower heart disease and stroke
  • NZ Herald (from the Telegraph): Two choc bars a day keeps doctor away
  • One News: Is chocolate good for you? New study suggests 100g a day may be beneficial

Are the findings of the paper true? Well, that depends on what you mean by ‘true’, which is important to remember when you see claims that 90% of scientific results are false.

On the one hand, it’s true that the EPIC study recruited all these people and asked them questions about their diet in the 1990s, and it’s presumably true that the proportion getting cardiovascular disease was lower among those who ate more chocolate and that the study included people who ate up to 100g/day.  These are historical facts, not health claims.

The conclusion of the research paper was

Cumulative evidence suggests that higher chocolate intake is associated with a lower risk of future cardiovascular events, although residual confounding cannot be excluded. There does not appear to be any evidence to say that chocolate should be avoided in those who are concerned about cardiovascular risk.

This is also probably true: there is a correlation; it could be due to confounding; there doesn’t seem to be any big extra risk from eating chocolate (instead of something else with similar calorie content).

At the other extreme, though, the Herald and One News headlines are misleading: they imply that adding 100g/day of chocolate to your existing diet would be beneficial. First, while the maximum consumption was 100g/day, 95% of the study participants consumed less than 40g/day, and 90% less than 25g/day. Second, and more important, the study looked at people’s normal diet, not at changes in diet.

If you add 100g/day of chocolate to your diet, you either need to cut more than 500 Calories of other foods, or exercise a lot more, to avoid gaining weight. The study participants basically did this: the high-chocolate and low-chocolate groups had similar BMI and waist:hip ratio, and the high-chocolate group exercised more.

Third, there is confounding. The people who ate more chocolate might have been healthier for other reasons. For example, those who ate no chocolate were more likely to have diabetes, which is probably why some of them ate no chocolate. The difference in cardiovascular disease rates was far too small for confounding to be ruled out as an explanation, no matter how carefully the analysis was done (and it was done pretty well).

Fourth, and in some ways most important, is the role of chance. This was a big study, but it still came up with only moderately strong evidence that the correlation was real, and that’s considering the study on its own. We don’t know whether there was any publication bias leading positive results about chocolate to be easier to publish in the scientific journals, but we can be sure there was publication bias in the media coverage. Always, if you see a diet and health study on TV, it must have had unusually interesting results. Even when it’s valuable as a component in the cumulative scientific literature, the biased selection for interesting results usually means you can’t believe it in application to your own life.

I got up at 5:15 today in order to be on breakfast TV to talk about this study. That would never have happened if the results had been different.

June 16, 2015

Briefly

  • NZ Defence Force say they have seized “260kg of high-grade heroin worth about $235m” (via Stuff). That would be $900/gram. Presumably the figure is supposed to be street price ignoring any distribution costs and assuming it’s all sold. Even so it seems steep. NZDF also say “they were destined for east Africa and likely into Europe.” European street prices for heroin vary depending on who you ask, but they aren’t anywhere near that high.
  • 3News had a story on the rise in Indian-style weddings in New Zealand. I noticed the line “The average Indian wedding costs up to $100,000 – that is more than three times the average New Zealanders spend on tying the knot.” We know the figure of $30,000 for an average NZ wedding is bogus; it’s hard to tell whether the figure for Indian weddings is more or less inflated.
  • When the FDA doesn’t approve an application to market a new drug, it sends what it calls a “complete response letter”.  An analysis in the medical journal BMJ compares the letters to company press releases. In 21% of cases no information in the press release matched the letter. In 19 of 32 cases where the FDA had said more clinical trials would be needed, there was no mention of this in the press release.
  • The top ten finalists from a competition for optical illusions. Knowing about optical illusions is useful for data visualisation: they are extreme versions of things you want to avoid.
  • From the Washington Post, an illustration of why you want to avoid the optical illusion of 3-d in your graphics. The box on the right is 21% smaller than the box on the left. Really. Do the maths.
    CHFiVSwW8AMf0zf
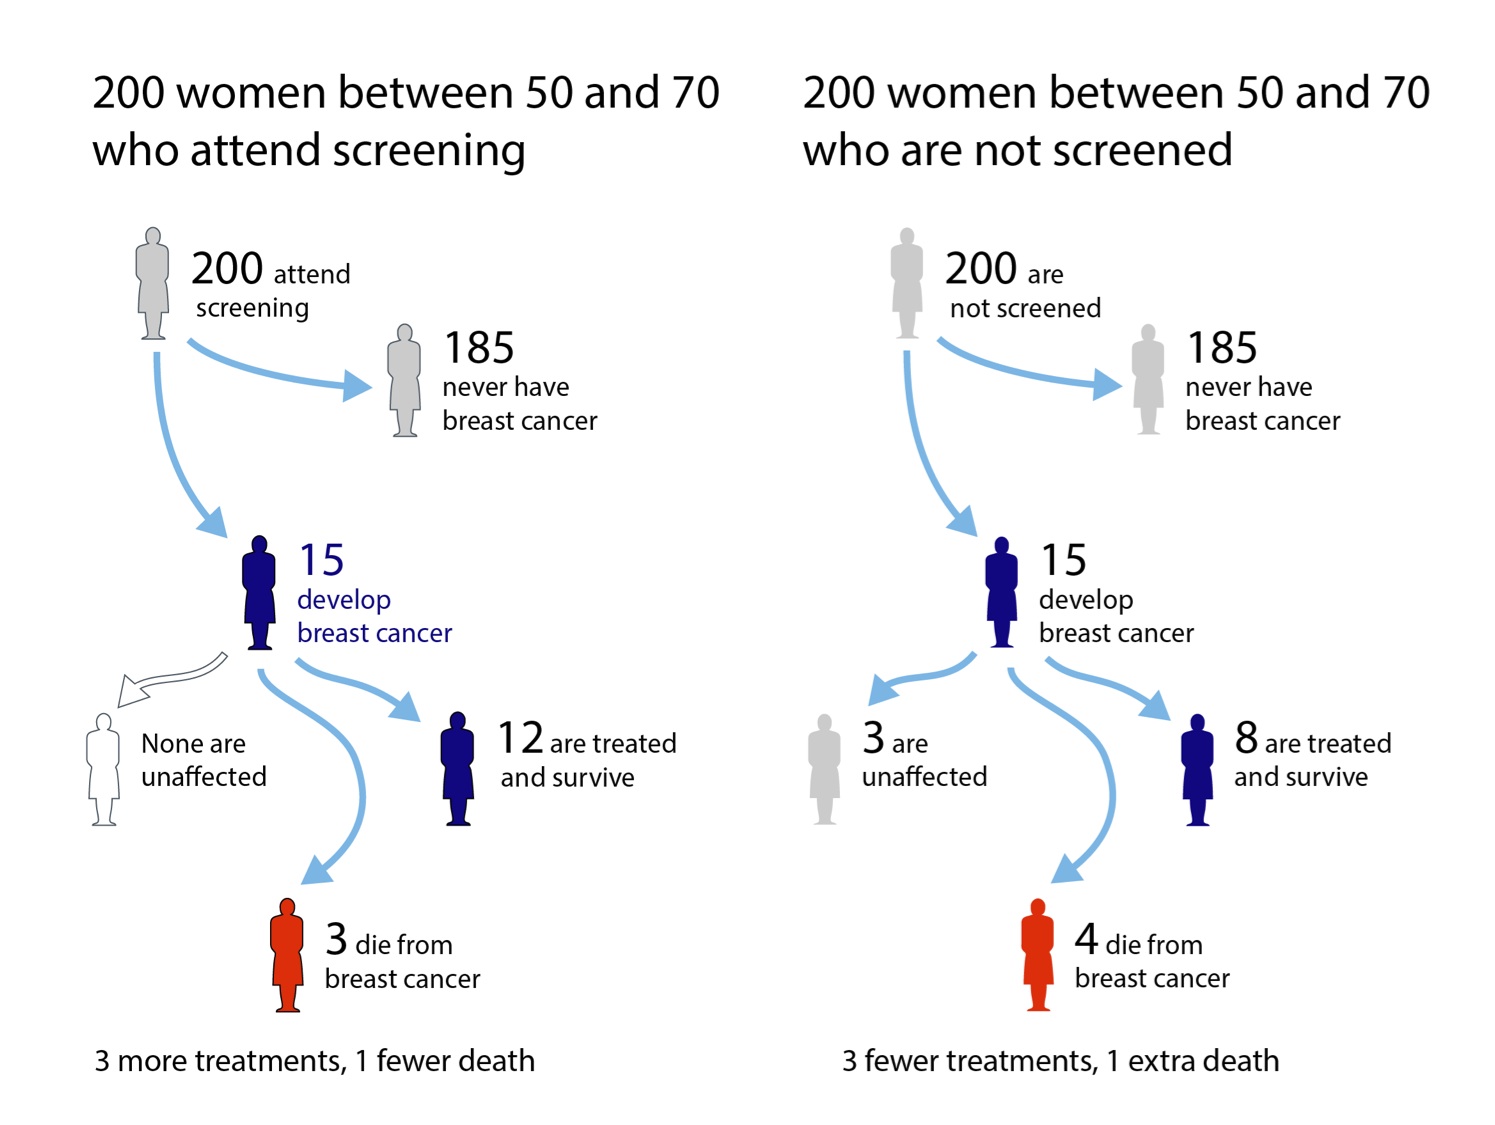
  • A good example of risk communication, from the British NHS:
    breast-200-tree
    (via David Spiegelhalter who also writes about the conflict between targeting information at the people who theoretically need it versus the people who will actually take advantage of it)
June 15, 2015

Verbal abuse the biggest bullying problem at school: Students

StatsChat is involved with the biennial CensusAtSchool / TataurangaKiTeKura, a national statistics education project for primary and secondary school students. Supervised by teachers, students aged between 9 and 18 (Year 5 to Year 13) answer 35 questions in English or te reo Māori about their lives, then analyse the results in class. Already, more than 18,392 students from 391 schools all over New Zealand have taken part.

This year, for the first time, CAS asked students about bullying, a persistent problem in New Zealand schools.

School students think verbal mistreatment is the biggest bullying issue in schools – higher than cyberbullying, social or relational bullying such as social exclusion and spreading gossip, or physical bullying.

Students were asked how much they agreed or disagreed with statements about each type of bullying.  A total of 36% strongly agreed or agreed that verbal bullying was a problem among students at their school, followed by cyberbullying (31% agreed or strongly agreed), social or relational bullying (25% agreed or strongly agreed) and physical bullying (19% agreed or strongly agreed).

Read the rest of the press release here.


June 13, 2015

In a bit of a pickle

Q: Isn’t this microbiome stuff cool?

A: <suspiciously> Yes?

Q: In the Herald. “Eating sauerkraut, pickles and yoghurt may be the answer for young adults suffering from social anxiety.” We didn’t know that before scientists starting measuring gut microbes, did we?

A: I’m not sure we know that now.

Q: They even found “the effect was greatest among those at genetic risk for social anxiety disorder as measured by neuroticism”.  This sort of interdisciplinary approach is a real step forward, surely? Genes and microbes and personality changes?

A: Yes, in principle, but there weren’t any genes or microbes or personality changes measured in this research.

Q: Not any?

A: No

Q: Oh.

A: They asked, on one occasion, about what they called ‘fermented foods’ and measured social anxiety, and found a correlation.

Q: How strong?

A: ‘Fermented food’ intake explained nearly 2% of the variation in social anxiety

Q: You mean nearly 20%?

A: I mean nearly 2%. The correlation was -0.13, and you square it to get proportion of variation explained.

Q: Oh. Um. Sometimes the story says ‘fermented’ and sometimes it says ‘pickles’ and then there’s this mention of chocolate? What’s up with that?

A: They asked about ten food classes: fruit and veg, and nine things they lumped together into ‘fermented foods’. From the research paper

2. yogurt, 3. kefir, or food or beverages that contain yogurt; 4. soy milk, or foods or beverages that contain soy milk; 4. miso soup; 5. sauerkraut; 6. dark chocolate; 7. juices that contain microalgae; 8. pickles; 9. tempeh; and 10. kimchi

Q: But soy milk isn’t fermented. Or dark chocolate. And what do they include in ‘pickles’?

A: Whatever a US undergraduate student would include, so probably more vinegar-preserved cucumbers and peperoncini than real lactic-fermented pickles

Q: And they just added these all up?

A: Yes. And then took the inverse hyperbolic sine.

Q: The what now?

A: Some people reported eating much more fermented food than the rest, so they used a mathematical transformation to reduce the impact of these measurements. The effect is that they’re focusing mostly on low levels of consumption (weekly), not high levels (multiple per day).

Q: Is that a problem?

A: No, it’s fine. It’s just that they seemed to have done it because they have a thing about Normal distributions rather than because that’s what they wanted to focus on.

Q: I thought it was statisticians who had a thing about Normal distributions?

A: Not for a few decades now, but yes, our bad originally.

Q: Ok, how about the genes. How did they avoid measuring any genes?

A: Look more carefully at what you quoted. They defined “at genetic risk of social anxiety” by a measure of neuroticism

Q: How genetic is … no, wait, we’ve been there. You’re going to tell me the estimated heritability, then explain it doesn’t answer my question.

A: Glad to see someone’s paying attention.

Q: Could it just be that there are cultural differences in reporting social anxiety and also in eating things like tempeh, miso, and kimchi?

A: It’s not out of the question.

June 10, 2015

Availability bias

Nathan Rarere, on this week’s Media Take, Mãori TV (video, about 18:35)

Everybody outside of Auckland thinks that Auckland is this incredible crime wave. Because you work in a newsroom and you’ve basically got a day to do the story, and you’ve got the car — “Where’re you taking it?” — you’ve got to sign it out and fill in the book, so whatever crime you can get to within about 55k of work.

NRL Predictions for Round 14

Team Ratings for Round 14

The basic method is described on my Department home page.

Here are the team ratings prior to this week’s games, along with the ratings at the start of the season.

Current Rating Rating at Season Start Difference
Roosters 8.81 9.09 -0.30
Broncos 6.79 4.03 2.80
Rabbitohs 6.46 13.06 -6.60
Cowboys 6.35 9.52 -3.20
Storm 5.38 4.36 1.00
Dragons 2.70 -1.74 4.40
Bulldogs -0.35 0.21 -0.60
Warriors -1.02 3.07 -4.10
Raiders -1.36 -7.09 5.70
Panthers -1.40 3.69 -5.10
Sea Eagles -3.17 2.68 -5.80
Knights -3.94 -0.28 -3.70
Eels -4.62 -7.19 2.60
Sharks -5.92 -10.76 4.80
Titans -6.02 -8.20 2.20
Wests Tigers -7.37 -13.13 5.80


Performance So Far

So far there have been 99 matches played, 57 of which were correctly predicted, a success rate of 57.6%.

Here are the predictions for last week’s games.

Game Date Score Prediction Correct
1 Broncos vs. Sea Eagles Jun 05 44 – 10 9.60 TRUE
2 Wests Tigers vs. Titans Jun 05 20 – 27 3.10 FALSE
3 Knights vs. Raiders Jun 06 22 – 44 3.90 FALSE
4 Panthers vs. Storm Jun 06 0 – 20 -1.20 TRUE
5 Rabbitohs vs. Warriors Jun 06 36 – 4 8.20 TRUE
6 Sharks vs. Roosters Jun 07 10 – 4 -14.60 FALSE
7 Bulldogs vs. Dragons Jun 08 29 – 16 -2.20 FALSE
8 Eels vs. Cowboys Jun 08 30 – 36 -8.30 TRUE


Predictions for Round 14

Here are the predictions for Round 14. The prediction is my estimated expected points difference with a positive margin being a win to the home team, and a negative margin a win to the away team.

Game Date Winner Prediction
1 Wests Tigers vs. Rabbitohs Jun 12 Rabbitohs -10.80
2 Warriors vs. Roosters Jun 13 Roosters -5.80
3 Titans vs. Bulldogs Jun 14 Bulldogs -2.70
4 Storm vs. Eels Jun 15 Storm 13.00


Super 15 Predictions for Round 18

Team Ratings for Round 18

The basic method is described on my Department home page.

Here are the team ratings prior to this week’s games, along with the ratings at the start of the season.

Current Rating Rating at Season Start Difference
Crusaders 10.03 10.42 -0.40
Hurricanes 7.74 2.89 4.80
Waratahs 7.03 10.00 -3.00
Brumbies 4.50 2.20 2.30
Chiefs 4.48 2.23 2.30
Highlanders 3.45 -2.54 6.00
Stormers 3.03 1.68 1.30
Bulls 1.96 2.88 -0.90
Lions -0.55 -3.39 2.80
Sharks -1.94 3.91 -5.90
Blues -2.65 1.44 -4.10
Rebels -4.28 -9.53 5.20
Force -7.77 -4.67 -3.10
Reds -8.25 -4.98 -3.30
Cheetahs -9.79 -5.55 -4.20


Performance So Far

So far there have been 113 matches played, 76 of which were correctly predicted, a success rate of 67.3%.

Here are the predictions for last week’s games.

Game Date Score Prediction Correct
1 Hurricanes vs. Highlanders Jun 05 56 – 20 4.90 TRUE
2 Force vs. Brumbies Jun 05 20 – 33 -7.50 TRUE
3 Rebels vs. Bulls Jun 06 21 – 20 -2.30 FALSE
4 Blues vs. Crusaders Jun 06 11 – 34 -6.70 TRUE
5 Reds vs. Chiefs Jun 06 3 – 24 -6.50 TRUE
6 Cheetahs vs. Waratahs Jun 06 33 – 58 -10.60 TRUE
7 Stormers vs. Lions Jun 06 19 – 19 8.70 FALSE


Predictions for Round 18

Here are the predictions for Round 18. The prediction is my estimated expected points difference with a positive margin being a win to the home team, and a negative margin a win to the away team.

Game Date Winner Prediction
1 Blues vs. Highlanders Jun 12 Highlanders -2.10
2 Rebels vs. Force Jun 12 Rebels 7.50
3 Brumbies vs. Crusaders Jun 13 Crusaders -1.00
4 Chiefs vs. Hurricanes Jun 13 Chiefs 0.70
5 Waratahs vs. Reds Jun 13 Waratahs 19.30
6 Bulls vs. Cheetahs Jun 13 Bulls 15.70
7 Sharks vs. Stormers Jun 13 Stormers -1.00


June 7, 2015

Briefly

  • Bad things happen to innocent numbers in the news for several reasons. One is the craft norm that it’s OK — even expected — to be bad with numbers. Another is that news stories are. well, stories: they put information into narrative contexts that make sense.” From editing blog headsup
  • From the Atlantic (via @beck_eleven) : Should Journalists Know How Many People Read Their Stories?  From Scientific American, The Secret to Online Success: What Makes Content Go Viral. The answer given is ’emotion’, but if you look at their research paper, the ‘controls’ such as position on the page, length, and type of content have a much bigger influence.
  • From Felix Salmon at Fusion “The way Uber fares are calculated is a mess”
  • Mapping Los Angeles’ sprawl: story from Wired about the Built:LA interactive map of age of buildings in LA County. Light blue shows the early 20th century city, with dark purple post-WWII shading to pink and orange for recent consturction
    la
  • From Medium, a piece on how internet data gathering and advertising can control your world. If this really worked, you’d think online advertising would be much more lucrative than it seems to be.
June 3, 2015

NRL Predictions for Round 13

Team Ratings for Round 13

The basic method is described on my Department home page.

Here are the team ratings prior to this week’s games, along with the ratings at the start of the season.

Current Rating Rating at Season Start Difference
Roosters 10.22 9.09 1.10
Cowboys 6.53 9.52 -3.00
Broncos 5.13 4.03 1.10
Rabbitohs 4.84 13.06 -8.20
Storm 4.08 4.36 -0.30
Dragons 3.76 -1.74 5.50
Warriors 0.60 3.07 -2.50
Panthers -0.10 3.69 -3.80
Bulldogs -1.41 0.21 -1.60
Sea Eagles -1.51 2.68 -4.20
Knights -2.17 -0.28 -1.90
Raiders -3.12 -7.09 4.00
Eels -4.80 -7.19 2.40
Wests Tigers -6.65 -13.13 6.50
Titans -6.74 -8.20 1.50
Sharks -7.34 -10.76 3.40


Performance So Far

So far there have been 91 matches played, 53 of which were correctly predicted, a success rate of 58.2%.

Here are the predictions for last week’s games.

Game Date Score Prediction Correct
1 Panthers vs. Eels May 29 20 – 26 9.90 FALSE
2 Cowboys vs. Sea Eagles May 30 18 – 14 12.20 TRUE
3 Raiders vs. Broncos May 30 12 – 24 -4.10 TRUE
4 Titans vs. Rabbitohs May 30 16 – 22 -9.00 TRUE
5 Dragons vs. Sharks May 31 42 – 6 10.70 TRUE
6 Warriors vs. Knights May 31 24 – 20 7.30 TRUE
7 Roosters vs. Storm Jun 01 24 – 2 7.00 TRUE


Predictions for Round 13

Here are the predictions for Round 13. The prediction is my estimated expected points difference with a positive margin being a win to the home team, and a negative margin a win to the away team.

Game Date Winner Prediction
1 Broncos vs. Sea Eagles Jun 05 Broncos 9.60
2 Wests Tigers vs. Titans Jun 05 Wests Tigers 3.10
3 Knights vs. Raiders Jun 06 Knights 3.90
4 Panthers vs. Storm Jun 06 Storm -1.20
5 Rabbitohs vs. Warriors Jun 06 Rabbitohs 8.20
6 Sharks vs. Roosters Jun 07 Roosters -14.60
7 Bulldogs vs. Dragons Jun 08 Dragons -2.20
8 Eels vs. Cowboys Jun 08 Cowboys -8.30


Super 15 Predictions for Round 17

Team Ratings for Round 17

The basic method is described on my Department home page.

Here are the team ratings prior to this week’s games, along with the ratings at the start of the season.

Current Rating Rating at Season Start Difference
Crusaders 9.06 10.42 -1.40
Waratahs 6.16 10.00 -3.80
Hurricanes 6.07 2.89 3.20
Highlanders 5.12 -2.54 7.70
Brumbies 4.12 2.20 1.90
Chiefs 3.60 2.23 1.40
Stormers 3.59 1.68 1.90
Bulls 2.26 2.88 -0.60
Lions -1.12 -3.39 2.30
Blues -1.68 1.44 -3.10
Sharks -1.94 3.91 -5.90
Rebels -4.58 -9.53 4.90
Reds -7.37 -4.98 -2.40
Force -7.38 -4.67 -2.70
Cheetahs -8.92 -5.55 -3.40


Performance So Far

So far there have been 106 matches played, 71 of which were correctly predicted, a success rate of 67%.

Here are the predictions for last week’s games.

Game Date Score Prediction Correct
1 Crusaders vs. Hurricanes May 29 35 – 18 5.60 TRUE
2 Brumbies vs. Bulls May 29 22 – 16 6.40 TRUE
3 Sharks vs. Rebels May 29 25 – 21 7.80 TRUE
4 Highlanders vs. Chiefs May 30 36 – 9 2.80 TRUE
5 Force vs. Reds May 30 10 – 32 7.20 FALSE
6 Stormers vs. Cheetahs May 30 42 – 12 14.70 TRUE
7 Lions vs. Waratahs May 30 27 – 22 -3.90 FALSE


Predictions for Round 17

Here are the predictions for Round 17. The prediction is my estimated expected points difference with a positive margin being a win to the home team, and a negative margin a win to the away team.

Game Date Winner Prediction
1 Hurricanes vs. Highlanders Jun 05 Hurricanes 4.90
2 Force vs. Brumbies Jun 05 Brumbies -7.50
3 Rebels vs. Bulls Jun 06 Bulls -2.30
4 Blues vs. Crusaders Jun 06 Crusaders -6.70
5 Reds vs. Chiefs Jun 06 Chiefs -6.50
6 Cheetahs vs. Waratahs Jun 06 Waratahs -10.60
7 Stormers vs. Lions Jun 06 Stormers 8.70