Posts filed under General (3156)

March 11, 2014

Predicting dementia

The Herald has a story about a potential blood test for dementia, which gives the opportunity to talk about an important statistical issue. The research seems to be good, and the results are plausible, though they need to be confirmed in a separate, larger sample before they can really be believed. Also, the predictions so far are just for mild cognitive impairment, not actual dementia. But it’s the description of the accuracy of the test that might be misleading.

The test had 90% sensitivity — 90% of who developed cognitive impairment tested positive. It had 90% specificity — 90% of those who who did not develop cognitive impairment tested negative.  That’s what is described in the story as 90% accuracy.  What a user would care about is the positive predictive value: if you test positive, how likely are you to get cognitive impairment?

In the study 451 people started out cognitively normal; 28 of these developed impairment, the other 423 did not. The test would be correctly positive for about 25 of the 28, and correctly negative for about 381 of the 423. So, of the 25+42=67 who test positive, less than 40% will develop impairment. That’s reasonable for a  diagnostic test but a bit low for a screening test in healthy people.

Where the test is more immediately relevant is in designing clinical trials. So far, attempts to affect Alzheimer’s Disease progression have failed, though there are some modestly effective symptomatic treatments. It’s possible that the treatments are doing the right thing but that clinical illness is too late, so there’s a lot of interest in testing treatments very early in the process. A test like the new one could be very useful
March 9, 2014

Briefly

  • Rafa, at Simply Statistics, shows that countries with higher GDP per capita also tend to have had women voting for longer. Yes, he does know about correlation and causation.
  • Felix Salmon writes about, essentially, Bayesian updating given conflicting information the probability that Dorian is Satoshi would seem to be very small, and the the probability that Dorian is not Satoshi would seem to be just as small — and yet, somehow, when you add the two probabilities together, the total needs to come to something close to 100%.
  • Viz for a cause, an new archive of for data visualisations advocating on various causes. The current examples come from Tableau Public, which might be worth a look for online displays.
  • Andrew Gelman onHow much time (if any) should we spend criticizing research that’s fraudulent, crappy, or just plain pointless?” You can tell my answer from StatsChat. When it’s just consenting scientists in the journals, I’ve got better things to do. When there’s enough PR applied to get it into the NZ media, I try to respond. Sometimes it’s bad science; often it’s perfectly good underlying science and bad press releases. Remember, almost nothing from the scientific literature gets into the papers accidentally. Someone — the scientist, the journal, the university — has to push.
March 7, 2014

Graphics design rules

1. Barcharts must start at zero,  from Storytelling with Data

2. Infographics as a proxy for overall news quality (barcharts must start at zero), from The Functional Art

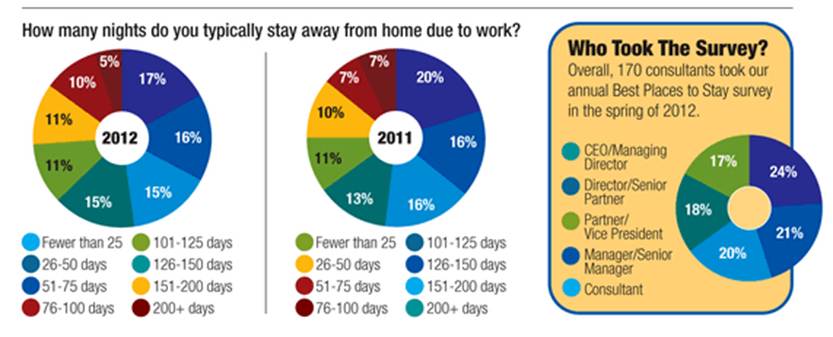
3. And, from Storytelling with Data, perhaps the worst use of colour ever in donut charts. Statisticians keep saying it’s hard to compare pie/donut charts reliably. Notice how the two donuts below look very similar? Now try looking at the legends

donut

Remember: U and DON’T makes DONUT.

March 4, 2014

Briefly

  • Auckland Counts: local maps of NZ Census data thanks to Auckland Council RIMU. (via @kamal_hothi)
March 2, 2014

Super 15 Predictions for Round 4

Team Ratings for Round 4

The basic method is described on my Department home page. I have made some changes to the methodology this year, including shrinking the ratings between seasons.

My predictions are early this week and may not appear next week unless I can get some internet access while travelling.

Here are the team ratings prior to this week’s games, along with the ratings at the start of the season.

Current Rating Rating at Season Start Difference
Crusaders 6.77 8.80 -2.00
Sharks 5.76 4.57 1.20
Chiefs 4.67 4.38 0.30
Waratahs 3.82 1.67 2.20
Brumbies 3.56 4.12 -0.60
Bulls 3.44 4.87 -1.40
Stormers 2.08 4.38 -2.30
Reds 0.18 0.58 -0.40
Blues -1.32 -1.92 0.60
Cheetahs -1.38 0.12 -1.50
Hurricanes -1.43 -1.44 0.00
Highlanders -3.34 -4.48 1.10
Lions -4.26 -6.93 2.70
Rebels -5.00 -6.36 1.40
Force -6.56 -5.37 -1.20


Performance So Far

So far there have been 16 matches played, 8 of which were correctly predicted, a success rate of 50%.

Here are the predictions for last week’s games.

Game Date Score Prediction Correct
1 Blues vs. Crusaders Feb 28 35 – 24 -7.80 FALSE
2 Rebels vs. Cheetahs Feb 28 35 – 14 -2.30 FALSE
3 Stormers vs. Hurricanes Feb 28 19 – 18 8.50 TRUE
4 Chiefs vs. Highlanders Mar 01 21 – 19 11.70 TRUE
5 Waratahs vs. Reds Mar 01 32 – 5 3.40 TRUE
6 Force vs. Brumbies Mar 01 14 – 27 -6.80 TRUE
7 Bulls vs. Lions Mar 01 25 – 17 10.60 TRUE


Predictions for Round 4

Here are the predictions for Round 4. The prediction is my estimated expected points difference with a positive margin being a win to the home team, and a negative margin a win to the away team.

Game Date Winner Prediction
1 Hurricanes vs. Brumbies Mar 07 Brumbies -1.00
2 Reds vs. Cheetahs Mar 07 Reds 5.60
3 Crusaders vs. Stormers Mar 08 Crusaders 8.70
4 Force vs. Rebels Mar 08 Force 0.90
5 Bulls vs. Blues Mar 08 Bulls 8.80
6 Sharks vs. Lions Mar 08 Sharks 14.00


March 1, 2014

Briefly

  • From Tim Harford, Toronto effectively had a randomised trial for countdown walk signals — what do they do for accidents?
  • From Mathbabe It would be idiotic for someone with the intention of being discriminatory to do so outright. It’s much easier to embed such a thing in an opaque model where it will seem unintentional and will probably never be discovered at all.

    But how is an investigative journalist going to even approach that?

  • From Matthew Ericson of the New York Times: “When maps shouldn’t be maps”
  • From Max Fisher at the Washington Post, a look at the problems of interpreting changes in rankings

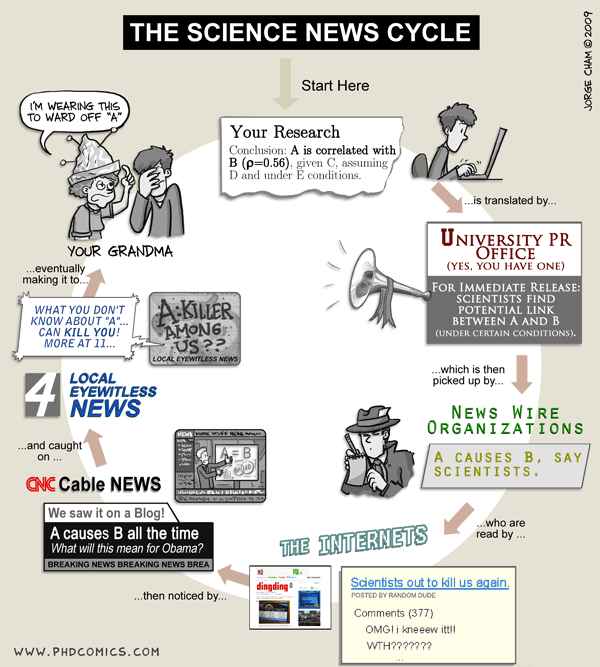
Science news cycle

From Piled Higher and Deeper.  Substitute as necessary if your grandma is a scientist.

sciencegap


The only thing wrong with this is it gives too much credit to university PR departments.

February 28, 2014

NRL Predictions for Round 1

Team Ratings for Round 1

The basic method is described on my Department home page. I have made some changes to the methodology this year, including shrinking the ratings between seasons.

Here are the team ratings prior to this week’s games, along with the ratings at the start of the seaso

Current Rating Rating at Season Start Difference
Roosters 12.35 12.35 0.00
Sea Eagles 9.10 9.10 0.00
Storm 7.64 7.64 0.00
Cowboys 6.01 6.01 -0.00
Rabbitohs 5.82 5.82 0.00
Knights 5.23 5.23 0.00
Bulldogs 2.46 2.46 -0.00
Sharks 2.32 2.32 -0.00
Titans 1.45 1.45 -0.00
Warriors -0.72 -0.72 -0.00
Panthers -2.48 -2.48 0.00
Broncos -4.69 -4.69 -0.00
Dragons -7.57 -7.57 0.00
Raiders -8.99 -8.99 0.00
Wests Tigers -11.26 -11.26 0.00
Eels -18.45 -18.45 0.00


Predictions for Round 1

Here are the predictions for Round 1. The prediction is my estimated expected points difference with a positive margin being a win to the home team, and a negative margin a win to the away team.

Game Date Winner Prediction
1 Rabbitohs vs. Roosters Mar 06 Roosters -2.00
2 Bulldogs vs. Broncos Mar 07 Bulldogs 11.70
3 Panthers vs. Knights Mar 08 Knights -3.20
4 Sea Eagles vs. Storm Mar 08 Sea Eagles 6.00
5 Cowboys vs. Raiders Mar 08 Cowboys 19.50
6 Dragons vs. Wests Tigers Mar 09 Dragons 8.20
7 Eels vs. Warriors Mar 09 Warriors -13.20
8 Sharks vs. Titans Mar 10 Sharks 5.40


Improving journalists’ statistical literacy via a new unit standard

As our regular readers will know, statschat bloggers go about educating the media in statistical literacy in  various ways – making ourselves available to media, delivering workshops to working journalists and student journalists, and critiquing stats use in the media around us.

But we also have to look at the journalist pipeline – embedding statistical literacy in journalism students and their teachers. Over the last couple of years, Yours Truly, who spent many years of her life in newsrooms as a hack, latterly at the New Zealand Herald, has been banging that drum.

So it’s great news that the decision has been made to devise a unit standard in statistical thinking for the National Diploma in Applied Journalism that journalists follow on-the-job. This would be a Level 6 qualification and it would plug a gaping hole in the diploma.  The unit standard doesn’t have a name yet (but I quite like the idea of something like  “Demonstrate statistical literacy by ….”)

The reference group is below; we met this week to get things moving.

  • Mike Fletcher (NZJTO Executive Director, which has just beem folded into the ITO COMPETENZ), Project Lead
  • Andrew Tideswell (Statistics Education, Statistics NZ), facilitator
  • Christine McLoughlin (NZJTO Standards Writer)
  • Dr Richard Arnold (Professor of Statistics, Victoria University of Wellington)
  • Clio Francis, who works on stuff.co.nz (Fairfax Media)
  • Colin Marshall, (Acting Manager Strategic Communication, Statistics NZ)
  • Paul Stone, (Open Data Advisor, LINZ)
  • Patricia Brooking (from COMPETENZ, who is involved with student resource creation)
  • Julie Middleton ( Strategic communications consultant, editor, writer, researcher, Communications Adviser to the Department of Statistics, The University of Auckland).

I’ll let you know from time to time how we’re going – and may well ask for your help in finding good case studies and Excel-based data sets to help journalists become familiar with statistical thinking and tools (Excel is a rarity in New Zealand newsrooms).


BBC appoints a Head of Statistics

Just in from the Royal Statistical Society in the UK:

“Recent years have seen an encouraging amount of attention being paid to statistical accuracy in the media. This is not only because journalists can find meaty stories in catching a politician or organisation out with inaccurate figures. The increased amount of scrutiny in a changing media environment also means journalists themselves are under increasing pressure to get their facts and figures correct.

“The BBC has recognised this reality by creating a new post, Head of Statistics, with business reporter Anthony Reuben moving into the position after more than a decade at the corporation.”

Read more about this excellent piece of news on the Royal Statistical Society website here.