Posts filed under General (3156)

February 25, 2014

Super 15 Predictions for Round 3

Team Ratings for Round 3

The basic method is described on my Department home page. I have made some changes to the methodology this year, including shrinking the ratings between seasons.

Here are the team ratings prior to this week’s games, along with the ratings at the start of the season.

Current Rating Rating at Season Start Difference
Crusaders 7.89 8.80 -0.90
Sharks 5.84 4.57 1.30
Chiefs 5.29 4.38 0.90
Bulls 3.55 4.87 -1.30
Brumbies 3.15 4.12 -1.00
Stormers 2.56 4.38 -1.80
Waratahs 2.44 1.67 0.80
Reds 1.56 0.58 1.00
Cheetahs -0.02 0.12 -0.10
Hurricanes -1.91 -1.44 -0.50
Blues -2.44 -1.92 -0.50
Highlanders -3.96 -4.48 0.50
Lions -4.45 -6.93 2.50
Force -6.14 -5.37 -0.80
Rebels -6.36 -6.36 -0.00


Performance So Far

So far there have been 9 matches played, 3 of which were correctly predicted, a success rate of 33.3%.

Here are the predictions for last week’s games.

Game Date Score Prediction Correct
1 Crusaders vs. Chiefs Feb 21 10 – 18 6.90 FALSE
2 Cheetahs vs. Bulls Feb 21 15 – 9 -2.10 FALSE
3 Highlanders vs. Blues Feb 22 29 – 21 -0.10 FALSE
4 Brumbies vs. Reds Feb 22 17 – 27 6.00 FALSE
5 Sharks vs. Hurricanes Feb 22 27 – 9 10.80 TRUE
6 Lions vs. Stormers Feb 22 34 – 10 -8.10 FALSE
7 Waratahs vs. Force Feb 23 43 – 21 9.50 TRUE


Predictions for Round 3

Here are the predictions for Round 3. The prediction is my estimated expected points difference with a positive margin being a win to the home team, and a negative margin a win to the away team.

Game Date Winner Prediction
1 Blues vs. Crusaders Feb 28 Crusaders -7.80
2 Rebels vs. Cheetahs Feb 28 Cheetahs -2.30
3 Stormers vs. Hurricanes Feb 28 Stormers 8.50
4 Chiefs vs. Highlanders Mar 01 Chiefs 11.70
5 Waratahs vs. Reds Mar 01 Waratahs 3.40
6 Force vs. Brumbies Mar 01 Brumbies -6.80
7 Bulls vs. Lions Mar 01 Bulls 10.50


February 24, 2014

Shot in the foot

The UK is trying to set up a national research database of medical records from the National Health Service. That’s a good idea. New Zealand has one, and many of the larger fragments of the US medical system have their own.  As well as helping improve the performance of the National Health Service, the UK database could be used for research that would help people around the world; for example, detecting adverse effects of drugs.

A UK drug safety system would be more informative than the NZ one, because it involves so many more people. It might even be more informative than the US systems because the NHS it is comprehensive, not selective. That’s only true if everyone’s data is in the system, and that will only be possible if most people trust the system to protect their privacy.  Since it’s not really possible for the average person to tell if the system is trustworthy, it needs to be designed and implemented well enough that there aren’t any reasonable people with serious criticisms for inevitable opponents of the scheme to point to.

Sadly, the promoters of the database have at best been a bit careless about some of their claims, as Ben Goldacre describes. Some descriptions of the system have implied that making the data anonymous — removing obvious identifiers — is a strong safeguard. It isn’t: re-identification is often possible. It isn’t clear whether this was an omission in describing the safeguards or in designing them, but it’s unfortunate either way.

Worse still, the Telegraph has a story claiming that 13 years of complete British hospital records were sold to insurers, who used them to improve risk estimates and increase premiums. This is a problem because one of the key guarantees of the system was going to be that data wouldn’t get to insurers. The data release was under the old rules, not from the new proposed database, but it still is Not Helpful if you’re trying to persuade people not to worry.


February 21, 2014

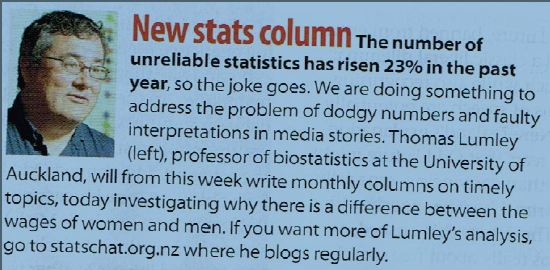
Stats Chat’s Thomas Lumley now Listener columnist

Congratulations to statschat.org.nz’s Thomas Lumley, Professor of Biostatistics in the Department of Statistics at the University of Auckland, who as of today is a new columnist for the venerable New Zealand Listener (in the edition dated March 1-7; its cover story is the third anniversary of the fatal Christchurch earthquake). Stats Chat staffers are delighted that we now have another way to target stats crimes and shed some light on statistics in the media every day.

The introductory blurb on the Listener’s Letters is below (complete with evidence that Julie can’t make a straight scan):

thomas 1

And Thomas’ his first column asks this question: How much of the difference between women’s and men’s wages is a result of individual choice? Have a read of Closing the gap.

February 20, 2014

Astronomy vs astrology: it’s complicated

As he comments this StatsChat post, Jim Lindgren did a similar test of the astrology/astronomy confusion hypothesis, with different results.

I replicated Landers study using the two NSF questions actually used, rather than questions that Landers made up. I then asked two followup questions designed to probe what the respondents meant by astrology.

If you ask the actual questions used in the NSF study and probe further than Landers did, you get completely different results from Landers’. In my sample, only 1 of 108 respondents seemed confused in the way that Landers hypothesized.

You can read about my replication in my blog post at the Washington Post:

http://www.washingtonpost.com/news/volokh-conspiracy/wp/2014/02/18/did-people-confuse-astronomy-with-astrology-in-the-nsf-study/


February 19, 2014

Super 15 Predictions for Round 2

Team Ratings for Round 2

The basic method is described on my Department home page. I have made some changes to the methodology this year, including shrinking the ratings between seasons.

Here are the team ratings prior to this week’s games, along with the ratings at the start of the season.

Current Rating Rating at Season Start Difference
Crusaders 8.80 8.80 -0.00
Sharks 5.36 4.57 0.80
Stormers 4.38 4.38 -0.00
Chiefs 4.38 4.38 0.00
Brumbies 4.12 4.12 0.00
Bulls 4.08 4.87 -0.80
Waratahs 1.67 1.67 0.00
Reds 0.58 0.58 -0.00
Cheetahs -0.54 0.12 -0.70
Hurricanes -1.44 -1.44 -0.00
Blues -1.92 -1.92 -0.00
Highlanders -4.48 -4.48 0.00
Force -5.37 -5.37 -0.00
Lions -6.27 -6.93 0.70
Rebels -6.36 -6.36 -0.00


Performance So Far

So far there have been 2 matches played, 1 of which was correctly predicted, a success rate of 50%.

Here are the predictions for last week’s games.

Game Date Score Prediction Correct
1 Cheetahs vs. Lions Feb 15 20 – 21 9.60 FALSE
2 Sharks vs. Bulls Feb 15 31 – 16 2.20 TRUE


Predictions for Round 2

Here are the predictions for Round 2. The prediction is my estimated expected points difference with a positive margin being a win to the home team, and a negative margin a win to the away team.

Game Date Winner Prediction
1 Crusaders vs. Chiefs Feb 21 Crusaders 6.90
2 Cheetahs vs. Bulls Feb 21 Bulls -2.10
3 Highlanders vs. Blues Feb 22 Blues -0.10
4 Brumbies vs. Reds Feb 22 Brumbies 6.00
5 Sharks vs. Hurricanes Feb 22 Sharks 10.80
6 Lions vs. Stormers Feb 22 Stormers -8.10
7 Waratahs vs. Force Feb 23 Waratahs 9.50


February 17, 2014

Briefly

  • From Stuff: Having a nasty bout of shingles is becoming more common in New Zealand [no data or anecdote given to support this], with the numbers of those at high-risk of infection on the rise. [when that’s defined just as older people]

Press releases and science in the media

From Tracker, the blog of the MIT journalism school, in a long post on the habit of reprinting lightly-edited press releases and calling it science journalism

Let’s be clear: The aim of Stanford press releases is to promote Stanford; not to enrich the readers of The Washington Post. The same is true of the University of Zurich’s releases. And of all the other releases that have been reprinted in the Post.

And the aim of the Post is–or should be–something quite different. And the paper says so in a lengthy credo on its website. “Through lively, sometimes humorous, but always rigorously researched stories, we try to separate the truths from the half-truths to help people make smarter HEALTH & SCIENCE care choices for themselves and their families.” It goes on: “We insist on getting information from the most reliable sources—the respected authorities in a particular field and the most solid studies in peer-reviewed medical journals. We’re fiercely independent of any commercial interest or advocacy group.” And that would include doctors and universities?


February 15, 2014

Crushing hopes

Now Valentine’s Day is safely past in NZ, I can link to a post on It’s a Stat Life, a blog not entirely unlike StatsChat. Robin Evans writes:

A friend pointed me to this story about the average number of men (or rather frogs) a woman has to date before finding their ‘Prince Charming’ (apparently it’s 15).  Let’s leave aside for now how they came up with the number: I’ve no doubt the methodology conforms to the most rigorous standards that we’ve all come to expect from the internet.  I thought that this paragraph might give some people hope:

If you’ve made out with 11 men, great news! A new survey suggests you’re only 4 away from Prince Charming. On average, anyway.

It’s now my duty to crush that hope.

February 14, 2014

Briefly

  • Genetic determinism, from Nathaniel Comfort: Studying genetics and popularization over the last century or so has led me to the surprising conclusion that genetic oversell is independent of genetic knowledge. We see the same sorts of articles in 2014 as we saw in 1914.
  • Kudos to the Herald for explicitly saying that research on grapeseed extract in colon cancer was lab-based, not on people. This sort of science is interesting if it isn’t hyped up as a cure.
  • Rather less impressive is the ‘sextacy’ story on the evils of Viagra. This combines general warnings on psychological problems; the specific, well-characterised dangerous interaction between Viagra and nitrates; and relatively anecdotal warnings about serotonin syndrome. And rubbish about arginine, where the fact that it gets sold in early February is taken as convincing evidence it has genuine sexual effects. Guess where the Herald got the story.

Statistical improvements in advertorials

The Herald has a headline “Why internet adultery numbers are soaring“, but doesn’t actually say why, or even provide any real evidence that they are increasing.

The news is that the number of people signed up to the website AshleyMadison is increasing as they expand internationally, but we’re not given any indication that the number of active members in a given area is increasing, let alone any data on how much actual goings-on is going on. So, the only internet data in the story would be relevant in the business section of the paper, but the Herald has the story filed under “Relationships & Pets.”

There is a gesture towards data later in the story

According to figures in the Journal of Marital and Family Therapy, some 22 per cent of men and 14 per cent of women will cheat on their spouses at least once during their marriage.

but this is basically useless for the headline claim about numbers soaring, since these are one-time percentages, and we aren’t even told when or where they are from. It looks as though they are probably from this 2005 paper, which summarises data back to the 1980s.

On the positive side, though, this is enormously better than the one from two years ago which had astonishingly bad use of data, completely ignoring denominators

If your partner supports National, has a PC, drinks Coke, eats meat, has a tattoo, smokes and is a Christian, be warned – they could be a cheater.

Progress, of sorts.