Posts filed under General (3156)

February 17, 2013

Census time

I just got my census form, so it must be about time to write about the NZ Census.  As I wrote when the West Island had theirs, it’s a good occasion to think about what the census is good for.  You might think that the success of surveys means that the census is no longer necessary, but as landline phones steadily become a less important part of people’s lives, the census (or some substitute) is actually increasingly vital to calibrate surveys.  In fact, part of my research is on the most effective ways of using this sort of information.

The primary problem with surveys is non-response — you can’t get hold of people, or you do catch them and they tell you to get far away and let them have dinner. Good survey organisations have ways to entice people into responding, but they also rely heavily on reweighting: if your survey under-represents families with young children, you can increase the weight given to those you did find, and reduce the bias.

This reweighting technique isn’t perfect, but it really does work.  The world’s largest telephone survey, the US Behavioral Risk Factor Surveillance System, used not to call cellphones.  It now does, providing an opportunity to compare the real cellphone results with the attempts to reweight.  Here are results from Michigan and Utah comparing a basic reweighting approach with a more sophisticated one, for landlines only and for landlines and cellphones. The improved reweighting approach (raking) made a big difference for the landline-only sample, moving it much closer to the landline+cellphone sample. So, reweighting really works.

Reweighting needs good data for the population, so every well-conducted survey from marketing research to opinion polls to the unemployment rate depends on the census, or some substitute.  In Scandinavian countries, the substitute is large administrative databases and record linkage.  We don’t have these, they’d be expensive to set up, and generally in English-speaking countries people don’t want them.  If you don’t have that sort of database, you need either a complete census or a mandatory survey of a random sample of people.

The United States uses both approaches: every ten years they have a complete census as required by the US Constitution, and in between they have the mandatory-response American Community Survey, which samples about 1% of the population each year.  In the US, the American Community Survey is both cheaper and more accurate than adding an extra census at five-year intervals.  In NZ it’s not clear — because of the smaller and more urban population, a sufficiently large survey might not be much less expensive than a five-yearly census.

What we want to avoid is the Canadian approach, where they decided to put nearly all the questions in a new, voluntary survey. The head of Statistics Canada resigned, and while he was forbidden by law to reveal the advice he had given to the government, he could say

I want to take this opportunity to comment on a technical statistical issue which has become the subject of media discussion. This relates to the question of whether a voluntary survey can become a substitute for a mandatory census.

It cannot.


[ps: the National Business Review has a story with quotes from me]
Briefly

  • Reconstructing the path of the Chelyabinsk meteorite in Google Earth
  • Researchers analysing internet commerce randomized trials (re)discover and solve a lot of problems in experimental design (via both Ben Goldacre and Andrew Gelman)
  • From Nature News: stem-cell research in Texas.  The company is outraged by “FDA’s decision to regulate your own stem cells as a drug”. That’s FDA requiring safe manufacturing — the company hasn’t even started clinical trials yet.
  • 80 patient groups sign up to the AllTrials campaign.
February 16, 2013

The dose matters

Q: Did you see that beer is healthy now?

A: Well, not exactly

Q: But there’s research and science and everything. Beer has fewer calories than wine.

A: Again, only up to a point.

Q: What? 43 isn’t less than 84 any more?

A: Beer has fewer calories per millilitre, so if you have 1/4 of a 425ml glass of beer, you get fewer calories  than in 100ml of wine.  In my experience, though, most people drink beer in larger units than 1/4 glass.  The calorie content per standard drink is very similar (slightly higher for beer, especially good beer).

Q: Wouldn’t you expect journalists to know a lot about how people usually drink alcohol?

A: That’s certainly the stereotype, but perhaps it’s out of date.

Q: But what about the micronutrients?

A: The press release mentions silicon.  That’s really a sign of desperation. There isn’t complete consensus that silicon even does anything vital in humans,  let alone that anyone is deficient in it.

Q: So where was this research published?

A: One of the websites of the British Beer and Pub Association

Q: So, not  exactly indepedent, peer-reviewed science?

A: Not as such, no.

February 12, 2013

Sneak peek at questions for CensusAtSchool 2013

Registrations have now opened for primary and high school teachers to sign up to have their classes take part in this year’s CensusAtSchool which runs from May 6 – June 15.

Tens of thousands of school children will be taking part once again, and here’s a sneak peek of some of the new questions they’ll be answering:

Which of the following food allergies* do you have? (You may tick more than one.)

  • cow’s milk (dairy)
  • eggs
  • peanuts
  • tree nuts (e.g. cashews, almonds, Brazil nuts)
  • fish or shellfish
  • soy
  • wheat
  • Other. Please state:
  • none

About how long did you spend on your homework last night? (If you did not do any last night, type 0.)

Who is your favorite singer or band? (If you do not have one, type “Don’t have one”)

This year on 5 March, we all filled in a Census of Population and Dwellings form. Have a guess at what New Zealand’s population was on that date:

Preliminary results will be available from May 9.

Learn more about the educational project CensusAtSchool »

* Interestingly, New Zealand has no prevalence data on food allergies.

February 10, 2013

Netflix owns your brains

Netflix has commissioned an American remake of the brilliant UK television series House of Cards. That’s not especially relevant to StatsChat, but apparently they did it with Big Data and Data Science, so it must be right.

Andrew Leonard at Salon bemoans how this is turning us into puppets

Netflix’s data indicated that the same subscribers who loved the original BBC production also gobbled down movies starring Kevin Spacey or directed by David Fincher. Therefore, concluded Netflix executives, a remake of the BBC drama with Spacey and Fincher attached was a no-brainer, to the point that the company committed $100 million for two 13-episode seasons.

“We know what people watch on Netflix and we’re able with a high degree of confidence to understand how big a likely audience is for a given show based on people’s viewing habits,” Netflix communications director Jonathan Friedland told Wired in November. “We want to continue to have something for everybody. But as time goes on, we get better at selecting what that something for everybody is that gets high engagement.”

The strategy has advantages that go beyond the assumption of built-in popularity. Netflix also believes it can save big on marketing costs because Netflix’s recommendation engine will do all the heavy lifting. Already, Netflix claims that 75 percent of its subscribers are influenced by what Netflix suggests to subscribers that they will like.

Felix Salmon (who is generally a believer in data) is not impressed


It should go without saying, of course, that dropping $100 million on a 26-episode remake of a great TV show is never a no-brainer. For one thing, for all that the original series is extremely good, it was also very timely, coming as it did at the end of Margaret Thatcher’s transformation of the Prime Minister’s office into something much more powerful and Presidential than the UK had ever seen. The BBC series tapped into Britain’s fear of the possible implications of that power, as well as the fact that Richard III and Macbeth are deeply rooted in the national psyche.

More generally, remakes are inherently dangerous things: what producers think of as a “proven formula” more often turns out to have been a unique and inimitable confluence of creative electricity. And it goes without saying that the better the original was, the less likely it is that the remake will surpass it.

Note that $100 million for 26 episodes is about 30% more than ‘Glee‘ costs, which in turn is about 50% more than the average prime-time drama.  Will this be an investment no-brainer in the same sense as Florida real-estate? You might very well think so. I couldn’t possibly comment.

February 5, 2013

A quick tongue-in-cheek checklist for assessing usefulness of media stories on risk

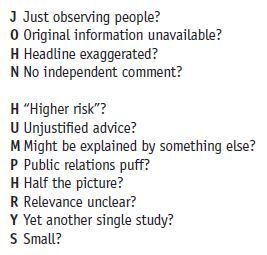
Do you shout at the morning radio when a story about a medical “risk” is distorted, exaggerated, mangled out of all recognition? You are not alone. Kevin McConway and David Spiegelhalter, writing in Significance, a quarterly magazine published by the Royal Statistical Society, have come up with a checklist for scoring media stories about medical risks. Their mnemonic checklist comprises 12 items and is called the ‘John Humphrys’ scale, said Mr Humphrys being a well-known UK radio and television presenter.

Capture

They assign one point for every ‘yes’ and do a test on a story about magnetic fields and asthma, and another about TV and length of life. The article, called Score and Ignore: A radio listener’s guide to ignoring health stories, is here.

Could form the basis of a useful classroom resource.

February 3, 2013

What do Kiwis die of?

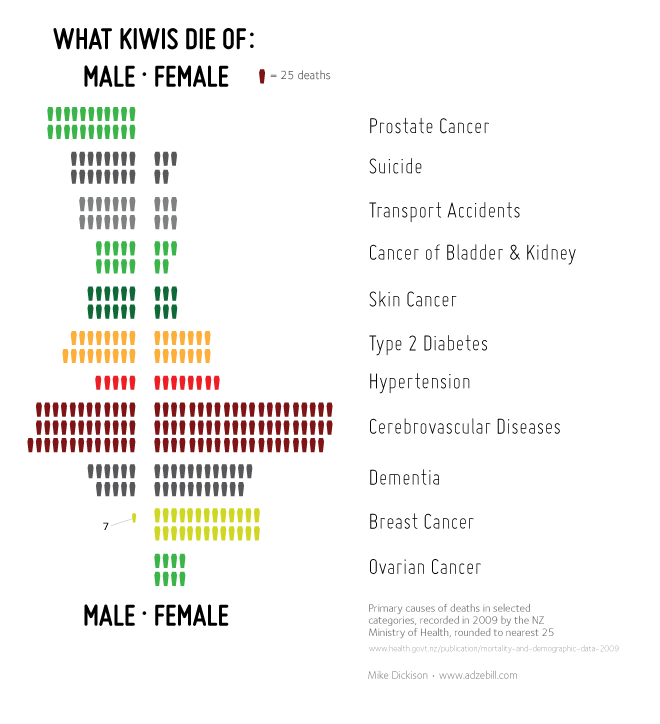
University of Auckland research scientist Dr Siouxsie Wiles (she’s the one who makes bacteria glow in the dark) has teamed up with data visualisation expert Mike Dickison to create a series of infographics looking at the morbidly fascinating topic of what New Zealanders die from.

Here’s one (click to enlarge). See the whole post on Siouxsie’s blog Infectious Thoughts  here.

battle-of-the-sexes-infographic1

January 30, 2013

How stats made Auckland City Hospital’s heart unit more efficient: Radio New Zealand

When Auckland City Hospital was experiencing a cardiac-surgery cancellation rate approaching 30%,  staff decided to ask a statistician for help.  The University of Auckland’s Ilze Ziedins is an expert in queuing theory and probability who often works in areas such as telecommunications and traffic; she jumped at the chance to collaborate on a problem that involved people.

Ilze and two of her graduate students, William Chen and Kim Frew, set out to develop a mathematical model of the Cardiavascular Intensive Care Unit using R, a statistical environment and programming language initially developed at The University of Auckland by Ross Ihaka and Robert Gentleman.

The model used real-life data to investigate different staffing and resourcing scenarios, and as a result was able to confirm what hospital staff had suspected – that the Cardiac Intensive Care Unit was the bottleneck creating problems. The model was also able to suggest an optimal staffing regime that took into account the irregular arrival of people in the unit, either from the operating theatre or as the result of an emergency. As a result, ICU director Andrew Kee and other team members were able to allocate more staff and reduce the cancellation rate to about 10%.

Alison Ballance, of Radio New Zealand show Our Changing World,  went to Auckland City Hospital to meet Ilze Ziedins and Cardiovascular Services Manager Pam Freeman. Listen to the 13-minute interview here.

January 17, 2013

Up-Goer Five biostatistics edition

Inspired by the XKCD cartoon describing the Saturn V rocket (US Space Team’s Up Goer Five) using only the 1000 most common words in English, people are now writing descriptions of their jobs.   Here’s mine:

I work with doctors who study how to avoid people being sick, especially in their hearts. It is easy to confuse different reasons for being sick, and I use numbers to help the doctors understand if the real cause is what they guess. I also study how to decide what numbers to get and from how many people, so that we can be sure, but not use too much money or time. I need to use a computer because there are lots of numbers to study, and I write stuff so the computer can help other people plan and use numbers to find things out. 

Also, there are lots of cool jobs for people who use numbers to help people find things out, so lots of students want to learn how. At my school, we (try to) help them learn.

This description has been brought to you by “the year for people all over the world to talk about using numbers to find things out”.

[Update: there’s a Storify list of these taken from Twitter. We’re on it thanks to Brendon’s tweet]

January 14, 2013

More about Lotto numbers …

From today’s New Zealand Herald:

Five Lotto numbers prove very lucky

Two Saturdays in a row, five of the same numbers were drawn in Lotto.

But a statistician says the chances of that happening aren’t as high as they may seem – 1 in 5500 ….

Said statistician is our very own Russell Millar. The rest of the story is here