Posts filed under General (3156)

April 18, 2012

All one family

From the Herald

It is one of the most improbable family connections. One is an actor famed as a languid Lothario. The other was one of the world’s most brutal but brilliant military leaders. Nevertheless geneticists say their analysis shows Tom Conti is indeed directly related to Napoleon Bonaparte.

For this to be true you need to stretch the usual meaning of “directly related” a little. More than a little.  In fact, using that definition, pretty much everyone in the world is probably related to Napoleon, so you also need to stretch the usual meaning of “improbable”.

What the story actually says is that Tom Conti and Napoleon have the same Y-chromosome haplogroup.  That is, they have a common great-great-…-great-grandfather in the very distant past, and so share a small chunk of DNA.   The Y chromosome is special only because it’s easier to track ancestors; Tom Conti will also share small chunks of DNA on other chromosomes with many other people, based on a common ancestor that wasn’t solely in the male line.

In our genetic research, we measure millions of common genetic variants on large numbers of people. Every one of those variants started off as a mutation in a single person, who is an ancestor of all the people who now carry the variant. For the variants we are interested in, this is at least 1% of all people with European ancestry.   These people are all related, in the Conti-Napoleon sense. And that’s just looking at one genetic variant out of millions.

When you go back as few as 30 generations, you have a billion ancestors, which is more than the number of people alive at that time. There has to be a lot of overlap and double-counting and it’s not at all surprising if there is overlap between your billion ancestors and Napoleon’s.  Or Winston Peters’s
 

April 16, 2012

The Data Journalism Handbook

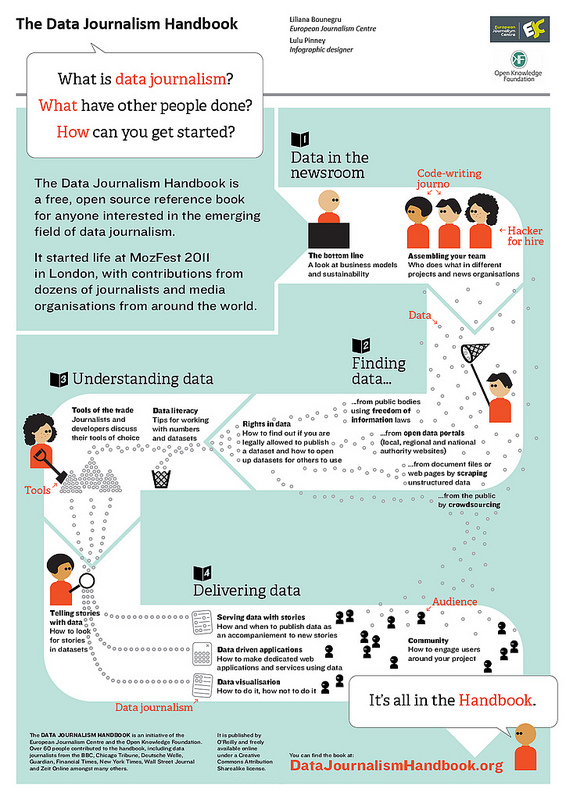
The Data Journalism Handbook is almost available, and they have released this poster which illustrates some of the topics covered in the book:

The Data Journalism Handbook is a free, open source reference book for anyone interested in the emerging field of data journalism. It is an international, collaborative effort involving dozens of data journalism’s leading advocates and best practitioners – including from the BBC, the Chicago Tribune, the Guardian, the Financial Times, the New York Times and many others. The project is an initiative of the European Journalism Centre and the Open Knowledge Foundation.

Slightly dodgy drug stats, episode n+1

In February, Stuff had a story about the 519 people who had a roadside drug impairment test since the changes to the law in November 2009, 429 of whom failed and showed up as having taken drugs.  This time it’s the Herald, with 568 drivers from November 2009 through this February.

Those numbers, presumably, are correct, though they don’t actually mean all that much.  The numbers were highest in the Bay of Plenty region, but that was because of more police effort and doesn’t necessarily indicate more impaired driving in that region.

An ESR study of blood samples from accidents gets quoted, as usual, this time by an AA spokesman and without any provenance

He noted a recent study that found of 1046 drivers who died in crashes between 2004 and 2009, about 35 per cent had cannabis or other drugs in their system, either on their own or in combination with alcohol.

As we pointed out last time this study came up, that’s not the same as impairment:

The ESR report defined someone as impaired by alcohol if they had blood alcohol greater than 0.03%, and said they tested positive for other drugs if the other drugs were detectable.   If you look at the report in more detail, although 351/1046 drivers had detectable alcohol in their blood, only 191/1046 had more than 0.08%.  At 0.03% blood alcohol concentration there may well be some impairment of driving, and near 0.08% there’s quite a lot, but we can’t attribute all those crashes to alcohol impairment rather than inexperience, fatigue, bad luck, or stupidity.  At least the blood alcohol concentrations are directly relevant to impairment.  An assay for other drugs can be positive long after the actual effect wears off. For example, a single use of cannabis will show up in a blood test for 2-3 days, and regular use for up to a week.  In  fact, the summary of the ESR report specifically warns “Furthermore, it is important to acknowledge that the presence of drugs and alcohol in the study samples does not necessarily infer significant impairment.”  Regular pot smokers who are scrupulously careful not to drive while high would still show up as affected by drugs in the ESR report


April 15, 2012

Multitasking helps with multitasking

Study reveals modern multi-tasking is good for your brain” says the Herald. This time they don’t say where they found the study, though we do get told the researchers’ names and institution, so perhaps a B- on provenance.

Multi-tasking in this day and age can leave you in a bit of a tizz.

Juggling too much technology at once – such as texting or browsing online while watching TV – is said to make you less efficient.

But Chinese researchers have found that multi-tasking 21st-century style can be good for the brain.

What they actually found was that multitasking made you better at a specific multitasking-type computer test, which    is interesting, but isn’t at all relevant to whether ‘Juggling too much technology at once’ makes you less efficient.

Connoisseurs of the tabloid science style will not be surprised to find that the story came via The Daily Mail. A better source is the journal’s press release, which also links to the journal article.

April 13, 2012

The facts speak for themselves?

Two headlines based on the same data from QV.  In the Herald

Auckland house values soar

and in Stuff

House prices ease in March

And it’s not just the sub-editor’s fault; the headlines match the text of the story in both cases.

April 2, 2012

Big data and Downton Abbey

The hit British TV series Downton Abbey has drawn some fire for alleged anachronisms: phrases that just don’t fit Georgian-era Britain.

Ben Schmidt has unleashed gigabytes of data on this problem, with the Google Books n-grams.  When Google digitized lots of books, it also tabulated the frequencies of words, pairs of words, triples of words, and so on, by year of publication. In two posts, Ben compares word pairs from the TV script with the Google frequencies for books published in the 1910s and the 1990s.   The comparison shows up several two-word phrases that were much less common in Downton Abbey’s historical period than they are now, but still appear in the script.  In some cases these phrases were not observed at all in written English until much later; in other cases they existed but were rare.

As a check on the process, he also looks at a genuine play from the period, George Bernard Shaw’s Heartbreak House, which passes the phrase test with flying colors.

April 1, 2012

Heart disease vaccine?

Prime News tonight (I don’t see how to link to an individual story there) reported on a ‘vaccine for heart disease’.  This is really exciting research from the Karolinska Insitute in Sweden, studying the role of the immune system in coronary artery plaque.  The previous belief was that damaged (oxidised) LDL cholesterol, which is a consequence of plaque, triggered the immune responses; the researchers showed that the immune response was to normal LDL cholesterol.  They also showed that a vaccine blocking the immune response led to reduction of white blood cell involvement and shrinkage of plaques in transgenic mice.

Prime News went on to say that a vaccine might be available within five years.  I hope this isn’t realistic. The initial human studies to show an effect on plaque could easily be done in that time, but not a trial that actually demonstrates reductions in heart attack rates.

There is lots of depressing experience in cardiovascular research with good ideas for treatments that affect a biological measurement related to heart disease, but don’t actually reduce the risk of heart attack or death, because something goes wrong.   The US FDA, who will be the primary group that researchers have in mind when designing trials, is fairly insistent on having actual evidence of clinical benefit from new treatments.  Their Cardiovascular & Renal advisory committee is one of the most tough-minded, ever since it relied on mere biological surrogates of benefit to make what was probably the worst drug approval decision in history: approving drugs to regulate heart rhythm without evidence that they actually prevented cardiac arrest.  They didn’t.


March 31, 2012

Statistics New Zealand Digital Yearbooks

Statistics New Zealand has been undertaking the task of digitising their Yearbooks, dating back to 1893. The digitisation is not simple scanning which would not allow the easy copying of data.

One method of obtaining data which I have tested and appears to work satisfactorily is to use Excel 2010. Go to the Data tab, and select From Web. In the address box give the address of the page containing the table you wish to import. (For example from the 1893 Yearbook, I chose the page with the address http://www3.stats.govt.nz/New_Zealand_Official_Yearbooks/1893/NZOYB_1893.html#id333C618.) Then go to the table you want, click on the Yellow Arrow as directed, and you have your table in Excel.

I was alerted to this project by the interview last Saturday by Kim Hill of Claire Stent from Statistics New Zealand. You can get a podcast or listen to this by going to http://www.radionz.co.nz/national/programmes/saturday/20120324.

I would nominate this project for Stat of the Week, but I don’t think I am eligible.

March 30, 2012

Lotto silliness

As my good friend and colleague Thomas Lumley points out we have plenty of Lotto-based silliness to tide us over until the next stupid health related press release from a conference with no quality checks. Case-in-point is the article Powerball could be in the stars in Thursday’s NZ Herald (29 March, 2012, A5): (also nominated by Sammie Jia for Stat of the Week).

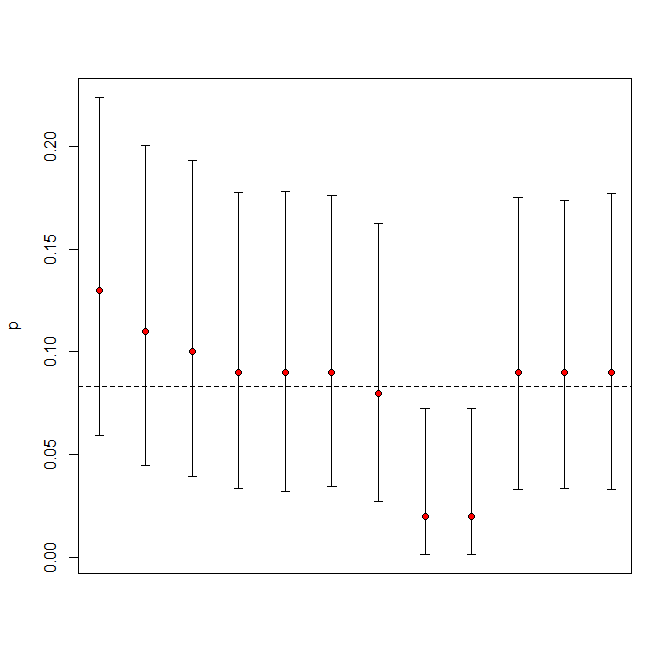
The article reports the frequency of zodiac signs from a survey of 104 first division Lotto winners, and gleefully touts Taurus as the luckiest star sign with 13% of the total. The article gives us a summary table:

Taurus 13%
Libra 11%
Capricorn 10%
Aquarius 9%
Virgo 9%
Pisces 9%
Leo 8%


Of course, all keen Statschat readers will note that this table does not add up to 100%, nor does it show all twelve zodiac signs, which is not very helpful. Buried in the text is the additional information that Aries and Cancer combined make up 4% of the total.

If we spread the remaining probability over Gemini, Sagittarius and Scorpio, and make the not entirely justified assumption that the distribution of zodiac signs is uniform (which is exactly what the NZ Herald has done), then we can perform a simple chi-squared test of uniformity. This yields a P-value of 0.22, which for most frequentists isn’t exactly compelling evidence.

Being a Bayesian, I prefer to assume multinomial sampling with the prior on the probability of success being uniform. The figure below shows posterior credible intervals (based on 10,000 samples) for the true probability of success. The red dots are the observed values. The dashed line is the equal probability line (0.083 = 1/12).


All of the intervals overlap confirming our statistical intuition that all we are really observing is sampling variation. Yes, Ares and Cancer do fall below the line, but they are not significantly different from the other signs. You can, of course, not believe me – in which case Thomas has some tickets from last week’s draw going very cheap and your chance of winning is almost the same.

March 28, 2012

Internet congestion

There’s recently been a lot of publicity about the views on internet congestion of a visiting Brit.  Next Tuesday, in Auckland, there’s a public lecture on internet congestion by a different visiting Brit, one who actually knows something about the topic.   Frank Kelly is a Professor of Mathematics at Cambridge, and a Fellow of the Royal Society.  His research is on the design and control of  networks: both abstract ones and concrete ones such as the Internet and the traffic system.

Professor Kelly is visiting the University of Auckland to work with researchers here, and will kick off his visit with the public lecture:

The Internet has attracted the attention of many theoreticians, eager to understand the remarkable success of this diverse and complex artefact. One strand of this effort has been a framework that allows the various detailed algorithms used to control congestion, choose routes and allocate resources to be seen as a distributed mechanism solving a global optimization problem. The talk will review the framework, and discuss topics such as fairness and stability, as well as current engineering efforts to improve the reliability and robustness of the Internet.

 Venue:  Fale Pasifika, University of Auckland (20 Wynyard St, Auckland Central)
Time: 6pm-8pm, Tuesday April 3.