Posts filed under Graphics (394)

May 7, 2013

Not adding up

As you know, the petition for a referendum over asset sales has not reached its goal yet, due to lots of invalid signatures. This is not a new problem — the petition over the anti-smacking law initially had 17% invalid signatures and also fell short of its threshold on the first round — but it does seem to be worse than usual.

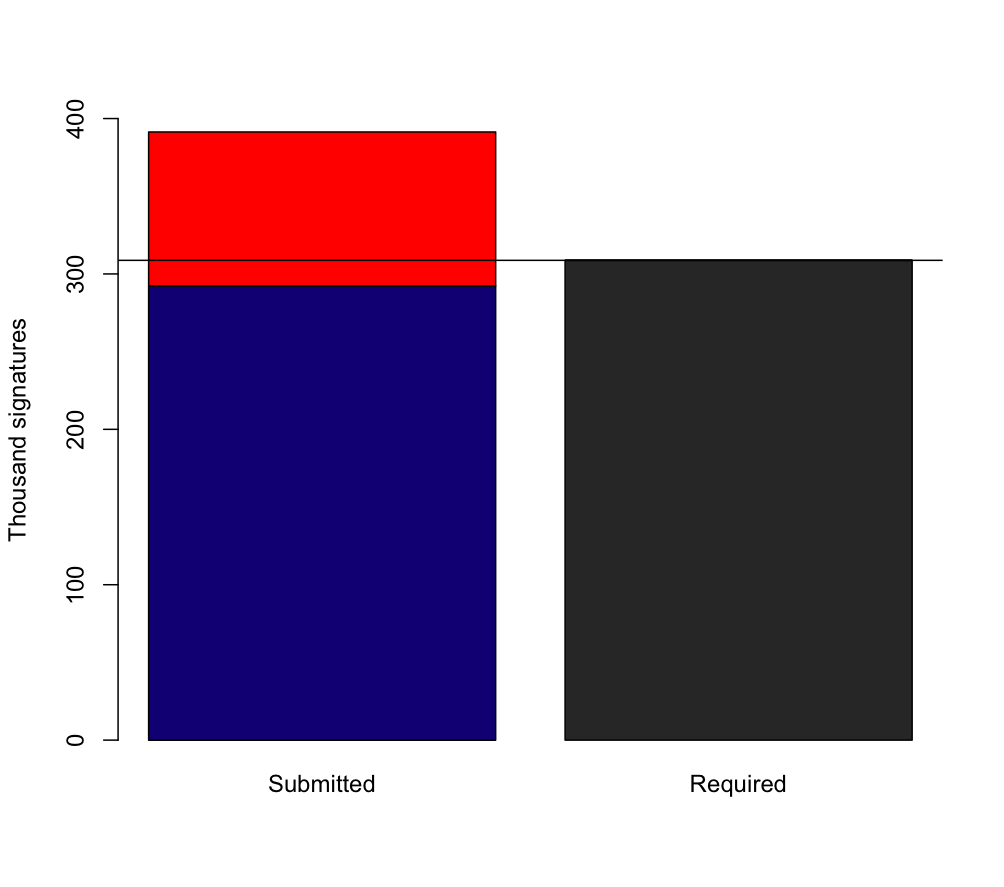
3News displayed this graph of the shortfall

petition shortfall


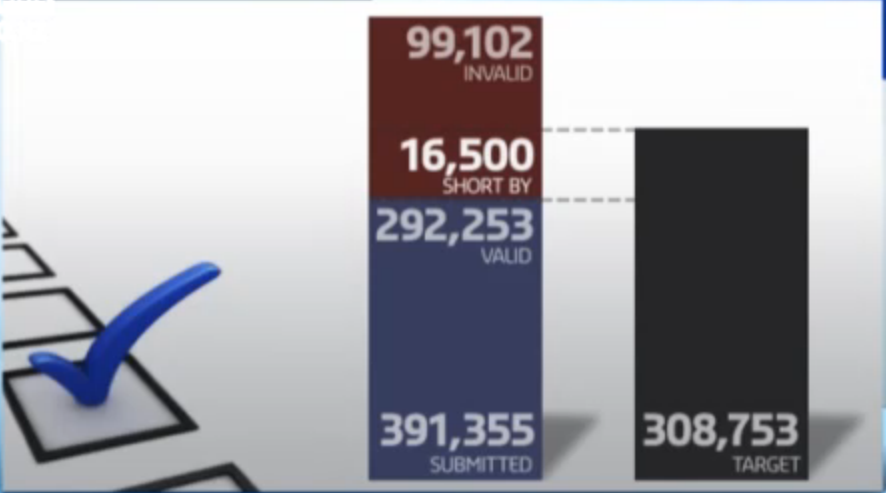
It seemed to me that the 16,500 bar was a bit wider that I’d expect, so I checked on the video from the website.  On my screen capture, which I think is what you get if you click on the image, the black bar has 872 signatures per pixel, the blue bar has 1018 signatures per pixel, the whole red bar has 535 signatures per pixel, and the 16500 shortfall has 232 signatures per pixel.  That is, the vertical scale for the shortfall is about four times that for the valid signatures.

I’m really not accusing 3News of deliberately distorting the numbers — it looks to me as if the shortfall bar has been made the right height to contain its text, that the blue+red bars height is scaled to the available screen estate, and that the black bar is scaled to the total blue+red height .  But it’s a pity that the result is to amplify the visual size of the shortfall — and if the visual size weren’t important the graph would be a complete waste of time.

Scaled in proportion, the bars look like this

shortfall


May 6, 2013

A good graph

StatsChat spends a lot of time criticizing bad graphs.  Here’s a simple but good graph, from the Calculated Risk blog

EmployRecAlignedApr2013


The graph shows employment during US recessions, aligned at the point of maximum job loss.  It clearly demonstrates that the current Great Recession is very different from all the other post-WWII recessions, both in depth and in duration.

It would be easy to quibble with some design choices in the graph, but it fulfills the basic requirements admirably: the real difference is visually dramatic, and it wouldn’t be visually dramatic if it weren’t real.

Developing data visualisations: draft and redraft

As I’ve commented before, it’s hard to find examples of the drafting and redrafting process for graphics, which is  just as necessary as it is for text.

A post at Harvard Business Review describes the process, in the setting of a large non-profit organisation, with this as the result

bladt1

Frontiers in pie-charts

The `pie’ in pie-chart is a metaphor — the charts are divided into slices in the way that certain kinds of pie are, and the slices add up to the whole pie.

Or, at least, that’s usually the idea.  One of StatChats’s foreign correspondents sent in this effort from the BBC

piefail


This kind of pie doesn’t get divided into slices — it would just fall apart.  And in this graph the slices don’t add up to anything meaningful — for those of you not up on the British sports scene: there are actually more than ten football clubs.  In the graphic we have Premier League teams such as Arsenal and Manchester City mixed in with  Albion Rovers and Brechin City from the Scottish 2nd division.

The pie price pie exemplifies a general rule, if you have to write all the data values on your graph, the graph isn’t doing its share of the work.

April 30, 2013

Briefly

Two small gems from the Twitter feed

April 27, 2013

Facebook data analysis and visualisation

From the Stephen Wolfram blog, lots of analysis of Facebook friend data with well-designed graphs.  For example, this graph shows how the mean age of your `friends’ is related to your age.

median-age-friends-vs-age2


Those under 40 have Facebook friends of about the same age, but after than the age distribution levels off and becomes much more variable.

April 25, 2013

Infographic of the week

Every so often, someone comes up with a creative way to make pie charts less informative.  This week’s innovation comes to you from Wired magazine.

explodedpie

Note that it’s structured like a bar chart, except that all the `bars’ are the same height, and the wedges are turned at different angles, to make the widths harder to estimate.  The numbers are presented as if their heights mean something, but actually not.

There are also some subtleties to the design.  For example, at first glance you might think the left-to-right order of the wedges reflects the time period each one corresponds to, so that the fact they aren’t largest to smallest means something. Sadly, no.

(via @acfrazee and @kwbroman)

April 17, 2013

Visualising New York income inequality

From the New Yorker, a set of graphs showing how median household income varies along each subway line, based on the census tract containing each station.

Here’s the graph if you take the A-train:

atrain

(via @brettkeller)


April 10, 2013

Another NZ blog

JustSpeak is

a non-partisan network of young people speaking to, and speaking up for a new generation of thinkers who want change in our criminal justice system.

I’m linking because they have a good visualisation of the recently-released police crime statistics, comparing the proportion of apprehensions leading to prosecution among Maori and Pakeha youth. The back-to-back bar charts take advantage of the brain’s ability to detect lack of symmetry.

youfcrime

I probably would have left out the homicide category, which has too few to compare, and it would be interesting to see if small gaps between the categories help.

The real problem is in interpretation.  It’s hard to say what you’d expect just from economic differences and differences in where people live, without any differences in how they are treated by police. A higher proportion of prosecutions could mean the police are using their discretion to prosecute more Maori youth, but a lower proportion of prosecutions could just as easily have been interpreted as harassment of innocent Maori youth.


April 8, 2013

Explore your budget

Keith Ng’s annual NZ Budget visualization seems to be up. Go play.

You might also like last years’ one.  And possibly even the 2011 radioactive space donut.