Posts filed under Sports statistics (1776)

October 21, 2011

Our RWC 2015 team was born in March 1987

Were you born between January and March in 1987? Congratulations – you’re picked for the RWC 2015 New Zealand team!

This rather ridiculous (and untrue) piece of information I just made up was concocted by examining some data and coming to an unsubstantiated conclusion. I was inspired to do this because I read recently in a British tabloid that one should “Give birth in March for a pilot” and “Victoria Beckham’s [daughter] likely to become bricklayer”. Finding the exact source of the study from the Office of National Statistics was troublesome but instead led me to a lot of advice for when to get pregnant so your child could be a dentist.

Without seeing the original study we cannot say what got twisted around between when the UK Census was collected and when the tabloids hit the news stands. The methodological insight that we get from the Daily Mail suggests that the monthly professions-of-choice are those “with the greatest percentage above the monthly average”. Well, pick a bunch of numbers and there will be a biggest one! It doesn’t necessarily condemn your January-born aspiring sheet-metal worker to the life of a GP.

A further concern arises from multiple comparisons. The more things you look for, the more “oddities” or coincidences you’ll find – none of them have to mean anything at all. Compare 19 professions against 12 months and that’s 228 chances to find something a little unusual. You’re sure to go away with a juicy collection of headlines for these pains. Even further, oddities in the statistical sense can be decidedly underwhelming in practical terms, if we are dealing with huge numbers of respondents as in the UK census. It might be statistically all-but-certain that “Spring birth conveys height advantage” but the height advantage in question turns out to be only 6 mm.

One place where we can see a real and well-studied effect from month of birth is sport. Sport is seasonal and, unlike dentistry, has a very clear starting time every year. If sports are organised by age-group and you are among the oldest in the group, you have almost a year’s advantage over the youngest. For children, a year is a big deal in terms of size, physical coordination, and maturity – and this advantage snowballs throughout childhood as you get picked for the best teams, practise more, play against better opponents, and on and on. Ad Dudink examined Dutch and English soccer players in 1994, following in the footsteps of Barnsley and Thompson who examined Canadian hockey players in 1985 and 1988.

As for whether you’ll be a dentist or a bricklayer, it is possible that this can be affected by birth month, because the age differential in the school year affects children’s academic outcomes in a similar (but less drastic) way to sports teams. In the UK, children start school in September, so September-born children have a year’s maturity advantage over their August-born classmates. This is not a temporary effect: studies have shown that the advantage/disadvantage continues to school-leaving exams and university.

In New Zealand our school season begins in February, so don’t expect the same education outcomes to birth month misconnections as the United Kingdom.

But how about them All Blacks?

I extracted the place and date of birth of each of the team members listed for the All Blacks and French teams from the Rugby World Cup 2011 website, which I then ran through sed, R and finally dumped into Excel.

Then I separated the players out into hemisphere of birth, as each hemisphere has a different season start. All the French players were born in the northern hemisphere, and all the All Blacks were born in the southern hemisphere, making my life a bit easier.

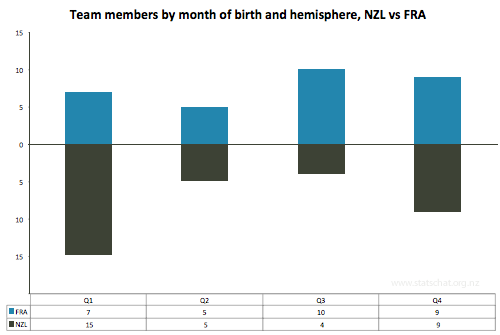
I’ve plotted them here. French (blue) above the equator, and All Blacks (black) below:
Graph of data

Team members by quarter of birth and hemisphere, NZL vs FRA

Eyeballing that does suggest some stories about when to be born if you want to play for the All Blacks or the French, but being born in January to March isn’t going to get you straight onto the All Black squad. There are many other factors that influence your selection:

Eat a healthy diet, high in Weet-Bix, exercise often, and most importantly, you can increase your chances of being on the squad by starting to play rugby.

A few references and citations for further reading:

^ Jessica Utts (2003). What Educated Citizens Should Know About Statistics and Probability. The American Statistician. May 1, 2003, 57(2): 74-79. doi:10.1198/0003130031630

^ Weber GW, Prossinger H, Seidler H (1998). Height depends on month of birth. Nature, 391(6669), 754-755 doi:10.1038/35781

^ Dudink A (1994). Birth date and sporting success. Nature, 368(6472), 592.

^ Barnsley RH, Thompson AH, Barnsley PE (1985). Hockey success and birth-date: The relative age effect. Journal of the Canadian Association for Health, Physical Education, and Recreation, Nov.-Dec., 23-28.

^ Barnsley RH, Thompson AH (1988). Birthdate and success in minor hockey: The key to the N.H.L.. Canadian Journal of Behavioral Science 20, 167-176.

Wiseman, R (2008). Quirkology: The Curious Science Of Everyday Lives, 28-29 ISBN: 9780330448093

Back in 2008 the All Black squad was also dominated by January – March births: http://rowansimpson.com/­2008/12/07/31-december/

October 18, 2011

Predictions for RWC 2011 Finals

Ratings at the Start of RWC 2011

Here are the team ratings at the start of RWC 2011.

Rating
New Zealand 30.92
Australia 22.97
South Africa 20.50
England 13.19
France 11.42
Wales 9.99
Ireland 8.65
Argentina 6.42
Scotland 4.50
Italy -2.78
Samoa -7.38
Canada -15.03
Tonga -15.11
Fiji -15.70
Japan -22.52
Georgia -25.35
USA -27.29
Romania -28.18
Russia -33.12
Namibia -38.21


Current Team Ratings

Here are the team ratings for the finalists as of October 17, 2011

Rating
New Zealand 30.88
Australia 21.57
Wales 14.84
France 10.38


There has been no change in the ratings for Australia and New Zealand after the semi-finals because that result was predicted very accurately. France’s rating has increased by half a point and Wales’ decreased by the same amount as a result of their match. Surprisingly France’s rating has dropped a point since the start of the tournament, yet they are in the final. That is mostly due to the 5 point loss to Tonga where the prediction was they should win by 25 points. Their rating also dropped as a result of the Japan game.

Performance So Far

So far there have been 46 matches played, 40 of which were correctly predicted, a success rate of 87%.

Here are the predictions for the games so far.

Game Date Score Prediction Correct
1 New Zealand vs. Tonga Sep 09 41 – 10 51.03 TRUE
2 Argentina vs. England Sep 10 9 – 13 -6.77 TRUE
3 Fiji vs. Namibia Sep 10 49 – 25 22.51 TRUE
4 France vs. Japan Sep 10 47 – 21 33.94 TRUE
5 Scotland vs. Romania Sep 10 34 – 24 32.68 TRUE
6 Australia vs. Italy Sep 11 32 – 6 25.75 TRUE
7 Ireland vs. USA Sep 11 22 – 10 35.93 TRUE
8 South Africa vs. Wales Sep 11 17 – 16 10.51 TRUE
9 Samoa vs. Namibia Sep 14 49 – 12 30.95 TRUE
10 Scotland vs. Georgia Sep 14 15 – 6 28.04 TRUE
11 Tonga vs. Canada Sep 14 20 – 25 1.53 FALSE
12 Russia vs. USA Sep 15 6 – 13 -7.75 TRUE
13 New Zealand vs. Japan Sep 16 83 – 7 56.20 TRUE
14 Argentina vs. Romania Sep 17 43 – 8 33.00 TRUE
15 Australia vs. Ireland Sep 17 6 – 15 16.26 FALSE
16 South Africa vs. Fiji Sep 17 49 – 3 35.32 TRUE
17 England vs. Georgia Sep 18 41 – 10 36.79 TRUE
18 France vs. Canada Sep 18 46 – 19 25.29 TRUE
19 Wales vs. Samoa Sep 18 17 – 10 17.64 TRUE
20 Italy vs. Russia Sep 20 53 – 17 30.27 TRUE
21 Tonga vs. Japan Sep 21 31 – 18 9.44 TRUE
22 South Africa vs. Namibia Sep 22 87 – 0 59.41 TRUE
23 Australia vs. USA Sep 23 67 – 5 46.40 TRUE
24 England vs. Romania Sep 24 67 – 3 39.03 TRUE
25 New Zealand vs. France Sep 24 37 – 17 24.98 TRUE
26 Argentina vs. Scotland Sep 25 13 – 12 5.63 TRUE
27 Fiji vs. Samoa Sep 25 7 – 27 -10.39 TRUE
28 Ireland vs. Russia Sep 25 62 – 12 42.28 TRUE
29 Wales vs. Namibia Sep 26 81 – 7 50.92 TRUE
30 Canada vs. Japan Sep 27 23 – 23 9.11 FALSE
31 Italy vs. USA Sep 27 27 – 10 24.34 TRUE
32 Georgia vs. Romania Sep 28 25 – 9 5.16 TRUE
33 South Africa vs. Samoa Sep 30 13 – 5 28.08 TRUE
34 Australia vs. Russia Oct 01 68 – 22 56.36 TRUE
35 England vs. Scotland Oct 01 16 – 12 12.96 TRUE
36 France vs. Tonga Oct 01 14 – 19 25.06 FALSE
37 Argentina vs. Georgia Oct 02 25 – 7 28.92 TRUE
38 Ireland vs. Italy Oct 02 36 – 6 12.30 TRUE
39 New Zealand vs. Canada Oct 02 79 – 15 50.88 TRUE
40 Wales vs. Fiji Oct 02 66 – 0 28.95 TRUE
41 Ireland vs. Wales Oct 08 10 – 22 -3.92 TRUE
42 England vs. France Oct 08 12 – 19 4.87 FALSE
43 South Africa vs. Australia Oct 09 9 – 11 -0.20 TRUE
44 New Zealand vs. Argentina Oct 09 33 – 10 31.00 TRUE
45 Wales vs. France Oct 15 8 – 9 5.49 FALSE
46 New Zealand vs. Australia Oct 16 20 – 6 14.37 TRUE


Predictions for the Finals

Here are the predictions for the finals

Game Date Winner Prediction
1 Wales vs. Australia Oct 21 Australia -6.70
2 New Zealand vs. France Oct 23 New Zealand 25.50


October 15, 2011

Semi-Final Predictions for RWC 2011

Current Team Ratings

Here are the team ratings for the semi-finalists as of October 10, 2011.

Rating
New Zealand 30.91
Australia 21.54
Wales 15.35
France 9.86


There has not been much change in the ratings as a result of the Quarter Final games. Wales and France have each improved their rating by about a point. The All Blacks have gone down by half a point.

Performance So Far

So far there have been 44 matches played, 39 of which were correctly predicted, a success rate of 88.6%.

Here are the predictions for the games so far.

Game Date Score Prediction Correct
1 New Zealand vs. Tonga Sep 09 41 – 10 51.03 TRUE
2 Argentina vs. England Sep 10 9 – 13 -6.77 TRUE
3 Fiji vs. Namibia Sep 10 49 – 25 22.51 TRUE
4 France vs. Japan Sep 10 47 – 21 33.94 TRUE
5 Scotland vs. Romania Sep 10 34 – 24 32.68 TRUE
6 Australia vs. Italy Sep 11 32 – 6 25.75 TRUE
7 Ireland vs. USA Sep 11 22 – 10 35.93 TRUE
8 South Africa vs. Wales Sep 11 17 – 16 10.51 TRUE
9 Samoa vs. Namibia Sep 14 49 – 12 30.95 TRUE
10 Scotland vs. Georgia Sep 14 15 – 6 28.04 TRUE
11 Tonga vs. Canada Sep 14 20 – 25 1.53 FALSE
12 Russia vs. USA Sep 15 6 – 13 -7.75 TRUE
13 New Zealand vs. Japan Sep 16 83 – 7 56.20 TRUE
14 Argentina vs. Romania Sep 17 43 – 8 33.00 TRUE
15 Australia vs. Ireland Sep 17 6 – 15 16.26 FALSE
16 South Africa vs. Fiji Sep 17 49 – 3 35.32 TRUE
17 England vs. Georgia Sep 18 41 – 10 36.79 TRUE
18 France vs. Canada Sep 18 46 – 19 25.29 TRUE
19 Wales vs. Samoa Sep 18 17 – 10 17.64 TRUE
20 Italy vs. Russia Sep 20 53 – 17 30.27 TRUE
21 Tonga vs. Japan Sep 21 31 – 18 9.44 TRUE
22 South Africa vs. Namibia Sep 22 87 – 0 59.41 TRUE
23 Australia vs. USA Sep 23 67 – 5 46.40 TRUE
24 England vs. Romania Sep 24 67 – 3 39.03 TRUE
25 New Zealand vs. France Sep 24 37 – 17 24.98 TRUE
26 Argentina vs. Scotland Sep 25 13 – 12 5.63 TRUE
27 Fiji vs. Samoa Sep 25 7 – 27 -10.39 TRUE
28 Ireland vs. Russia Sep 25 62 – 12 42.28 TRUE
29 Wales vs. Namibia Sep 26 81 – 7 50.92 TRUE
30 Canada vs. Japan Sep 27 23 – 23 9.11 FALSE
31 Italy vs. USA Sep 27 27 – 10 24.34 TRUE
32 Georgia vs. Romania Sep 28 25 – 9 5.16 TRUE
33 South Africa vs. Samoa Sep 30 13 – 5 28.08 TRUE
34 Australia vs. Russia Oct 01 68 – 22 56.36 TRUE
35 England vs. Scotland Oct 01 16 – 12 12.96 TRUE
36 France vs. Tonga Oct 01 14 – 19 25.06 FALSE
37 Argentina vs. Georgia Oct 02 25 – 7 28.92 TRUE
38 Ireland vs. Italy Oct 02 36 – 6 12.30 TRUE
39 New Zealand vs. Canada Oct 02 79 – 15 50.88 TRUE
40 Wales vs. Fiji Oct 02 66 – 0 28.95 TRUE
41 Ireland vs. Wales Oct 08 10 – 22 -3.92 TRUE
42 England vs. France Oct 08 12 – 19 4.87 FALSE
43 South Africa vs. Australia Oct 09 9 – 11 -0.20 TRUE
44 New Zealand vs. Argentina Oct 09 33 – 10 31.00 TRUE

Predictions for the Semi-Finals

Here are the predictions for the semi-final games

Game Date Winner Prediction
1 Wales vs. France Oct 15 Wales 5.50
2 New Zealand vs. Australia Oct 16 New Zealand 14.40


October 5, 2011

Rugby World Cup 2011 predictions from David Scott …

Ratings at the Start of RWC 2011

Here are the team ratings at the start of RWC 2011.

  Rating
New Zealand 30.92
Australia 22.97
South Africa 20.50
England 13.19
France 11.42
Wales 9.99
Ireland 8.65
Argentina 6.42
Scotland 4.50
Italy -2.78
Samoa -7.38
Canada -15.03
Tonga -15.11
Fiji -15.70
Japan -22.52
Georgia -25.35
USA -27.29
Romania -28.18
Russia -33.12
Namibia -38.21

Of interest in this table is that the eight top-ranked teams are the ones which have progressed to the quarter finals.

Current Team Ratings

Here are the team ratings as of October 05, 2011

  Rating
New Zealand 31.55
Australia 21.39
South Africa 21.20
Wales 14.71
England 13.78
Ireland 10.79
France 8.91
Argentina 5.56
Scotland 2.25
Samoa -3.67
Italy -4.34
Tonga -11.34
Canada -16.43
Fiji -20.17
Georgia -21.62
Japan -23.03
USA -26.09
Romania -29.39
Russia -33.31
Namibia -42.87

The most notable change here is the improvement of Wales taking it above England. Ireland has also improved, but France is down. Of the lesser teams, Samoa, Tonga and Georgia have improved, Fiji has declined and Namibia has deservedly sunk further into the mire.

Performance So Far

So far there have been 40 matches played, 36 of which were correctly predicted, a success rate of 90%.
Here are the predictions for the games so far.

  Game Date Score Prediction Correct
1 New Zealand vs. Tonga Sep 09 41 – 10 51.03 TRUE
2 Argentina vs. England Sep 10 9 – 13 -6.77 TRUE
3 Fiji vs. Namibia Sep 10 49 – 25 22.51 TRUE
4 France vs. Japan Sep 10 47 – 21 33.94 TRUE
5 Scotland vs. Romania Sep 10 34 – 24 32.68 TRUE
6 Australia vs. Italy Sep 11 32 – 6 25.75 TRUE
7 Ireland vs. USA Sep 11 22 – 10 35.93 TRUE
8 South Africa vs. Wales Sep 11 17 – 16 10.51 TRUE
9 Samoa vs. Namibia Sep 14 49 – 12 30.95 TRUE
10 Scotland vs. Georgia Sep 14 15 – 6 28.04 TRUE
11 Tonga vs. Canada Sep 14 20 – 25 1.53 FALSE
12 Russia vs. USA Sep 15 6 – 13 -7.75 TRUE
13 New Zealand vs. Japan Sep 16 83 – 7 56.20 TRUE
14 Argentina vs. Romania Sep 17 43 – 8 33.00 TRUE
15 Australia vs. Ireland Sep 17 6 – 15 16.26 FALSE
16 South Africa vs. Fiji Sep 17 49 – 3 35.32 TRUE
17 England vs. Georgia Sep 18 41 – 10 36.79 TRUE
18 France vs. Canada Sep 18 46 – 19 25.29 TRUE
19 Wales vs. Samoa Sep 18 17 – 10 17.64 TRUE
20 Italy vs. Russia Sep 20 53 – 17 30.27 TRUE
21 Tonga vs. Japan Sep 21 31 – 18 9.44 TRUE
22 South Africa vs. Namibia Sep 22 87 – 0 59.41 TRUE
23 Australia vs. USA Sep 23 67 – 5 46.40 TRUE
24 England vs. Romania Sep 24 67 – 3 39.03 TRUE
25 New Zealand vs. France Sep 24 37 – 17 24.98 TRUE
26 Argentina vs. Scotland Sep 25 13 – 12 5.63 TRUE
27 Fiji vs. Samoa Sep 25 7 – 27 -10.39 TRUE
28 Ireland vs. Russia Sep 25 62 – 12 42.28 TRUE
29 Wales vs. Namibia Sep 26 81 – 7 50.92 TRUE
30 Canada vs. Japan Sep 27 23 – 23 9.11 FALSE
31 Italy vs. USA Sep 27 27 – 10 24.34 TRUE
32 Georgia vs. Romania Sep 28 25 – 9 5.16 TRUE
33 South Africa vs. Samoa Sep 30 13 – 5 28.08 TRUE
34 Australia vs. Russia Oct 01 68 – 22 56.36 TRUE
35 England vs. Scotland Oct 01 16 – 12 12.96 TRUE
36 France vs. Tonga Oct 01 14 – 19 25.06 FALSE
37 Argentina vs. Georgia Oct 02 25 – 7 28.92 TRUE
38 Ireland vs. Italy Oct 02 36 – 6 12.30 TRUE
39 New Zealand vs. Canada Oct 02 79 – 15 50.88 TRUE
40 Wales vs. Fiji Oct 02 66 – 0 28.95 TRUE


Predictions for the Quarter Finals

Here are the predictions for the quarter final games

  Game Date Winner Prediction
1 Ireland vs. Wales Oct 08 Wales -3.90
2 England vs. France Oct 08 England 4.90
3 South Africa vs. Australia Oct 09 Australia -0.20
4 New Zealand vs. Argentina Oct 09 New Zealand 31.00

Most interesting here is the very narrow gap between South Africa and Australia. That game could clearly go either way.

Source File: hwriterPredictions.R

(Page generated on Wed Oct 05 13:39:15 2011 by hwriter 1.3)

September 5, 2011

Was Paul the Octopus Lucky or Skilful (and how about Richie McCow)?

Guest post by Tony Cooper

Paul The Octopus is famous for picking the winner in 8 out of 8 games at the FIFA World Cup in 2010. How did he achieve this amazing feat? Was he skilled or was he lucky?

To get 8 out of 8 games right where each game is a 50-50 guess the probability is 0.5 x 0.5 x 0.5 x 0.5 x 0.5 x 0.5 x 0.5 x 0.5 = 0.0039 (or one chance in 256). This seems too incredible. An octopus can’t be that good.

Where is the flaw in this probabilistic reasoning?

The answer is that the probability that Paul got a game right was not 0.5 but more. Much more. In fact the probability was much closer to one. Here is the explanation:

Paul, a German octopus, was only used to pick German games, usually picked the German team, and the German team usually won. So the chance that Paul picked the winner was more than 0.5 for each game. That accounts for 5 of the 8 games.

What about the games that Germany lost and the game where Germany didn’t play? Let’s take a guess.

This tournament was not Paul’s first time at playing the game. He had learned previously that there was always food under the German flag. Paul – with some ability to distinguish the flags of different countries – usually went for the German black, red, and yellow. He might have had monochrome eyesight which is why he picked Serbia as a winner in the game against Germany because in monochrome the Serbian and German flags look similar.

For the final Germany wasn’t playing so Paul went for the most German looking flag – that of Spain (red, yellow, red). He seems to have a preference for that flag since he also predicted the win of Spain over Germany in the semi-finals. All flags picked by Paul had horizontal stripes.

So Paul was lucky but not as lucky as the 1 in 256 chance suggests. His main luck was that his team was one of the best teams in the tournament and that some of the other good teams had similar flags.

Will Richie McCow be successful at picking the winner of the All Black games in the Rugby World Cup? Possibly – as long as he keeps picking the All Blacks and the All Blacks keep winning. Will the All Blacks keep winning? That’s a story for a later article.

Tony Cooper, formerly of the Applied Mathematics Division of the DSIR, is a Quantitative Analyst with Double-Digit Numerics of Auckland. He consults mainly in the investment, finance, and electricity industries. His research interests include risk and volatility prediction, alpha generation, data mining, statistical learning, and time series analysis.

June 17, 2011

Brad Pitt uses statistics

Almost three months before it’s due to hit theaters, Sony Pictures has finally released a full-length trailer for Moneyball, an adaptation of Michael Lewis’ 2003 bestseller that chronicled how the Oakland Atheltics used data analysis and advanced calculations to field a winning baseball team on the cheap.

Read more