January 8, 2020

Misleading with maps

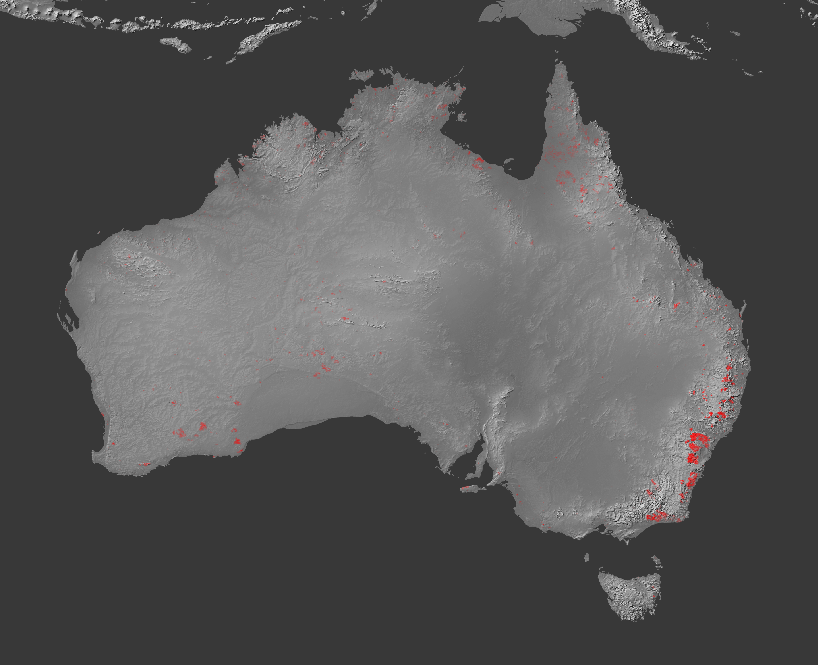
There are lots of maps going around of the Australian fires. Some of them are very good, others indicate ways you can accidentally or deliberately mislead people.

This one was created as a 3-D visualisation by Anthony Hearsey, based on infra-red hotspot data accumulated over the fire period. It has been circulated as a ‘NASA photo’, which it isn’t.

If you think of it as a map or photo, the image exaggerates the scale of the fires by accumulating burning areas over time, and by the ‘glow’ effect in the 3-d rendering.  As Nick Evershed, a Guardian data journalist, points out, it is also exaggerated because it ’rounds up’ each spot of fire into a whole map grid square.  Nick produced this version with the accumulated fires over time but without the rounding and glow.

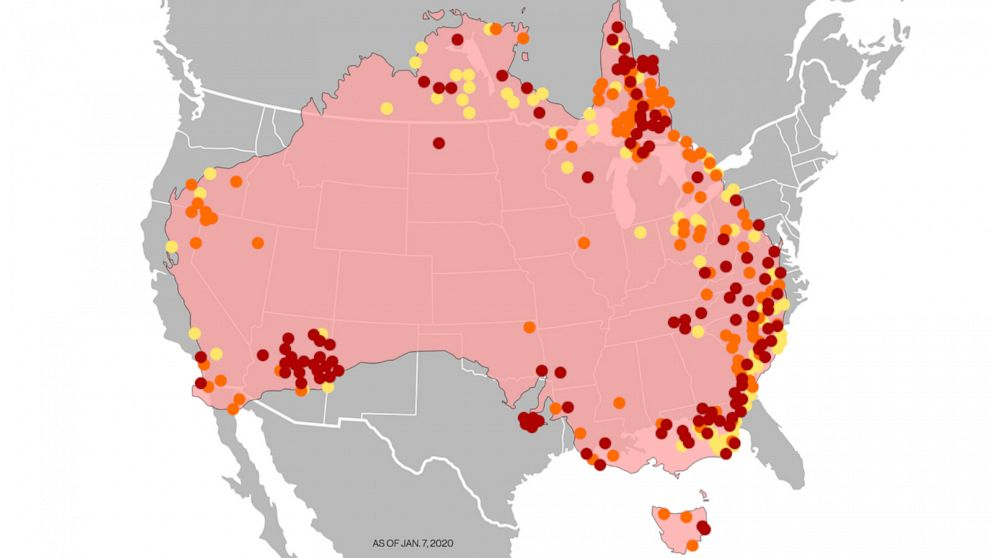
A much more effective way to mislead with maps, though, is just to make stuff up and not worry about the facts.  Yesterday, ABC News (the US one, not the Australian one) gave this map (insightful annotation from Buzzfeed)

They now have this one. It still make the fire areas look larger than they are, but in standard and hard-to-avoid ways.

A note at the end of the story now says

Editor’s note: The previous graphic in this story has been updated to reflect the hot spots around Australia.

Maybe it’s a matter of taste, but I don’t think that goes nearly far enough towards admitting what they did.

January 7, 2020

Something to do on your holiday?

Q: Did you see that going to the opera makes you live longer?

A: No, it just makes it feel longer

Q: ◔_◔

Q: This story, from the New York Times.

Now, there is evidence that simply being exposed to the arts may help people live longer.

Researchers in London who followed thousands of people 50 and older over a 14-year period discovered that those who went to a museum or attended a concert just once or twice a year were 14 percent less likely to die during that period than those who didn’t.

A: Actually, if you look at the research paper, they were just over half as likely to die during the study period: 47.5% vs 26.6%. And those who went at least monthly were only 60% less likely to die: 18.6% died.

Q: You don’t usually see the media understating research findings, do you?

A: No. And they’re not.  The 14% lower (and 31% lower for monthly or more frequent) are after attempting to adjust away the effects of other factors related to both longevity and arts/museums/etc

Q: You mean like the opera is expensive and so rich people are more likely to go?

A: Yes, although some museums are free, and so are some Shakespeare, etc,

Q: And if you can’t see or hear very well you’re less likely to go to opera or art galleries. Or if you can’t easily walk short distances or climb stairs?

A: Yes, that sort of thing.

Q: So the researchers didn’t just ignore all of that, like some people on Twitter were saying?

A: No. The BMJ has some standards.

Q: And so the 14% reduction left over after that is probably real?

A: No, it’s still probably exaggerated.  Adjusting for this sort of thing is hard.  For example, for wealth they used which fifth of the population you were in. The top fifth had half the death rate of the bottom fifth, and were five times as likely to Art more often than monthly.  For education, the top category was “has a degree”, and they were half as likely to die in the study period and 4.5 times more likely to Art frequently than people with no qualifications.

Q: “Has a degree” is a pretty wide category if you’re lumping them all together.

A: Exactly.  If you could divide these really strong predictors up more finely (and measure them better), you’d expect to be able to remove more bias.  You’d also worry about things they didn’t measure — maybe parts of the UK with more museums also have better medical care, for example.

Q: But it could be true?

A: Sure. I don’t think 14% mortality rate reduction from going a few times a year is remotely plausible, but some benefit seems quite reasonable.

Q: It might make you less lonely or less depressed, for example

A: Those are two of the variables they tried to adjust for, so if their adjustment was successful that’s not how it works.

Q: Isn’t that unfair? I mean, if it really works by making you less lonely, that still counts!

A: Yes, that’s one of the problems with statistical adjustment — it can be hard to decide whether something’s a confounding factor or part of the effect you’re looking for.

Q: But if people wanted to take their kids to the museum over the holidays, at least the evidence is positive?

A: Well, the average age of the people in this study was 65 at the start of the study, so perhaps grandkids.  Anyway, I think the StatsChat chocolate rule applies: if you’re going to a concert or visiting a museum primarily for the health effects, you’re doing it wrong.

 

Rugby Premiership Predictions for Round 9

Team Ratings for Round 9

The basic method is described on my Department home page.
Here are the team ratings prior to this week’s games, along with the ratings at the start of the season.

Current Rating Rating at Season Start Difference
Saracens 11.56 9.34 2.20
Exeter Chiefs 8.22 7.99 0.20
Sale Sharks 3.19 0.17 3.00
Northampton Saints 2.57 0.25 2.30
Gloucester 2.34 0.58 1.80
Bath 0.49 1.10 -0.60
Wasps -2.38 0.31 -2.70
Harlequins -2.78 -0.81 -2.00
Bristol -2.97 -2.77 -0.20
Leicester Tigers -3.32 -1.76 -1.60
Worcester Warriors -4.55 -2.69 -1.90
London Irish -6.14 -5.51 -0.60


Performance So Far

So far there have been 48 matches played, 36 of which were correctly predicted, a success rate of 75%.
Here are the predictions for last week’s games.

Game Date Score Prediction Correct
1 Sale Sharks vs. Harlequins Jan 04 48 – 10 7.60 TRUE
2 Gloucester vs. Bath Jan 05 29 – 15 5.30 TRUE
3 Leicester Tigers vs. Bristol Jan 05 31 – 18 3.00 TRUE
4 Saracens vs. Worcester Warriors Jan 05 62 – 5 16.90 TRUE
5 London Irish vs. Exeter Chiefs Jan 06 28 – 45 -8.90 TRUE
6 Wasps vs. Northampton Saints Jan 06 31 – 35 0.10 FALSE


Predictions for Round 9

Here are the predictions for Round 9. The prediction is my estimated expected points difference with a positive margin being a win to the home team, and a negative margin a win to the away team.

Game Date Winner Prediction
1 Bath vs. Leicester Tigers Jan 25 Bath 8.30
2 Bristol vs. Gloucester Jan 25 Gloucester -0.80
3 Exeter Chiefs vs. Sale Sharks Jan 25 Exeter Chiefs 9.50
4 Harlequins vs. Saracens Jan 25 Saracens -9.80
5 Northampton Saints vs. London Irish Jan 25 Northampton Saints 13.20
6 Worcester Warriors vs. Wasps Jan 25 Worcester Warriors 2.30


Pro14 Predictions for Round 8 Delayed Match

Team Ratings for Round 8 Delayed Match

The basic method is described on my Department home page.
Here are the team ratings prior to this week’s games, along with the ratings at the start of the season.

Current Rating Rating at Season Start Difference
Leinster 16.11 12.20 3.90
Munster 7.81 10.73 -2.90
Glasgow Warriors 6.69 9.66 -3.00
Ulster 5.09 1.89 3.20
Edinburgh 4.82 1.24 3.60
Scarlets 3.47 3.91 -0.40
Connacht 0.45 2.68 -2.20
Cardiff Blues 0.41 0.54 -0.10
Cheetahs -0.25 -3.38 3.10
Ospreys -3.65 2.80 -6.50
Treviso -4.04 -1.33 -2.70
Dragons -8.38 -9.31 0.90
Southern Kings -14.02 -14.70 0.70
Zebre -14.51 -16.93 2.40


Performance So Far

So far there have been 68 matches played, 52 of which were correctly predicted, a success rate of 76.5%.
Here are the predictions for last week’s games.

Game Date Score Prediction Correct
1 Cardiff Blues vs. Scarlets Jan 04 14 – 16 2.80 FALSE
2 Ulster vs. Munster Jan 04 38 – 17 0.80 TRUE
3 Treviso vs. Glasgow Warriors Jan 04 19 – 38 -3.00 TRUE
4 Dragons vs. Ospreys Jan 05 25 – 18 -1.20 FALSE
5 Zebre vs. Cheetahs Jan 05 41 – 13 -10.10 FALSE
6 Leinster vs. Connacht Jan 05 54 – 7 18.80 TRUE
7 Edinburgh vs. Southern Kings Jan 05 61 – 13 23.70 TRUE


Predictions for Round 8 Delayed Match

Here are the predictions for Round 8 Delayed Match. The prediction is my estimated expected points difference with a positive margin being a win to the home team, and a negative margin a win to the away team.

Game Date Winner Prediction
1 Southern Kings vs. Cheetahs Jan 26 Cheetahs -8.80


January 6, 2020

Briefly

  • Self-selected responses: this Twitter thread by Patrick Tomlinson is about the large number of negative reviews his book has on Goodreads. The book is still being edited. It won’t be available for months.
  • From the Washington Post: “Our privacy experiment found that automakers collect data through hundreds of sensors and an always-on Internet connection. Driving surveillance is becoming hard to avoid”.
  • Via the Herald: surprising no-one, a study by the US National Institute of Standards and Technology has found that US facial-recognition algorithms are better at recognising white people.  (Algorithms developed in east Asia seem to be ok at east Asian faces.)
  • Last year I mentioned investigations at newsroom.co.nz by Eloise Gibson and others of Sir Ray Avery. Sir Ray filed a Media Council complaint about a story that alleged he had threatened a researcher with legal action. The Media Council has found in favour of newsroom
  • From Radio NZ “Plans to collect data by putting sensors in thousands of state houses could result in the information being used to cut benefit payments or even evict tenants, a charity familiar with the project says.” The goal of the sensors is to find out what the actual heating/ventilation/damp problems are with state houses, information that would generalise to many other NZ houses. That’s a valuable goal. And Kāinga Ora say they don’t want to do anything else with the data, such as identify overcrowding or check who regularly has visitors staying the night,  or other potentially creepy possibilities.  But there doesn’t seem to be any clear mechanism to stop Kāinga Ora changing their minds.   Given the potential public benefits from suitable analyses of the data, it would be worth setting up a mechanism that people could see was trustworthy, rather than ending up with crap data when too many people opt out.
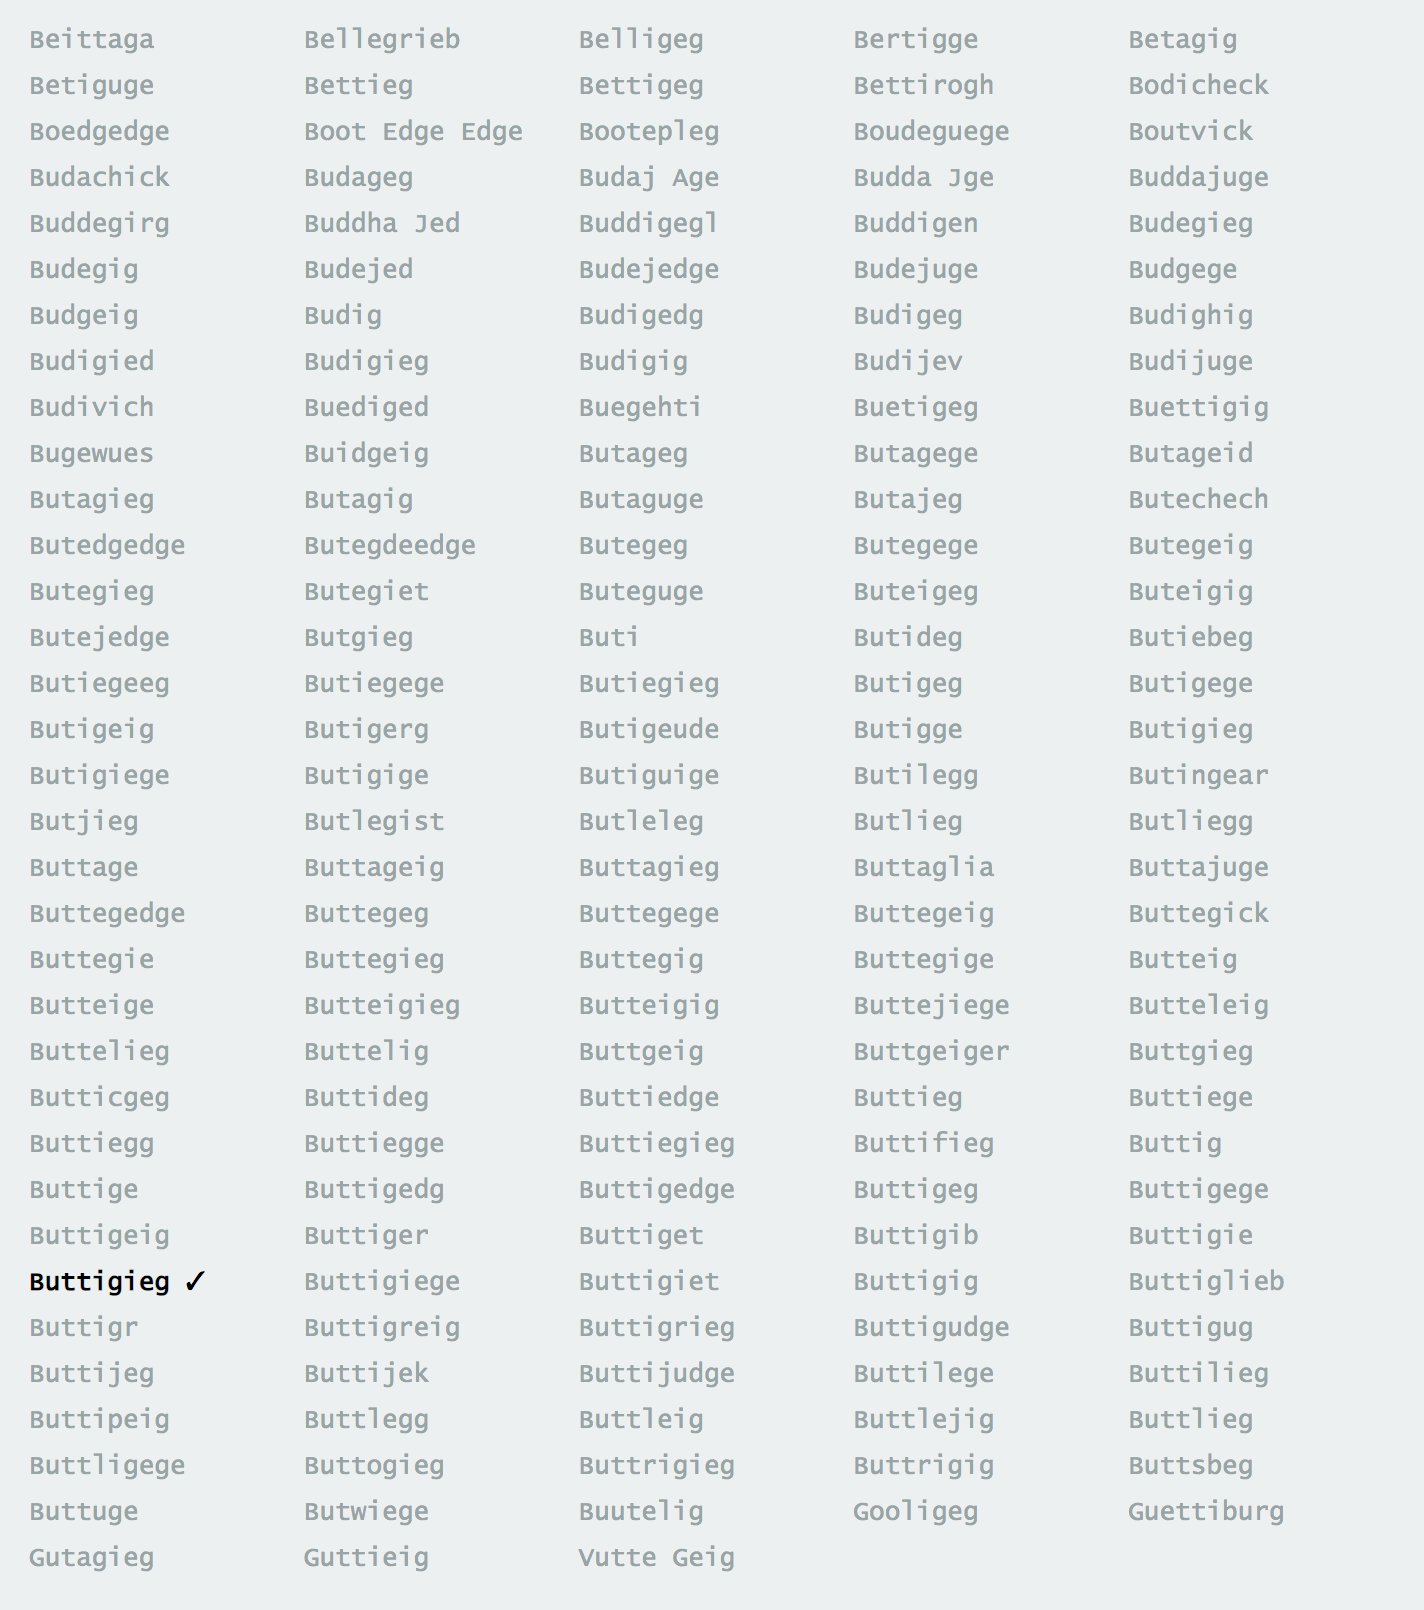
  • Interpreting survey responses: The New York Times had an interactive clicky thing asking people to identify celebrities from their photographs.  Pete Buttigieg’s name was spelt in 268 different ways (click to embiggen). Presumably these weren’t all serious, but that doesn’t actually make life any easier for the survey analyst.
January 5, 2020

Auckland in sepia

Auckland went impressively dark just before 2pm this afternoon: from Christina Hood on Twitter:

The reason is smoke from the Australian bushfires.

Fortunately for Auckland, the smoke (at the moment) is mostly at high altitude; you can tell because the lower picture is about as clear as the upper picture, just darker and more orange. Fine air pollution particles scatter light very effectively — in places with less humid summers than Auckland, light scattering is a good way to measure how much there is.

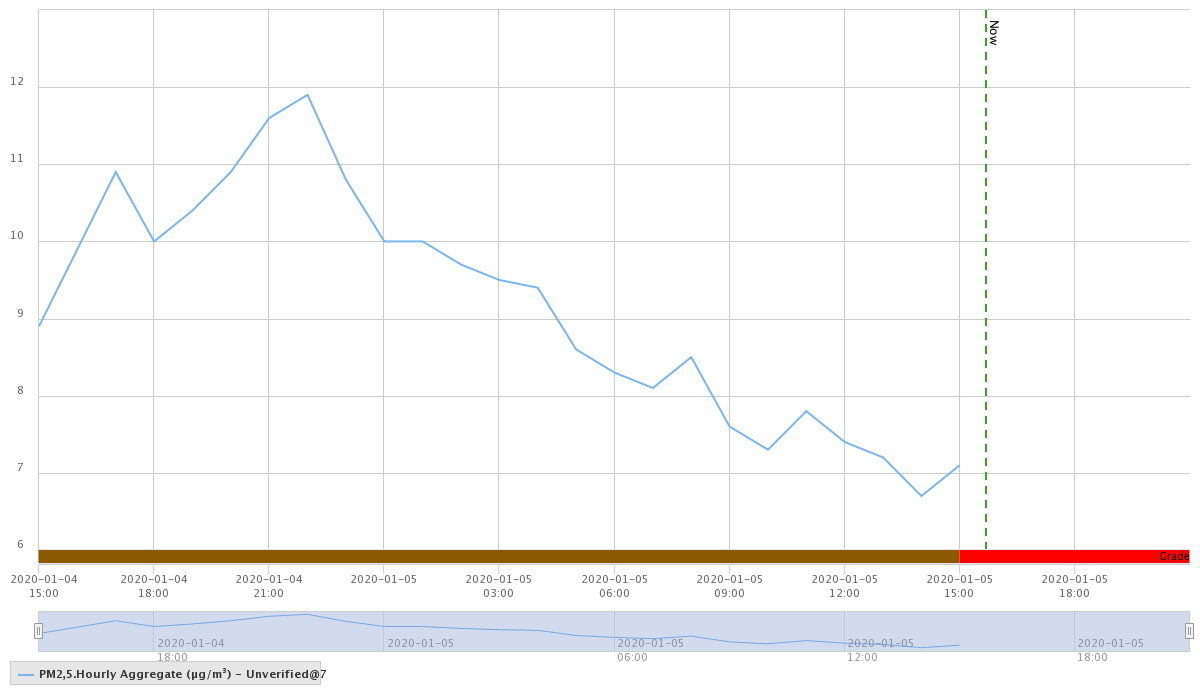
We can also look at the hourly measurements of PM2.5; fine-particle air pollution, or, basically, smoke.  Here are data from Penrose, in south central Auckland.

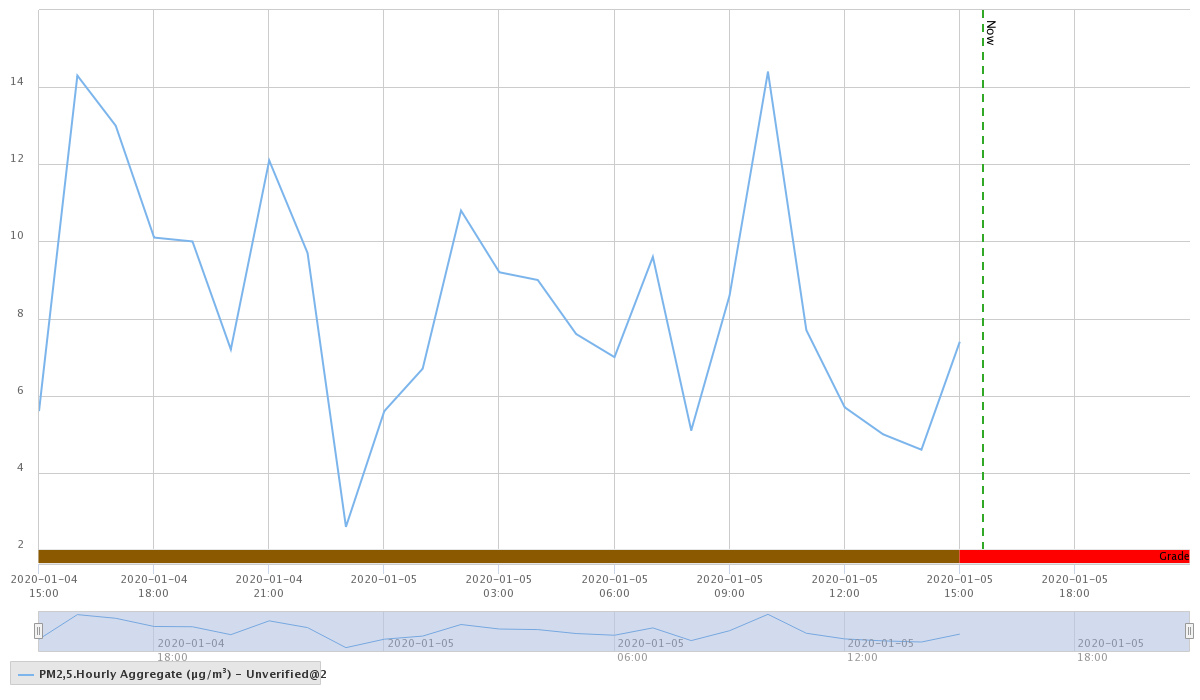
and Patumahoe, in far south Auckland

I chose these two because they were available and because there won’t be that much NZ-origin air pollution at those sites (on a Sunday afternoon).  At both locations there’s been an increase in fine particle air pollution, but not to any level of health concern.  It might be worth looking later in the evening, if you’re worried.  Given the placebo effect, if you don’t have specific health concerns you might be better off not checking.

(The Environment Auckland permalinks don’t work, so you need to go here and then to the AQ locations link, and then drill down.  You want “PM2.5 Hourly Aggregate unverified”)

This smoke used to be trees, 2000km away. We’ve seen particles from further than that — the Puyehue-Cordon Caulle volcano in Chile disrupted flights in 2011 — but the density of this smoke is much, much higher. WeatherWatch doesn’t know of a precedent.

December 31, 2019

Pro14 Predictions for Round 10

Team Ratings for Round 10

The basic method is described on my Department home page.
Here are the team ratings prior to this week’s games, along with the ratings at the start of the season.

Current Rating Rating at Season Start Difference
Leinster 15.18 12.20 3.00
Munster 8.55 10.73 -2.20
Glasgow Warriors 6.06 9.66 -3.60
Ulster 4.35 1.89 2.50
Edinburgh 3.98 1.24 2.70
Scarlets 3.04 3.91 -0.90
Connacht 1.38 2.68 -1.30
Cheetahs 0.90 -3.38 4.30
Cardiff Blues 0.84 0.54 0.30
Ospreys -2.91 2.80 -5.70
Treviso -3.41 -1.33 -2.10
Dragons -9.12 -9.31 0.20
Southern Kings -13.18 -14.70 1.50
Zebre -15.66 -16.93 1.30


Performance So Far

So far there have been 61 matches played, 48 of which were correctly predicted, a success rate of 78.7%.
Here are the predictions for last week’s games.

Game Date Score Prediction Correct
1 Cardiff Blues vs. Dragons Dec 27 16 – 12 16.00 TRUE
2 Scarlets vs. Ospreys Dec 27 44 – 0 8.80 TRUE
3 Ulster vs. Connacht Dec 28 35 – 3 6.20 TRUE
4 Treviso vs. Zebre Dec 28 36 – 25 18.60 TRUE
5 Edinburgh vs. Glasgow Warriors Dec 29 29 – 19 1.40 TRUE
6 Munster vs. Leinster Dec 29 6 – 13 -0.50 TRUE


Predictions for Round 10

Here are the predictions for Round 10. The prediction is my estimated expected points difference with a positive margin being a win to the home team, and a negative margin a win to the away team.

Game Date Winner Prediction
1 Cardiff Blues vs. Scarlets Jan 04 Cardiff Blues 2.80
2 Ulster vs. Munster Jan 04 Ulster 0.80
3 Treviso vs. Glasgow Warriors Jan 04 Glasgow Warriors -3.00
4 Dragons vs. Ospreys Jan 05 Ospreys -1.20
5 Zebre vs. Cheetahs Jan 05 Cheetahs -10.10
6 Leinster vs. Connacht Jan 05 Leinster 18.80
7 Edinburgh vs. Southern Kings Jan 05 Edinburgh 23.70


Rugby Premiership Predictions for Round 8

Team Ratings for Round 8

The basic method is described on my Department home page.
Here are the team ratings prior to this week’s games, along with the ratings at the start of the season.

Current Rating Rating at Season Start Difference
Saracens 9.72 9.34 0.40
Exeter Chiefs 7.74 7.99 -0.30
Northampton Saints 2.30 0.25 2.00
Gloucester 1.84 0.58 1.30
Sale Sharks 1.73 0.17 1.60
Bath 0.99 1.10 -0.10
Harlequins -1.32 -0.81 -0.50
Wasps -2.12 0.31 -2.40
Bristol -2.40 -2.77 0.40
Worcester Warriors -2.71 -2.69 -0.00
Leicester Tigers -3.89 -1.76 -2.10
London Irish -5.67 -5.51 -0.20


Performance So Far

So far there have been 42 matches played, 31 of which were correctly predicted, a success rate of 73.8%.
Here are the predictions for last week’s games.

Game Date Score Prediction Correct
1 Bristol vs. Wasps Dec 28 21 – 26 5.40 FALSE
2 Northampton Saints vs. Gloucester Dec 29 33 – 26 4.60 TRUE
3 Bath vs. Sale Sharks Dec 29 16 – 14 4.10 TRUE
4 Worcester Warriors vs. London Irish Dec 29 20 – 6 6.60 TRUE
5 Harlequins vs. Leicester Tigers Dec 29 30 – 30 8.00 FALSE
6 Exeter Chiefs vs. Saracens Dec 30 14 – 7 1.90 TRUE


Predictions for Round 8

Here are the predictions for Round 8. The prediction is my estimated expected points difference with a positive margin being a win to the home team, and a negative margin a win to the away team.

Game Date Winner Prediction
1 Sale Sharks vs. Harlequins Jan 04 Sale Sharks 7.60
2 Gloucester vs. Bath Jan 05 Gloucester 5.30
3 Leicester Tigers vs. Bristol Jan 05 Leicester Tigers 3.00
4 Saracens vs. Worcester Warriors Jan 05 Saracens 16.90
5 London Irish vs. Exeter Chiefs Jan 06 Exeter Chiefs -8.90
6 Wasps vs. Northampton Saints Jan 06 Wasps 0.10


December 27, 2019

Pro14 Predictions for Round 9

My apologies for the late publication of these predictions. I was too distracted by Christmas.

Team Ratings for Round 9

The basic method is described on my Department home page.
Here are the team ratings prior to this week’s games, along with the ratings at the start of the season.

Current Rating Rating at Season Start Difference
Leinster 14.59 12.20 2.40
Munster 9.14 10.73 -1.60
Glasgow Warriors 6.84 9.66 -2.80
Ulster 3.47 1.89 1.60
Edinburgh 3.20 1.24 2.00
Connacht 2.26 2.68 -0.40
Scarlets 1.95 3.91 -2.00
Cardiff Blues 1.35 0.54 0.80
Cheetahs 0.90 -3.38 4.30
Ospreys -1.82 2.80 -4.60
Treviso -2.73 -1.33 -1.40
Dragons -9.63 -9.31 -0.30
Southern Kings -13.18 -14.70 1.50
Zebre -16.34 -16.93 0.60


Performance So Far

So far there have been 55 matches played, 42 of which were correctly predicted, a success rate of 76.4%.
Here are the predictions for last week’s games.

Game Date Score Prediction Correct
1 Leinster vs. Ulster Dec 21 54 – 42 17.00 TRUE
2 Zebre vs. Treviso Dec 22 8 – 13 -9.40 TRUE
3 Connacht vs. Munster Dec 22 14 – 19 -1.20 TRUE
4 Dragons vs. Scarlets Dec 22 22 – 20 -7.40 FALSE
5 Glasgow Warriors vs. Edinburgh Dec 22 20 – 16 9.70 TRUE
6 Ospreys vs. Cardiff Blues Dec 22 16 – 19 2.90 FALSE


Predictions for Round 9

Here are the predictions for Round 9. The prediction is my estimated expected points difference with a positive margin being a win to the home team, and a negative margin a win to the away team.

Game Date Winner Prediction
1 Cardiff Blues vs. Dragons Dec 27 Cardiff Blues 16.00
2 Scarlets vs. Ospreys Dec 27 Scarlets 8.80
3 Ulster vs. Connacht Dec 28 Ulster 6.20
4 Treviso vs. Zebre Dec 28 Treviso 18.60
5 Edinburgh vs. Glasgow Warriors Dec 29 Edinburgh 1.40
6 Munster vs. Leinster Dec 29 Leinster -0.50


Rugby Premiership Predictions for Round 7

Team Ratings for Round 7

The basic method is described on my Department home page.
Here are the team ratings prior to this week’s games, along with the ratings at the start of the season.

Current Rating Rating at Season Start Difference
Saracens 10.04 9.34 0.70
Exeter Chiefs 7.42 7.99 -0.60
Northampton Saints 2.11 0.25 1.90
Gloucester 2.03 0.58 1.40
Sale Sharks 1.57 0.17 1.40
Bath 1.16 1.10 0.10
Harlequins -0.85 -0.81 -0.00
Bristol -1.82 -2.77 1.00
Wasps -2.71 0.31 -3.00
Worcester Warriors -3.15 -2.69 -0.50
Leicester Tigers -4.36 -1.76 -2.60
London Irish -5.23 -5.51 0.30


Performance So Far

So far there have been 36 matches played, 27 of which were correctly predicted, a success rate of 75%.
Here are the predictions for last week’s games.

Game Date Score Prediction Correct
1 Gloucester vs. Worcester Warriors Dec 21 36 – 3 7.10 TRUE
2 Leicester Tigers vs. Exeter Chiefs Dec 22 22 – 31 -7.00 TRUE
3 Sale Sharks vs. Northampton Saints Dec 22 22 – 10 2.90 TRUE
4 Saracens vs. Bristol Dec 22 47 – 13 14.30 TRUE
5 Wasps vs. Harlequins Dec 22 22 – 28 3.80 FALSE
6 London Irish vs. Bath Dec 23 10 – 38 0.90 FALSE


Predictions for Round 7

Here are the predictions for Round 7. The prediction is my estimated expected points difference with a positive margin being a win to the home team, and a negative margin a win to the away team.

Game Date Winner Prediction
1 Bristol vs. Wasps Dec 28 Bristol 5.40
2 Northampton Saints vs. Gloucester Dec 29 Northampton Saints 4.60
3 Bath vs. Sale Sharks Dec 29 Bath 4.10
4 Worcester Warriors vs. London Irish Dec 29 Worcester Warriors 6.60
5 Harlequins vs. Leicester Tigers Dec 29 Harlequins 8.00
6 Exeter Chiefs vs. Saracens Dec 30 Exeter Chiefs 1.90