April 19, 2020

Counting rare things is hard

As promised, a second ‘prevalence’ post, this time on test accuracy.

In any medical diagnostic or screening setting, what we know is the number of positive and negative tests. What we want to know is the number of people with and without the condition.  It’s easy to slip into talking about these as if they’re the same, but they aren’t.

For the coronavirus, we have two basic sorts of test.  There  are ‘PCR’ tests, which is what everyone had been using.  And there are ‘antibody’ tests, which are new.

The PCR tests measure the presence of the virus. They transcribe the genetic material of the virus from RNA to DNA, and then use DNA copying enzymes to amplify it billions of times; the ‘polymerase chain reaction’.  After amplification, there’s enough of the genetic sequence that fluorescent dyes attached to it or to the input materials can produce measurable light.

The copying looks for a unique, fairly short, genetic sequence that’s present in the new coronavirus, but not in the SARS or MERS viruses, or the four coronaviruses that cause common colds (in fact, usually more than one genetic sequence, plus a ‘positive control’ that makes sure the process is working, plus a ‘negative control’ that doesn’t have any RNA). Because of the fidelity of DNA replication, the technical ‘assay error’ of the PCR test is so close to zero as makes no difference: a few copies of the virus are enough for a positive result, and it’s almost impossible to get a positive result without any virus.

Unfortunately, the real-world diagnostic error isn’t quite that good.  The false positive rate is still basically zero, given good lab practice; you can’t get a positive test without viral RNA from some source.  The false negative rate can be appreciable, because the test doesn’t ask if there’s virus somewhere in your system; it asks if there’s virus on the swab.   In early COViD-19 disease, the best way to grab some virus is to stick a swab almost far enough up your nose to do brain surgery, and twist it around a bit.   More often than not, this will pick up some virus. But if you get tested too early, there might not be enough virus, and if you get tested too late the infection might have relocated to your chest.

So how good is the PCR test in practice? Well, we don’t know for sure.  It’s the best test we have, so there isn’t a ‘true answer’ to compare it to.  However, a study that looked at tests using multiple ways of extracting a sample, suggest the sensitivity of the test is 65%: if you have early-stage COViD-19, you’ve got about a two in three chance of testing positive.  There’s a lot of uncertainty around the exact value; fortunately the exact value doesn’t matter all that much.

Antibody tests are new for coronavirus, but are familiar in other settings.  Older HIV tests looked for antibodies to the virus, as do the initial tests for Hepatitis C (which are followed up by PCR).  These antibody tests rely on the highly selective binding of antibodies to the antigens they detect. Because antibody tests detect your body’s reaction to the virus, a positive reaction takes time — at least a few days, maybe a week — and it stays around at least a short time after you recover.  Antibody tests are amazingly accurate, but not quite as amazingly accurate as PCR. Everyone has exactly the same identifying genetic tags in their virus, but everyone makes slightly different antibodies to the virus.  An antibody test is trying to pick up everyone’s diverse antibodies to the new coronavirus, but not pick up anyone’s antibodies to the nearly infinite diversity of other antigens in the world, including other coronaviruses. At any point in time, there’s a tradeoff: a test that picks up coronavirus antibodies more sensitively will also pick up more other things, and one that avoids reacting to other things will miss more coronavirus infections.

As I said above, the exact value of the false negative positive rate doesn’t matter that much when you’re estimating population prevalence.  The false positive negative rate matters a lot.  Suppose you have an antibody test with a false positive rate of 5%. For every 100 truly-negative people you test, there will be an average of 5 positive tests; for every 1000 people, 50 positive tests.  In New Zealand, we’re sure the population prevalence is less than 1%, and I would expect it to be less than 0.1%.  If you gave this test to 1000 people, there would be an average 50 positive results and maybe one or two true positives. It is very much an average, so if you got 53 positive tests you would have no idea whether that was five true positives or three or none at all.  Even if the false positive rate were as low as 0.5%, you’d expect more false positives than true positives in New Zealand. And it’s worse than that: the error rates aren’t known accurately yet, so even if the manufacturer’s estimate was 0.5% false positives, it could easily be 1% or maybe even 2%.

There’s a new study out of Stanford (preprint) that tested 3330 people and found 50 positives. A helpful StatsChat reader posted a link to a review of this study. What I’m writing here agrees pretty closely with that review.

A rate of 50 positives out of 3330 healthy people is high: if true, it would imply COViD-19 was much more common and therefore much less serious than we thought. The researchers used a test that had given 2 positive results out of 401 samples known to be negative (because they were taken before the pandemic started).  If the false positive rate was exactly 2/401 , you’d get 0.005×3330 false positives on average, or only about 17, leaving 33 true positives.  But 2/401 is an estimate, with uncertainty.  If we assume the known samples were otherwise perfectly representative, what we can be confident of with 2 positives out of 401 is only that the false positive rate is no greater than 1.5%. But 1.5% of 3330 is 50, so a false positive rate of 1.5% is already enough to explain the results! We don’t even have to worry if, say, the researchers chose this test from a range of competitors because it had the best supporting evidence and thereby introduced a bit of bias.

On top of that, the 3330 people were tested because they responded to Facebook ads.  Because infection is rare, you don’t need to assume much self-selection of respondents to bias the prevalence estimate upwards.  You might be surprised to see me say this, because yesterday I thought voluntary supermarket surveys were a pretty good idea. They are, but they will still have bias, which could be upwards or downwards. We wouldn’t use the results of a test in a few supermarkets to overturn the other evidence about disease severity; we want to use them to start finding undetected cases — any undetected cases.

Counting rare things is hard, and false positives are overwhelmingly more important than false negatives, which is currently a problem for antibody tests.  PCR tests based on a swab are unpleasant for the person being tested and risky for the person holding the swab, but they are the best we have now. There might be other ways to use antibody tests, for example if true infections cluster more strongly within household than false positives, or if two tests with different characteristics can be combined, or if more accurate ones become available. But it’s not easy. 


April 18, 2020

Prevalence estimation: is it out there?

One of the known unknowns about the NZ coronavirus epidemic is the number of cases we have not detected.  There will have been a mixture of people who didn’t get any symptoms, people who are going to show symptoms but haven’t yet, people who got moderately sick but didn’t get tested, and people whose deaths were attributed to some pre-existing condition without testing.

For the decision to loosen restrictions, we care mostly about people who are currently infected, who aren’t (currently) sick enough to get testing, and who aren’t known contacts of previous cases.  What can we say about this number — the ‘community prevalence’ of undetected coronavirus infection in New Zealand?

One upper bound is that we’re currently seeing about 1% positive tests in people who either have symptoms or are close contacts of cases.  The prevalence in close contacts of cases must be higher than in the general population — this is an infectious disease — so we can be fairly confident the population prevalence is less than 1%.

Are there any other constraints? Well, infection isn’t a static process.  If you have coronavirus in 1% of Kiwis, they will pass it on to other people and they themselves will recover.  At the moment, under level 4, the epidemic modellers at Te Pūnaha Matatini are estimating a reproduction number of about 0.5, so 50,000 cases will infect half that many new people.  Now, if we’re missing nearly all the cases, the modelling might not be all that accurate, but there would have to be tens of thousands of new infections.  And at least a few percent of those new cases will be sick enough to need medical treatment.  We would quickly notice that many people showing up to hospitals with (by assumption) no known contacts.  It isn’t happening. Personally, I have a hard time believing in a prevalence as high as 0.2%, which would mean we’re missing over 80% of cases.

The other constraint would come from testing of healthy people, which is why the government has started doing that.  If you wanted an accurate estimate for the population as a whole, you’d need some sort of random population sample, but in the short time it makes more sense to take a sensibly-constructed random sample of supermarkets and then test their customers and employees — if there’s major undetected spread, supermarkets are one of the likely places for  it to happen, and they’re also a convenient place to find people who are already leaving home, so you can test them without barging into their bubbles.  So, we aren’t getting a true population prevalence estimate, but we are getting an estimate of something a bit like it but probably higher.

How many do we need to test? It depends on how sure you want to be. If we sample 10,000 people and 4 are positive, we could estimate* prevalence at 4/10,000, or 0.04%.  But what if no-one is positive? The best estimate clearly isn’t zero!

The question gets more extreme with smaller sample sizes: if we sample 350 people (as was done at the Queenstown PakNSave) and find no cases, what can we say about the prevalence?  The classical answer, a valuable trick for hallway statistical consulting, is that if the true rate is 3/N or higher, the chance of seeing no cases in N tests is less than 5%. So, if we see no cases in 350 people, we can be pretty sure the prevalence was less than 3/350, or about 1%.  Since we were already pretty sure the prevalence was way less than 1%, that hasn’t got us much further forward.  We’re eventually going to want thousands, or tens of thousands, of tests. The Queenstown testing was only a start.

After that introduction, you’ll understand my reaction when Radio NZ’s Checkpoint said there had been a positive test in the Queenstown supermarket, with only two-thirds of the samples run through the lab.   Fortunately, it turns out there had been a misunderstanding and there has not yet been a positive result from this community testing.  If the true rate is 0.1% there’s a good chance we’ll see a community-positive test soon; if it’s 0.01%, not for a while.  And if we’re really at the level of eliminating community transmission, even longer.


Update: Statistical uncertainty in the other direction also matters.  If the true prevalence is p and you test N people, you get pN positive tests on average, but your chance of getting no positive tests is e-pN. So, if you test 350 people and the true prevalence is 0.1%, your chance of getting no positive tests is about 70% and your chance of at least one positive is 30%.  And a positive test in Queenstown would have been surprising, but shouldn’t have been a complete shock. Two positive tests should be a shock.

* There’s another complication, for another post, in that the test isn’t perfect. The estimate would actually be more like 0.05% or 0.06%.

April 5, 2020

Axes of evil

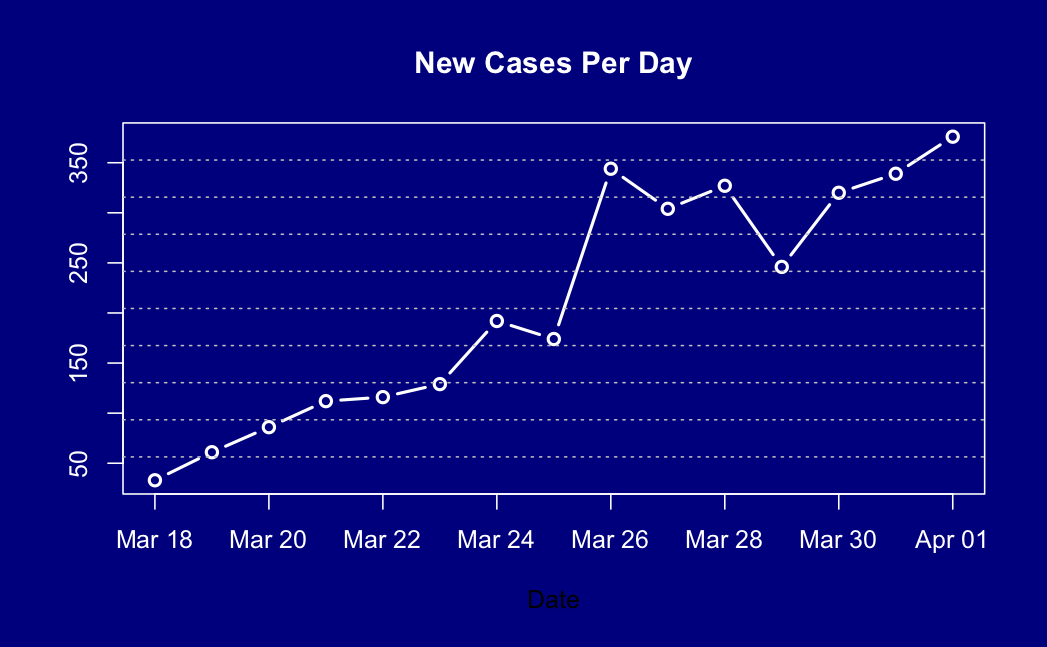
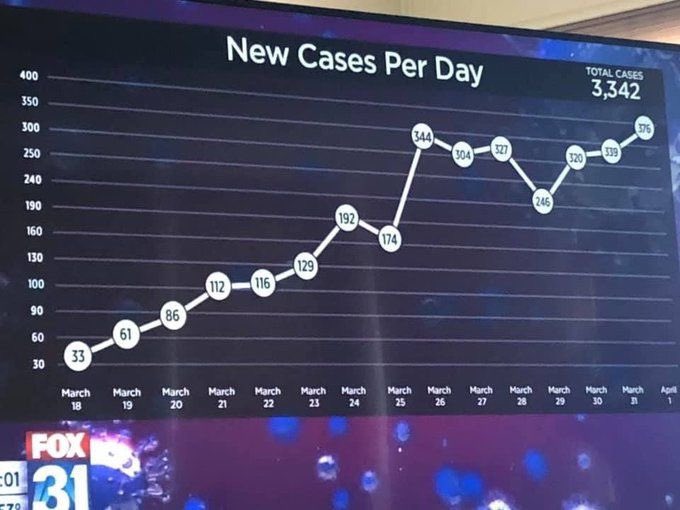
A graph from Fox31 news, via various people on Twitter.

Look at the y-axis: the divisions vary from 10 to 50!

The natural suspicion is that the y-axis has been fiddled to make the graph look more linear — to ‘flatten the curve’.

So, I tried drawing it right, to show the actual trend. It looks

…. pretty much the same, actually.

So, on the one hand, no real distortion of the data.  But on the other hand, why bother?

March 28, 2020

Briefly

  • An opinion poll on the NZ lockdown, at the Spinoff.  This is notable for being a self-selected online sample, but not a bogus poll — it’s properly reweighted to population totals for age, gender, and region, and this week being on Facebook or Instagram is probably more representative than answering your phone.  Interestingly, 9% of people say they won’t obey the rules, but only  7% say the rules shouldn’t be enforced.
  • XKCD has a … unique  … way to describe the 2m distancing zone.
  • Tableau have graphs of population mobility across the US, purporting to measure the success of social distancing. But they didn’t take interstate highways (where people tend to move rather a lot) into account
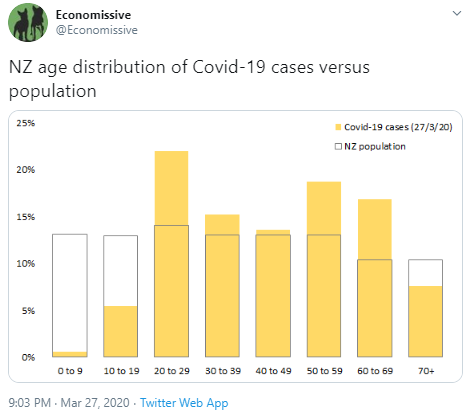
  • A good graph of case age distributions in NZ — answering the basic statistical question ‘compared to what’?
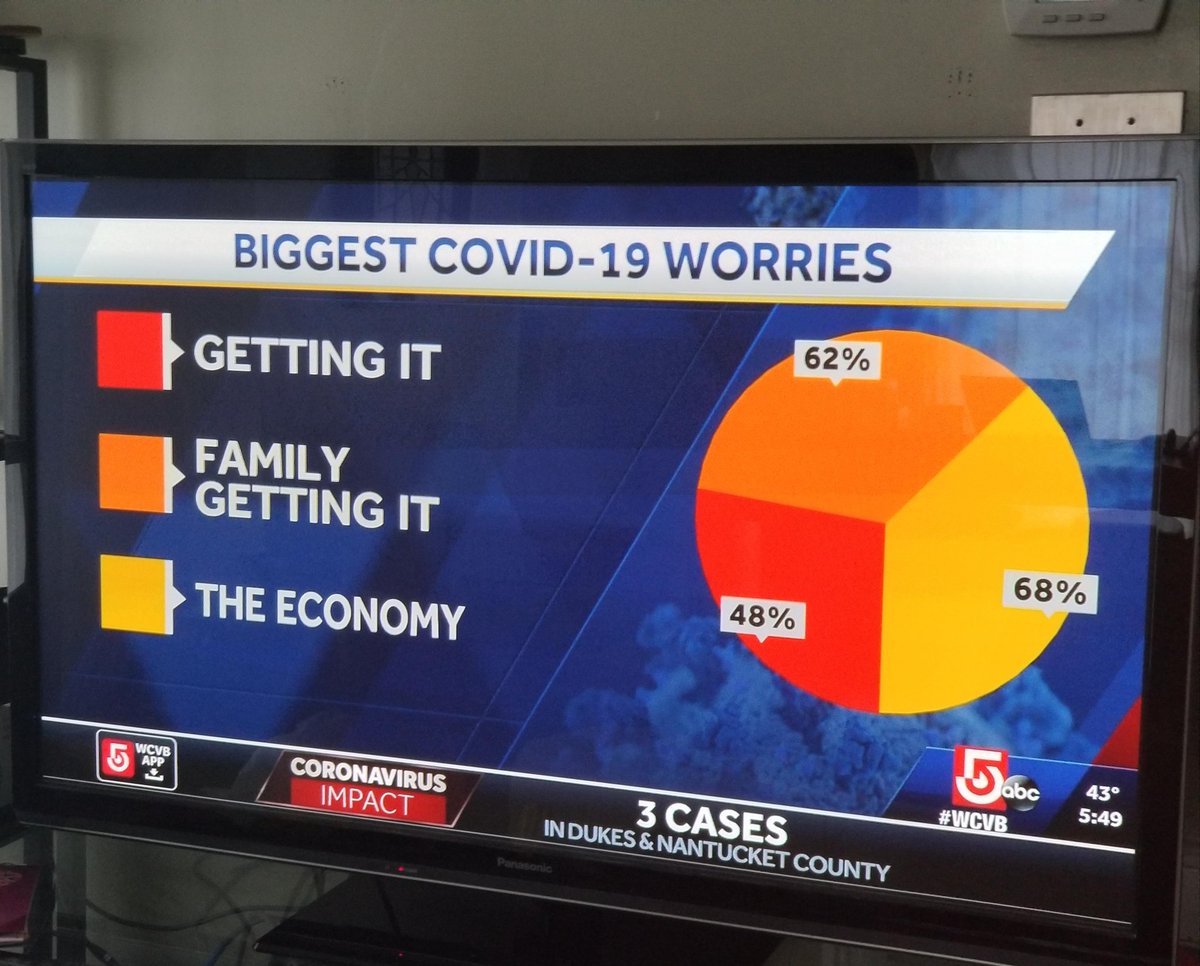
  • A terrible pie chart from ABC news in the US, via several people: these aren’t things that add up
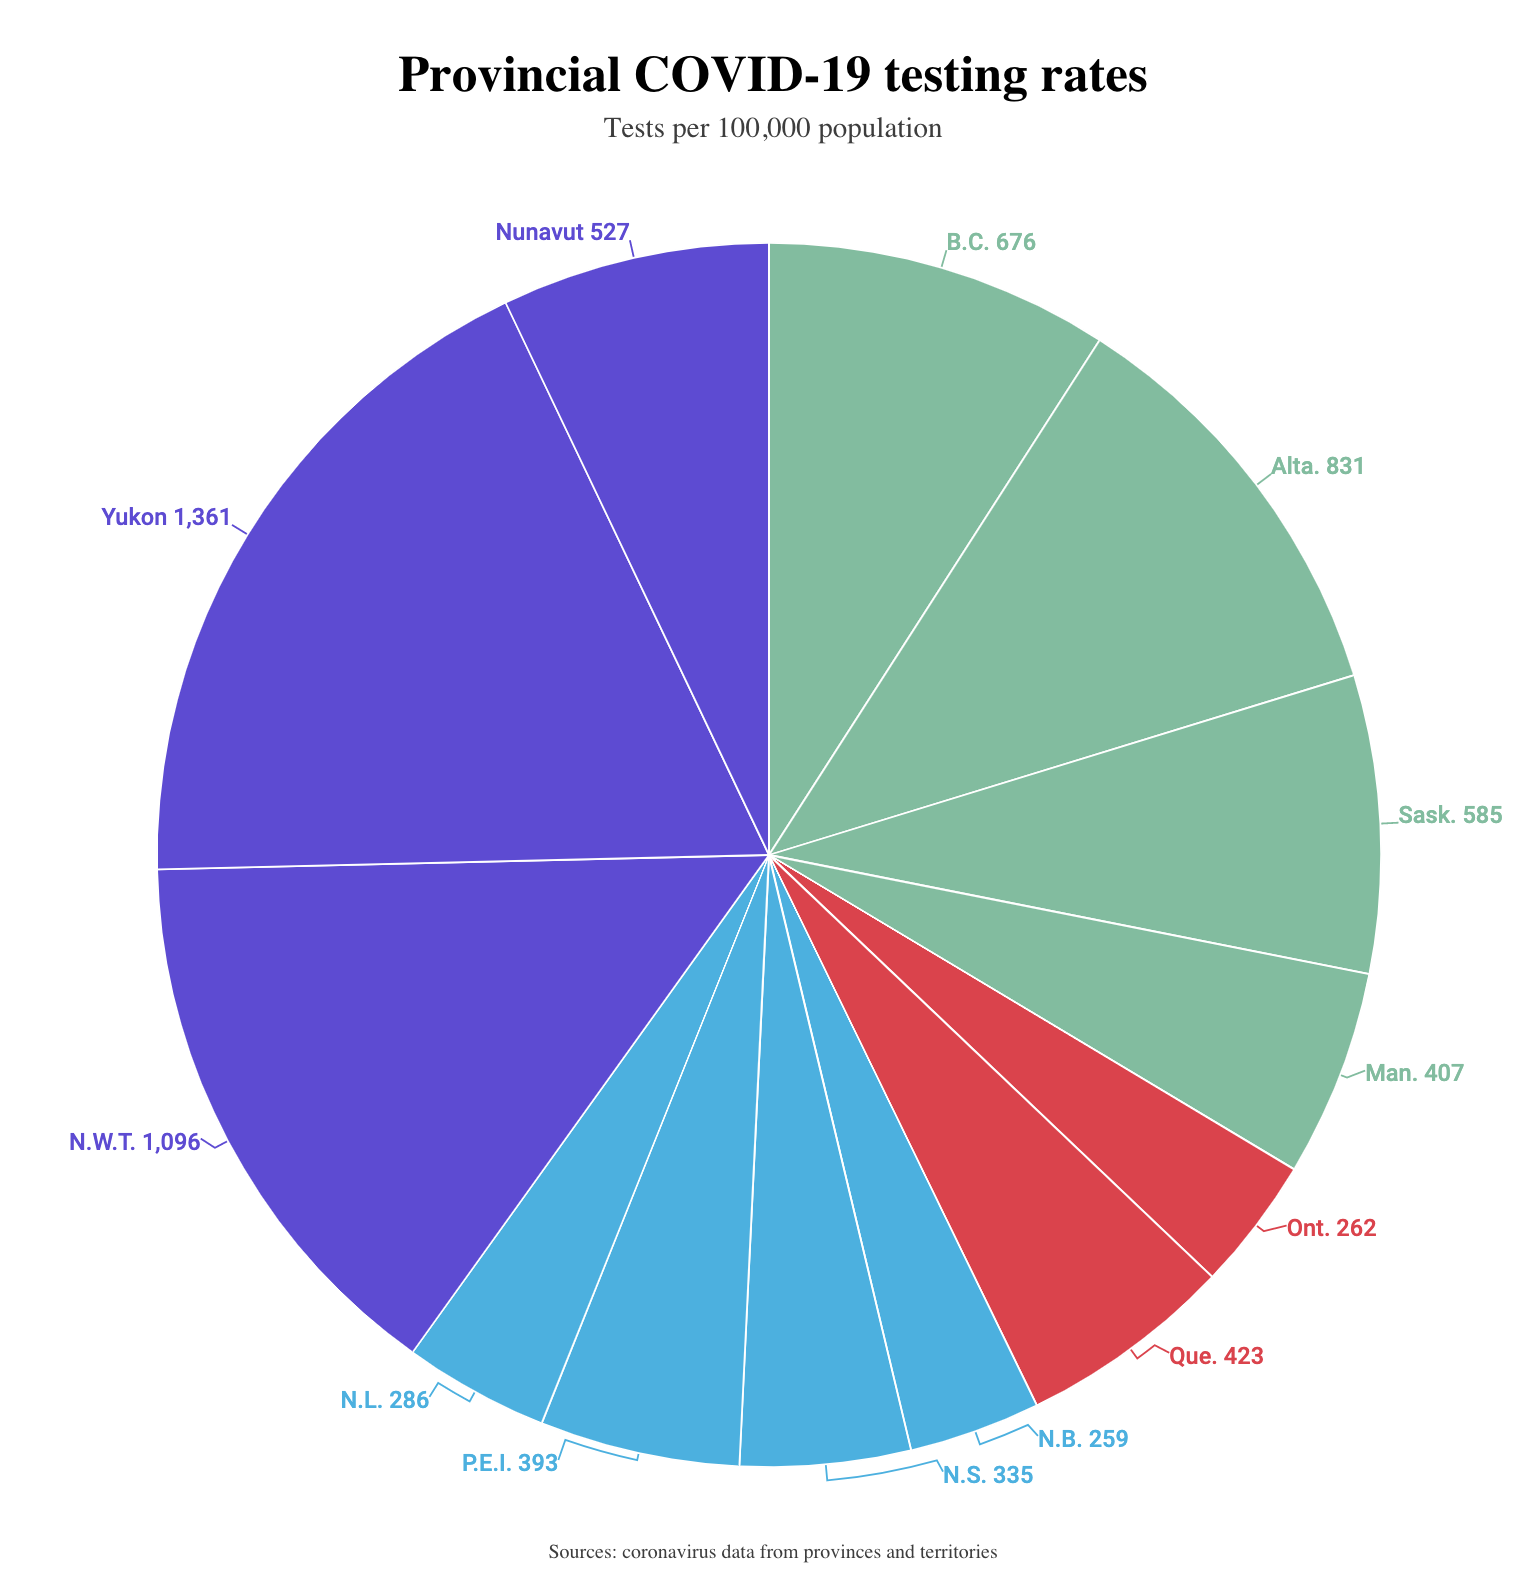
  • And from Macleans.ca: rates per 100k population don’t add up either — Yukon, Nunavut, and the  Northwest Territories have not actually done a third of Canada’s testing
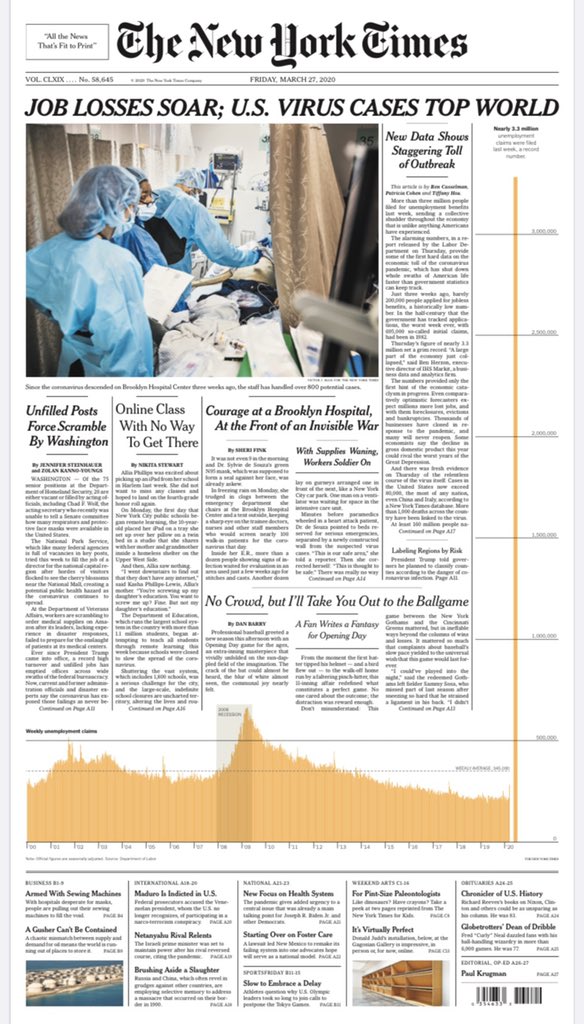
  • On the other hand, this graph of unemployment claims from the New York Times is spectacular.  Depressing, but spectacular.
March 26, 2020

Chloroquine and COVID

“Doctors can now prescribe chloroquine for that off-label purpose of dealing with the symptoms of coronavirus,” Pence said. “The president’s very optimistic.”

Since clinical trial design and analysis is a thing I do, I thought I’d write about the chloroquine problem.

Chloroquine and the related hydroxychloroquine are anti-malarial drugs, which are also used in some autoimmune diseases.  They are inexpensive and their risks are well understood, with chloroquine having been used to prevent and treat malaria for many years.  They’re safe-ish at the standard doses*: they have unpleasant side-effects, but not nearly as unpleasant as malaria.  Also, they’ve been found to have anti-viral effects in lab studies, including against SARS, so they might just work in treatment or prevention of COVID-19.

You might wonder how a malaria drug would work on a virus.  I will quote a pharmaceutical chemist, Derek Lowe

So if you see someone confidently explaining just how chloroquine exerts whatever antiviral activity it may have, feel free to go read something else. No one’s sure yet.

Now, you wouldn’t expect the President of the United States to be up on candidate antiviral treatments for SARS, so why was he very optimistic?

A small study in France gave hydroxychloroquine to 26 people with COVID-19, and didn’t give it to 16 others — this wasn’t randomised, it’s just how things turned out.  Of the 26 people getting hydroxychloroquine, 14 were virus-free after 6 days. The study reported this as 70%, because 6 of the other 12 people had dropped out for various reasons, including one death.   Normally, you’d report it as 14/26, or 54% — either that or do some more complicated analyses.   A subset of at least 6 of the people getting hydroxychloroquine also got the antibiotic azithromycin (they don’t say how many — could be anything from 6 to 12). Of these people, 6 became virus-free, which they reported as 100%.

This study is encouraging, but the fact that it’s not randomised and is very small and didn’t report results for nearly a quarter of the treated people mean that it’s no more than that. It’s a good reason to do a randomised trial that’s large enough and well-designed enough to convince people which ever way it turns out. That’s happening: the WHO is running a trial of four potential treatments, which is designed to be simple enough that even an over-worked and under-resourced hospital system can take part.  The trial design also allows for changes if new treatments or new information about existing treatments emerges.

As I’ve mentioned before, there are lots of small studies being done around the world.  In particular, the Journal of Zhejiang University just published a small randomised trial of hydroxychloroquine.  I learned about it from Dr Mel Thompson, who was quoted in a Forbes post about the trial, by Tara Haelle.  In this study 15 people were given hydroxychloroquine and 15 got the standard care.  This trial is too small to say much, 13 of the treated group and 14 of the control group were virus-free after 7 days, and the results for other measurements were also not too different.   The trial results are consistent with the drug having no effect. But they’re also consistent with the drug having a big effect.

At the moment, some people are getting various treatments and others aren’t, mostly in a haphazard way.  If it were done with randomisation and reliable basic data collection, we might save a lot of lives. At worst, we’d know what didn’t work.


* Yes, one person died and one was hospitalised in the US from taking chloroquine, but they don’t seem to have known anything about the usual doses, which matters when the fish-tank version of the product comes in large packets.

March 23, 2020

Another reason why we don’t know the COVID-19 mortality rate

“The” mortality rate isn’t a thing.

We know that older people are more likely to die than younger people — age is routinely and accurately recorded by hospitals, so the comparisons are relatively straightforward.  There’s less evidence for other general health risk factors, but there’s definitely some, and less healthy people are more likely to die.  Also, if there’s any point to our concern about running out of intensive care beds, then ICU treatment makes a different to the death rate.  It’s quite likely that there are other environmental factors, such as the types of bacteria that are around to cause secondary infections.

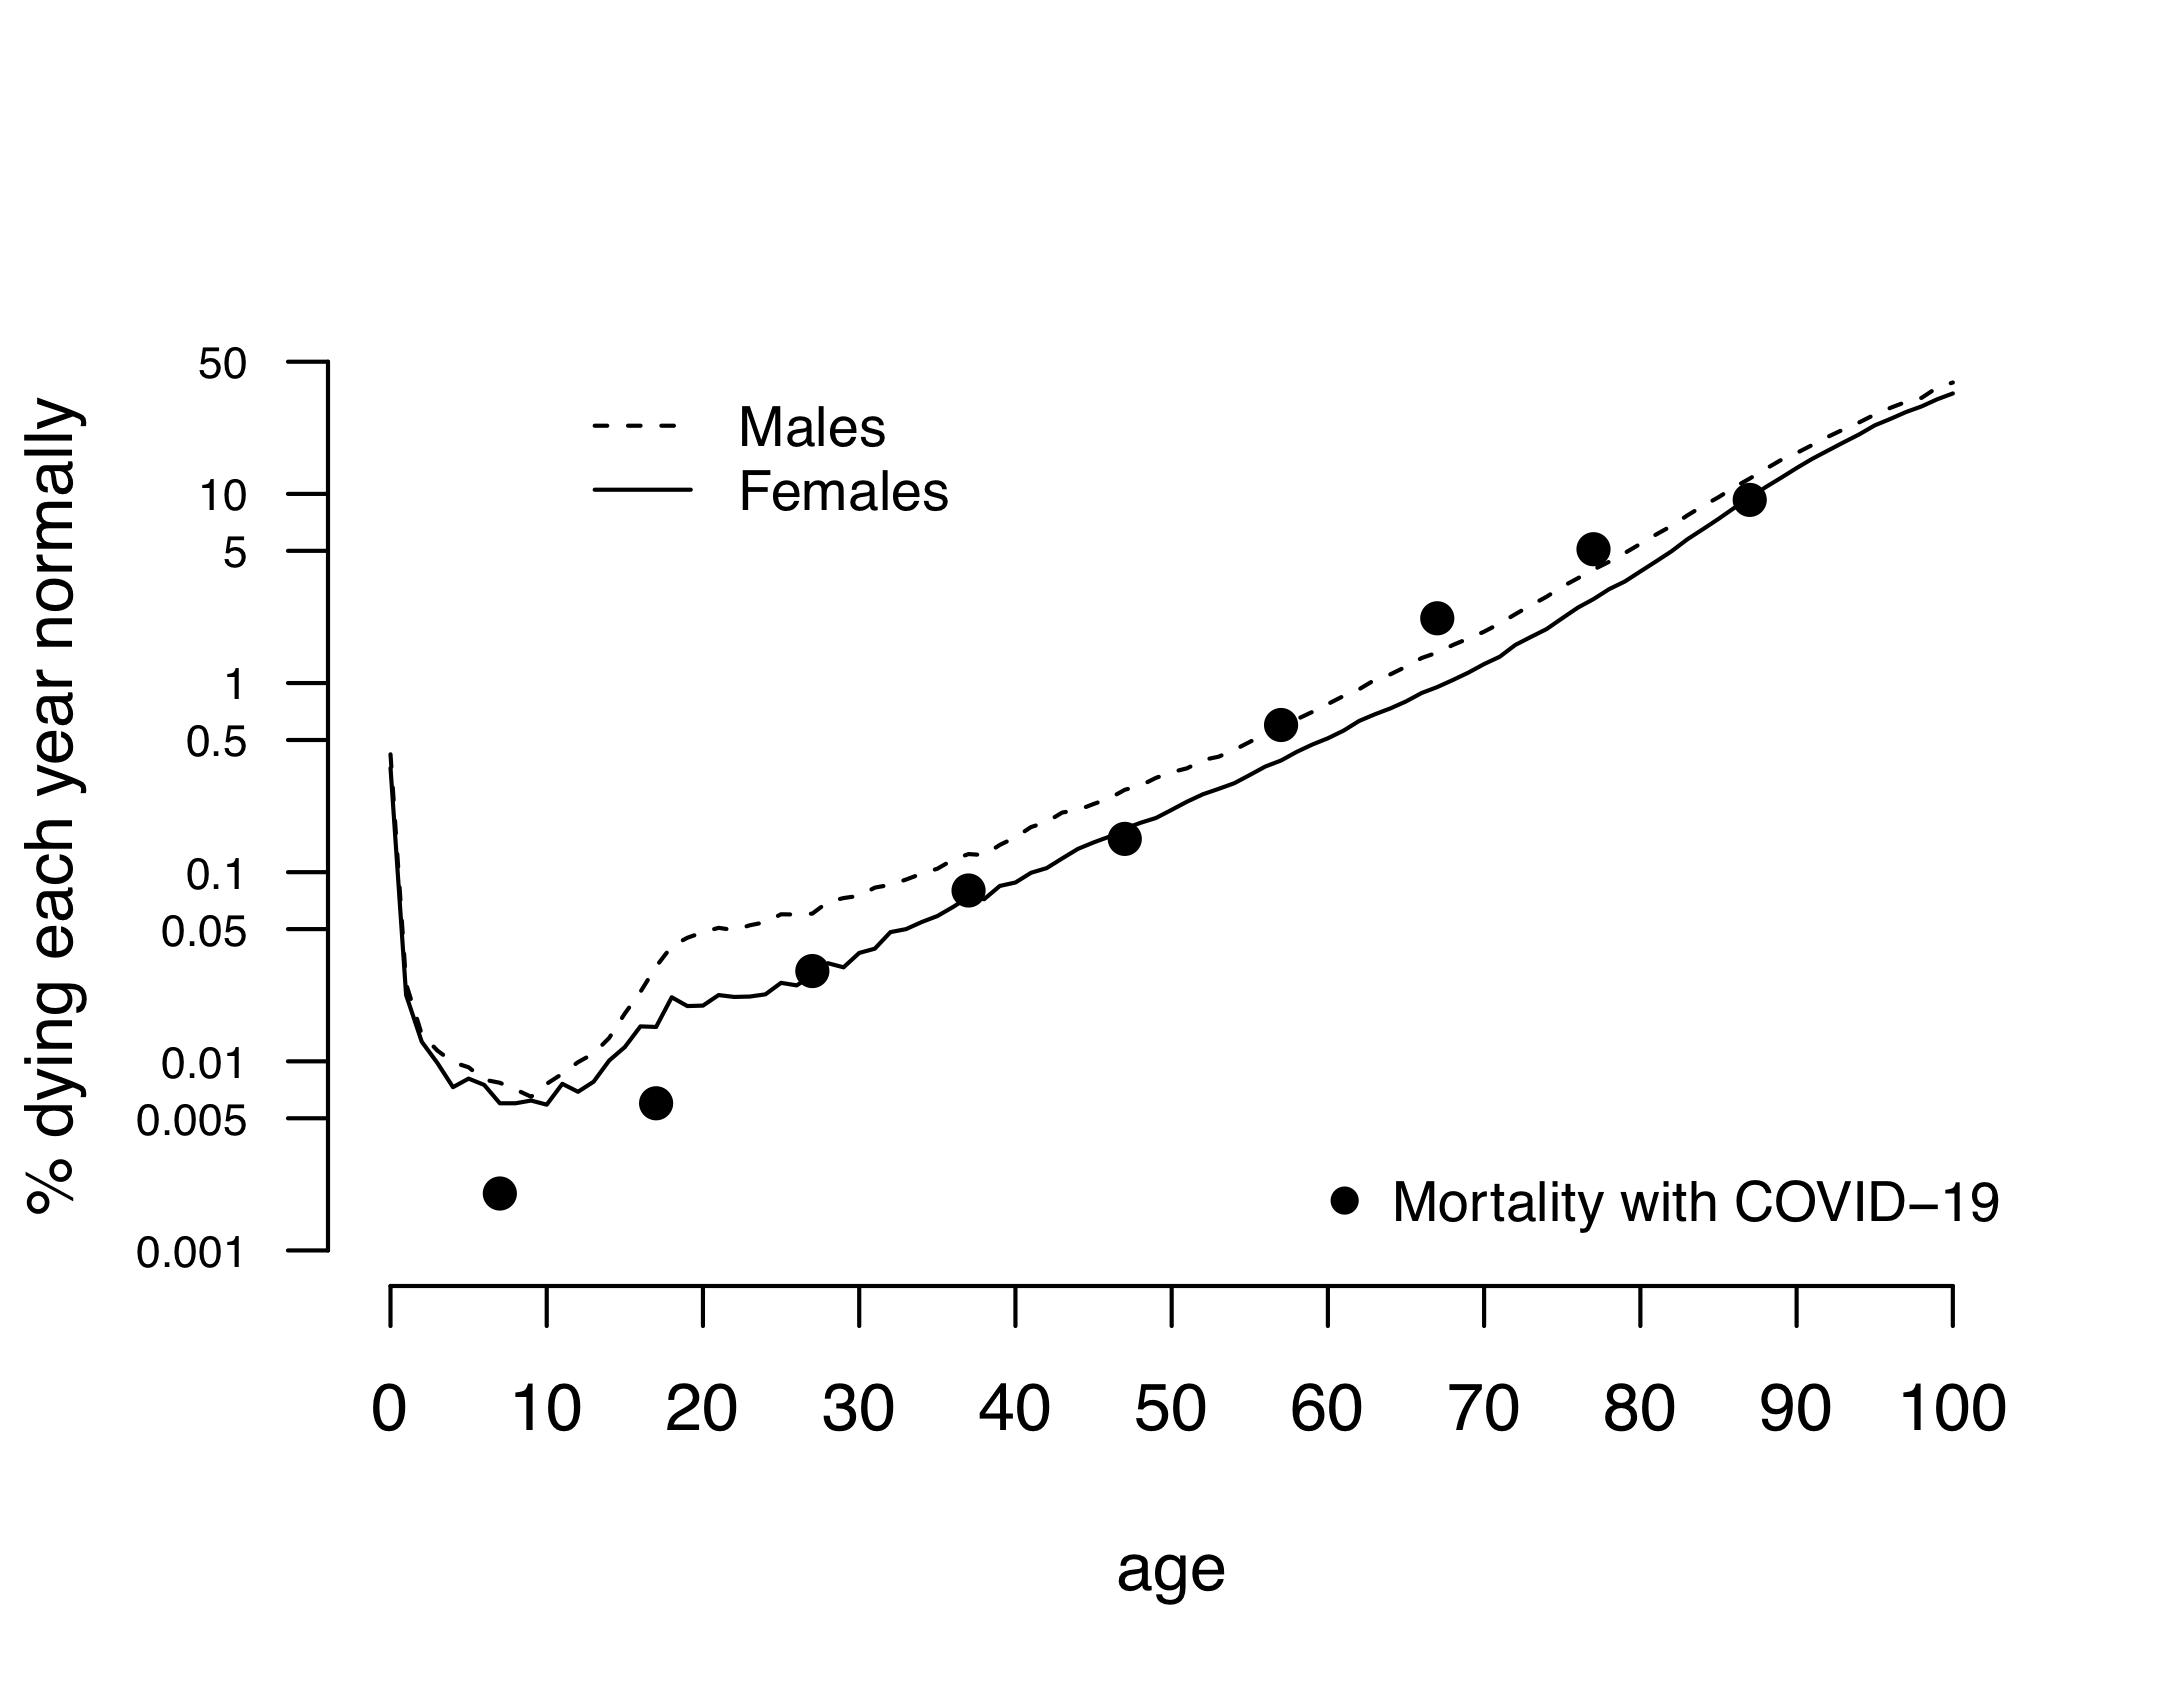
All this is hard to be sure about, but at least we should be interested in age-specific rates, either on their own or combined into an age-standardised rate.  David Spiegelhalter (statistician, risk communication expert from Cambridge) used estimates from the UK epidemic modellers(PDF) at Imperial College to draw this graph. The estimates attempt to model both the detection/testing rate and the fact that some people in the data set were still sick. There’s still uncertainty as to the absolute level, but the estimates are reasonable

Ordinary all-cause mortality increases with age, and apart from the infant spike and the young-and-stupid bump in the usual death rates it matches the COVID-19 pattern remarkably well.

Different people will draw different messages from this (the data never speak for themselves), but I think it supports the revised message  around severity for younger adults.  If you’re young and healthy, you are very likely to survive COVID-19 — but part of that is because you’re hard to kill, not because it’s a minor illness.  Think of it as like a car crash that would kill a 75 year old but might just give a 25 year old a week in hospital and a few months’ painful recovery.

March 19, 2020

NRL Predictions for Round 2

Obviously this week is different in a number of ways. Empty stadiums, Warriors with a depleted squad. My predictions take no account of these changed circumstances.

Team Ratings for Round 2

The basic method is described on my Department home page.
Here are the team ratings prior to this week’s games, along with the ratings at the start of the season.

Current Rating Rating at Season Start Difference
Storm 13.03 12.73 0.30
Roosters 11.43 12.25 -0.80
Raiders 6.77 7.06 -0.30
Rabbitohs 2.94 2.85 0.10
Eels 2.67 2.80 -0.10
Sharks 1.71 1.81 -0.10
Sea Eagles 0.75 1.05 -0.30
Panthers 0.68 -0.13 0.80
Wests Tigers 0.20 -0.18 0.40
Bulldogs -2.39 -2.52 0.10
Cowboys -4.54 -3.95 -0.60
Broncos -4.94 -5.53 0.60
Knights -5.11 -5.92 0.80
Warriors -5.98 -5.17 -0.80
Dragons -6.52 -6.14 -0.40
Titans -12.70 -12.99 0.30


Performance So Far

So far there have been 8 matches played, 6 of which were correctly predicted, a success rate of 75%.
Here are the predictions for last week’s games.

Game Date Score Prediction Correct
1 Eels vs. Bulldogs Mar 12 8 – 2 7.30 TRUE
2 Raiders vs. Titans Mar 13 24 – 6 22.00 TRUE
3 Cowboys vs. Broncos Mar 13 21 – 28 3.60 FALSE
4 Knights vs. Warriors Mar 14 20 – 0 3.70 TRUE
5 Rabbitohs vs. Sharks Mar 14 22 – 18 3.00 TRUE
6 Panthers vs. Roosters Mar 14 20 – 14 -10.40 FALSE
7 Sea Eagles vs. Storm Mar 15 4 – 18 -9.70 TRUE
8 Dragons vs. Wests Tigers Mar 15 14 – 24 -4.00 TRUE


Predictions for Round 2

Here are the predictions for Round 2. The prediction is my estimated expected points difference with a positive margin being a win to the home team, and a negative margin a win to the away team.

Game Date Winner Prediction
1 Bulldogs vs. Cowboys Mar 19 Bulldogs 4.20
2 Dragons vs. Panthers Mar 20 Panthers -5.20
3 Broncos vs. Rabbitohs Mar 20 Rabbitohs -5.90
4 Warriors vs. Raiders Mar 21 Raiders -8.20
5 Roosters vs. Sea Eagles Mar 21 Roosters 12.70
6 Sharks vs. Storm Mar 21 Storm -9.30
7 Wests Tigers vs. Knights Mar 22 Wests Tigers 7.30
8 Titans vs. Eels Mar 22 Eels -13.40


“No evidence” vs “doesn’t work”

One of the problems with reporting of clinical trials is failure to distinguish “we showed this treatment doesn’t work” from “we didn’t show this treatment worked”.  In both cases, what people mean is that their uncertainty interval included “no benefit”, but it matters what other possibilities are in the interval.

A clinical trial in COVID-19 has just reported in the New England Journal of Medicine, testing the HIV drug lopinavir, which showed some lab evidence of being able to block the replication of SARS-CoV-2, the COVID-19 virus.  The great advantage of lopinavir is that we’re already manufacturing and distributing lots of it, in many countries, so if it worked, it could fairly easily be made available.

The trial reported

In hospitalized adult patients with severe Covid-19, no benefit was observed with lopinavir–ritonavir treatment beyond standard care.

It’s natural to interpret this as “it doesn’t work”, but it’s not really accurate.  The mortality results are given as

Mortality at 28 days was similar in the lopinavir–ritonavir group and the standard-care group (19.2% vs. 25.0%; difference, −5.8 percentage points; 95% CI, −17.3 to 5.7)

Now, that’s very weak evidence of a benefit, but the interval goes from a massive 17 percentage point reduction to 6 percentage point increase in mortality.  The data are slightly closer to a 10 percentage point reduction in mortality than to no effect. The trial is just too small to tell us the answer.  Personally, I don’t expect lopinavir to work, based on what I’ve read from medical chemists who don’t think the lab motivation was compelling, but either way this trial isn’t decisive.

In ordinary times a undersized trial like this shouldn’t be done, and while it might still be done, it wouldn’t end up in the world’s highest-impact medical journal.  In the current circumstances there will be a whole bunch of undersized trials being run, and providing really valuable information, and we want them all to be published and combined.  And not overinterpreted.

March 17, 2020

Briefly

  • Statisticians from the Human Rights Data Analysis Group write in the UK literary magazine Granta, about the uncertainty in COVID-19 mortality rates.  They’re saying similar things to what I and other statisticians have said, but should be reaching a new audience, including some influential people.
  • The infectious disease modelling group at Imperial College, London, have put out a new paper on suppressing infections (PDF, Financial Times, Guardian).  The take-home message is the same as the animation in this Spinoff piece by Siouxsie Wiles and Toby Morris: distancing measures can potentially suppress the epidemic, but if they work we need to keep doing them until a vaccine arrives. “The major challenge of suppression is that this type of intensive intervention package – or something equivalently effective at reducing transmission – will need to be maintained until a vaccine becomes available (potentially 18 months or more) – given that we predict that transmission will quickly rebound if interventions are relaxed”
  • Alberto Cairo links to an interesting essay (previously a lecture,PDF) on ‘the ethics of counting’: “But wait!” the kid thinks to himself. “A grown-up lumped these different things together so I guess I’m supposed to consider them as the same.” Notice that when kids learn to count, they’re not just learning number words and symbols; they’re learning how adults see things
  • Via flowingdata.com, a map of all the trees and forests in the United States
  • From Kieran Healy, a map of all the rivers and streams in the US
  • Along similar lines, from the Herald a couple of years ago, a map of NZ with place names coloured by whether they are in te reo.
March 14, 2020

Stimulating the economy

You can divide most of the coronavirus stories in the world media into two groups: accurate and helpful information on the one hand, and harmful misinformation on the other.  The NZ media have been doing pretty well in keeping to the first sort.

There are a few stories in the middle, like this one at Newshub, that seem to be intended mostly as entertainment

Some people are making sure they will enjoy their time in quarantine, should it be enforced upon us. 

New Zealand sex retailer Adult Toy Megastore has reported a surge of sales in lubricant, vibrators and batteries in the wake of the pandemic. 

They don’t sell toilet paper or bottled water, so they’re bound to have somewhat different top products from the supermarkets, and there’s nothing really surprising here. In contrast to the previous StatsChat appearances of this store, they’re sticking to topics where they actually know the data, rather than overinterpreting bogus surveys.

There’s also a pointer to some medical advice, which is where the whole thing gets a bit more dodgy. The only reason I’m keeping this to “a bit” is that I don’t think you’re intended to really take the story seriously:

“Masturbation can produce the right environment for a strengthened immune system,” she told Men’s Health. 

Her views are backed up by a study from the Department of Medical Psychology at the University Clinic of Essen which looked at the effects of orgasm through masturbation on the white blood cell count.

A group of 11 volunteers were asked to participate in a study and the results confirmed that sexual arousal and orgasm increased the number of white blood cells.

The study is actually linked. It’s a paywalled paper, but here’s the abstract.

If you’ve got an experimental study of an intervention that might prevent viral infection, you’d want to know who was being studied, the sample size, and how representative they were.  You’d want to know what effects were being measured and over what period.  And you’d want to know to what extent the intervention was also present in the control group. In a serious clinical trial that sort of information would be in the abstract.

The abstract doesn’t actually say anything about the diversity of study population, apart from “11 volunteers”. The paper says “healthy young males” and notes they were all exclusively heterosexual and had an average age of 37.7 (so ‘young’ is being interpreted relatively broadly).  The participants were asked to refrain from sexual activity for 24 hours before the experiment, but that’s all.

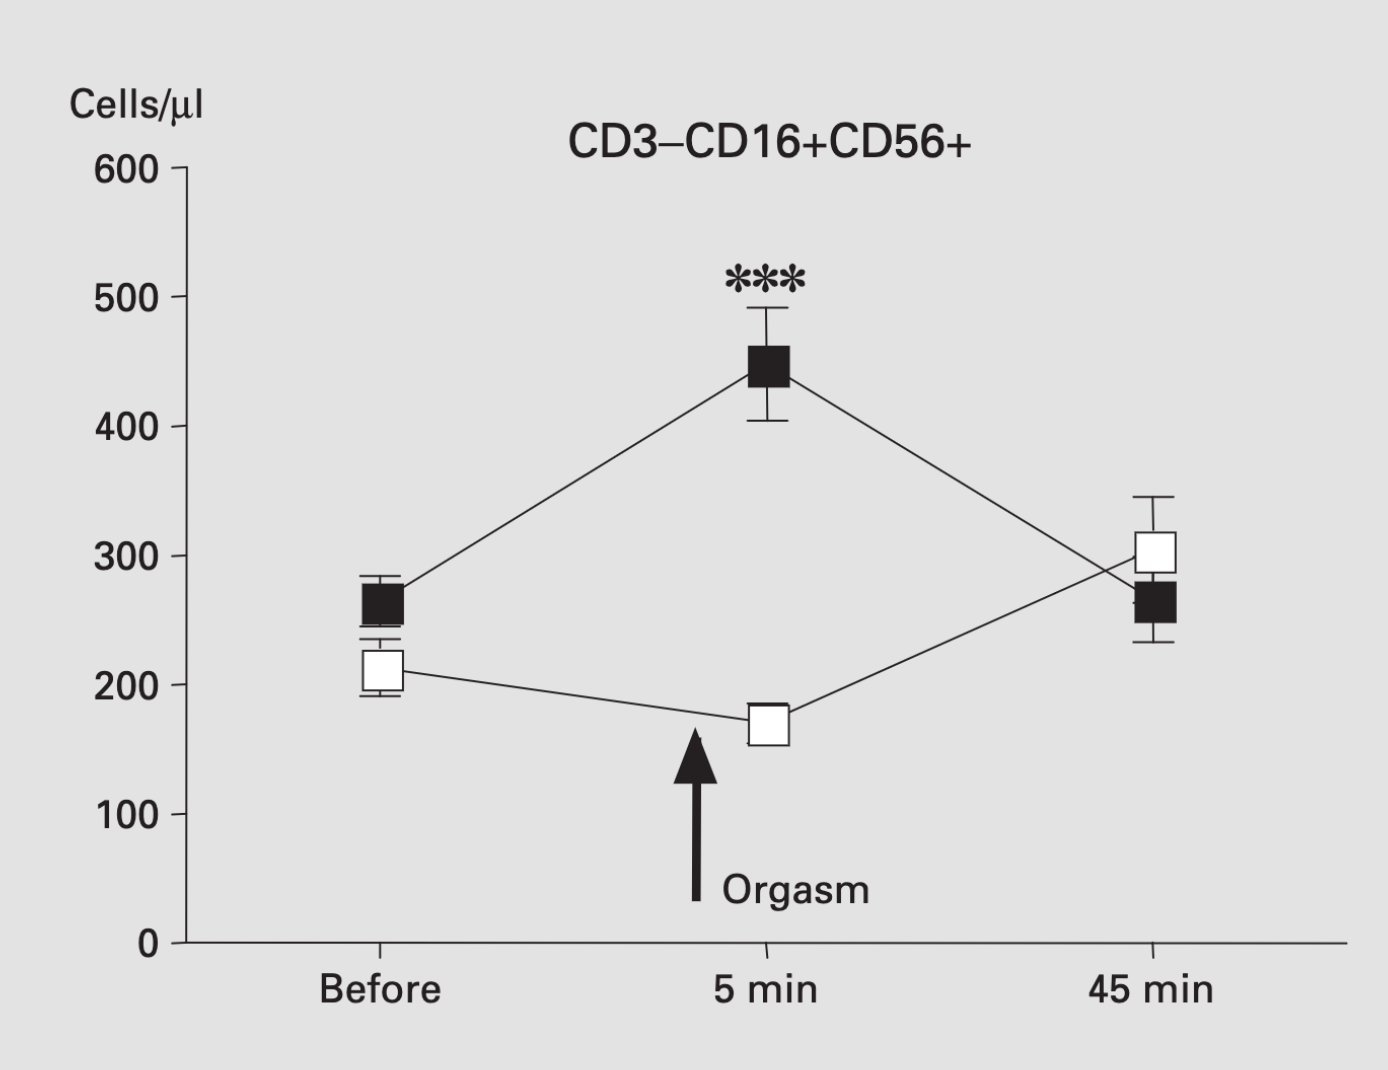
The abstract does talk, importantly, about “transient” changes in hormones. It’s less open about the changes in white blood cells.  The headline effect is that there were more “NK cells“, which are theoretically relevant to viral infection, 5 minutes after orgasm.  It’s not clear whether the increase is big enough to be helpful. However, the increase had gone away again by the second measurement at 45 minutes (so it’s probably safe). Here’s the graph

It’s not clear that we should believe these results, given the well-known problems with reporting and analysis bias in small experiment — and even without any issues in the scientific publication process, you can be pretty confident Newshub wouldn’t have mentioned unconfirmed results from a tiny experiment published in 2004 if it didn’t confirm what they wanted to say.  But suppose we do believe the results.  What does it tell us about COVID-19? Is this, as they say, news you can use? You might consider your times of greatest exposure to other people’s viruses and look for a half-hour window where greater immunity would be relevant. On the other hand, that might cause more problems than it solves. Alternatively, you could just wash your hands (actually, you should wash them either way).

Leaving aside the questions of appropriate time and place, I think the StatsChat advice on red wine and chocolate also applies here. If you’re thinking of a half-hour increase in one type of white blood cells as a convincing argument in favour of orgasms, you may be doing them wrong.