February 12, 2014

Evils of Axis

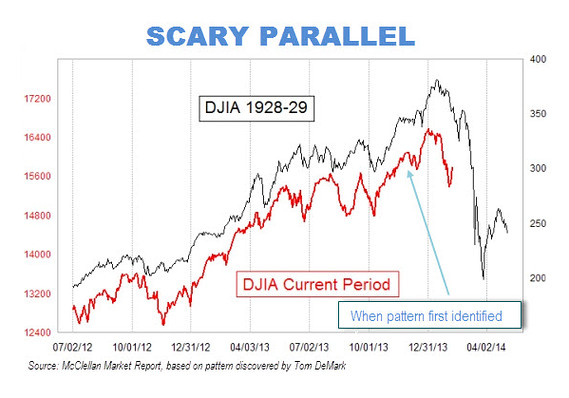
A scary chart showing how the stock market looks just like it did before the big crash that started the Great Depression:

MW-BU310_scary__20140210132547_MG


Or perhaps not


That is, if you scale the charts so that the vertical scale corresponds to the same proportional rise and fall for both of them, and extend them up to the day of publication rather than stopping in mid-January, the similarity vanishes.

How do we know which scaling is right?  It depends on whether you think the detailed day-to-day shape of stock market fluctuations is much more important than the size of the fluctuations. And on whether you think it’s still January.

Briefly

  • An interview with Sir David Cox, probably the most famous living statistician “I know the term ‘the profession of statistics’ is widely used but I am not that keen on it. I would like to think of myself as a scientist, who happens largely to specialise in the use of statistics. “
  • A page with interactive graphics to demonstrate Simpson’s Paradox. I’m not sure the interactivity helps, but more important, they show dividing people into groups can change the direction of association, but don’t talk about how you decide which of the two is correct.
  • “Disinformation Visualization”
  • A long-term personalised-medicine study. “We hope to develop a whole series of stories about how actionable opportunities have changed the wellness of individuals, or have made them aware of how they can avoid disease,” We can be confident they will find stories. It’s less clear they will be true.
February 8, 2014

Evils of axis

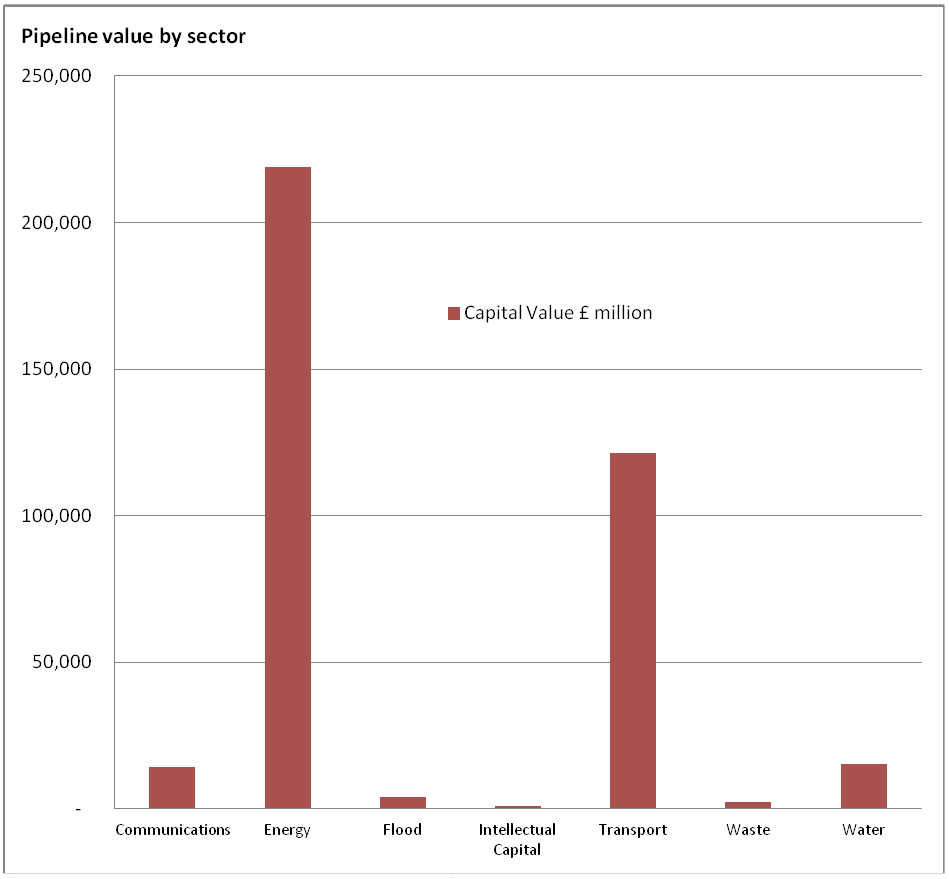
The UK Statistics Authority, among its other responsibilities, has the job of writing polite but firm letters to government bodies that misuse statistics. Yesterday’s installment is about the UK National Infrastructure Plan, which contains a chart showing how planned and ongoing infrastructure projects (ie, the infrastructure pipeline) are in all sorts of useful areas.

logbar


At least, that’s what it shows if you don’t look closely enough to see the y-axis is in powers of ten. The Statistics Authority thinks

 the chart could leave readers with a false impression of the relative size of investment between sectors. 

and suggests this revision

unlogbar


As a general principle, barcharts are only useful when zero is a relevant value, and since you can’t take the logarithm of zero, log-scale barcharts should never exist.

Context needed in reporting

Two headlines a month apart on the BBC news website, one of the world’s most respected sources for serious news

speaksforitself


The older one, “Schizophrenia: talking therapy offers ‘little benefit’” is based on a summary of 50 randomised trials.

The newer one, “Schizophrenia: Talking therapies `effective as drugs‘”, is based on a report from a pilot study of 74 people that compared cognitive behavioural therapy to no treatment, not to drugs.  It doesn’t mention the earlier story.

Ezra Klein, who’s one of the United States’ top political and economic journalists, has just left the Washington Post to start a new web-based publication.  He writes

New information is not always — and perhaps not even usually — the most important information for understanding a topic. The overriding focus on the new made sense when the dominant technology was newsprint: limited space forces hard choices. You can’t print a newspaper telling readers everything they need to know about the world, day after day. But you can print a newspaper telling them what they need to know about what happened on Monday. The constraint of newness was crucial.

The web has no such limits. There’s space to tell people both what happened today and what happened that led to today.

For health and science stories there should be room for less newness and more context even on paper, since only a tiny minority of the most interesting stories are covered. But even if you can’t explain why today’s headline is different, you can at least notice that it’s the opposite of what you said a month ago.


[update: I lost the credit to Dean Rutland and Ben Goldacre for the picture in editing. My apologies to them.]

February 6, 2014

Briefly

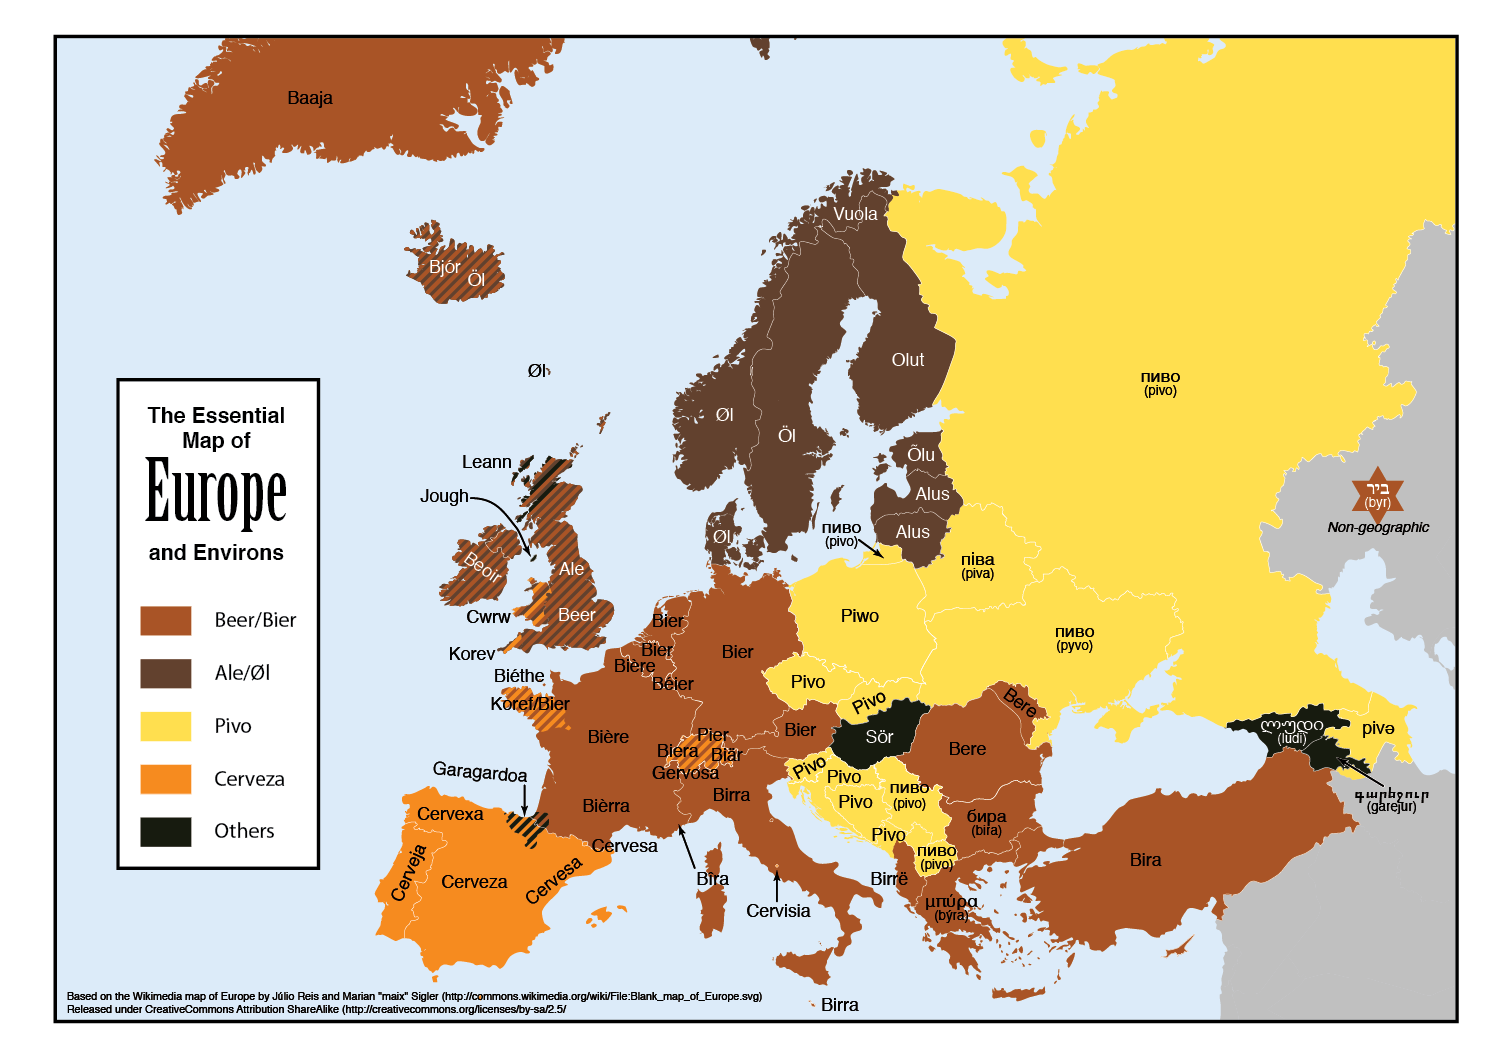
Eurobeer-map

  • From Derek Lowe, a post about recent research suggesting antioxidants may be positively bad for you (translation note: ‘reactive oxygen species’ is roughly what used to be called ‘free radicals’ in this context)
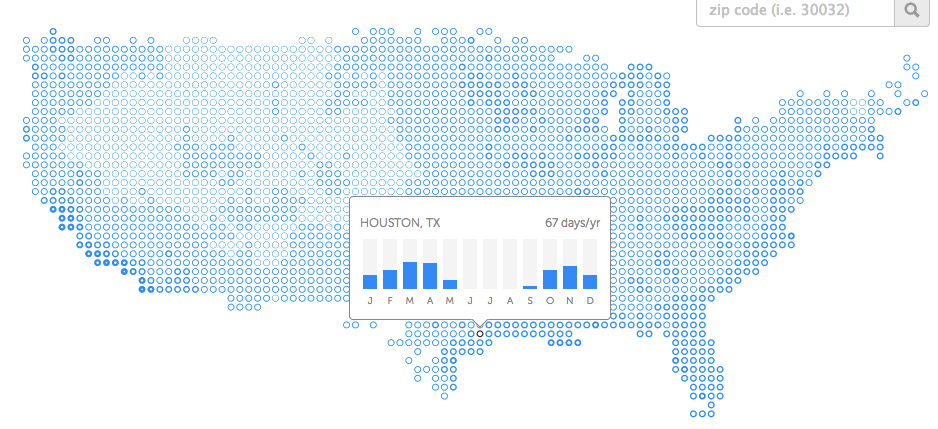
  • Kelly Norton has an interactive map showing the number of ‘pleasant’ days per year in parts of the US. The projection is a bit ugly but the data are interesting.  By his definition, essentially all Auckland days without rain are ‘pleasant’, so Auckland has about 165 pleasant days per year, putting it ahead of everywhere except a few places on the California coast. The key thing he misses out is humidity, so the map says Flagstaff, Arizona has a much less pleasant climate than Chicago, which will be news to many people.

nice

I’m currently in Houston, where it’s pleasant

February 5, 2014

With friends like these

Stuff has fallen for an egregiously over-promoted paper on future temperature-related deaths in the UK

Deaths caused by hot weather are projected to rise by more than 250 per cent, with the elderly most at risk, the New Zealand Doctor magazine reported today.

The increased death rate, driven by climate change, population growth and ageing, would occur by the middle of the century, according to research published in the Journal of Epidemiology and Community Health on Monday.

…

It was found that “in the absence of any adaptation of the population”, heat-related deaths would be expected to rise by about 257 per cent by the 2050s, and cold-related mortality would decline by 2 per cent.

Stuff attributes this story to NZ Doctor, but all they did was reprint an explicitly unedited Green Party press release. [update: it looks as though NZ Doctor did also have a story that provided the last four paragraphs of the Stuff story]

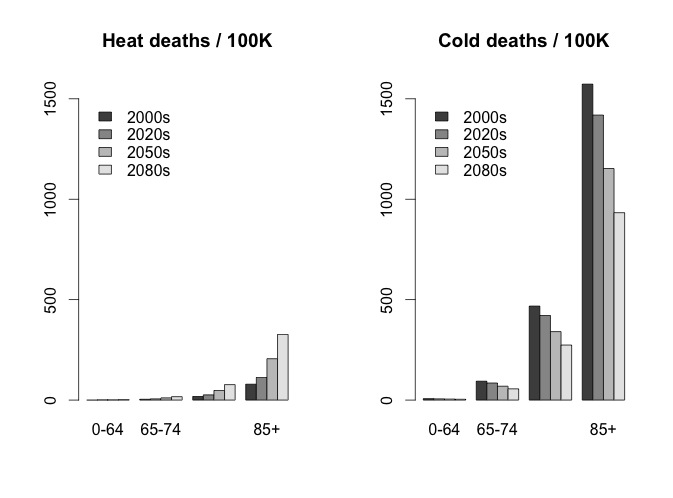
Professor David Spiegelhalter has already savaged this one elegantly on his blog.  All the projected increase in temperature-related deaths in the UK is due to the increase in the number of elderly people.

If you compare people of the same age, the projections say cold-related deaths will fall by about twice as much as heat-related deaths rise, as his graph of the numbers from the paper shows.  That is, the paper actually predicts that global warming will reduce the number of temperature-related deaths in the UK.

bar chart of age-standardised deaths, showing decreases are larger than increases

In the USA or Australia, let alone Africa, India, and other less-wealthy tropical places, there is going to be a real problem with temperature-related deaths from global warming.  In many more parts of the world, there’s a potential for weather-related deaths from drought, flood, storm, and ‘tropical’ disease.

Heat waves in the UK are not in the top ten list of things to worry about from global warming. Pretending they are is likely to be counterproductive.

Sweet as

The Herald gets a bit excitable about a JAMA Internal Medicine paper saying it’s not healthy to eat lots and lots of sugar. The story says

One sugar-sweetened beverage a day is enough to increase the risk of dying from cardiovascular disease (CVD) affecting the heart and arteries.

With the statistical analysis done in the paper that’s really an assumption, not a conclusion — the analysis assumes an exponentially-increasing risk for additional sugar consumption, so if lots of sugar is bad, a little bit will automatically be thought to be bad.

The Herald’s lead was

Consuming too many sugary sweets, desserts and drinks can triple your chances of dying from heart disease.

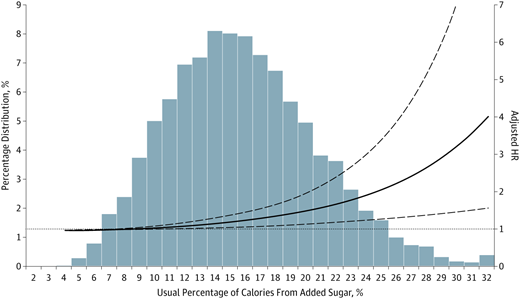
That’s pretty much what the research paper says, but as always “compared to what?”  Here’s the graph from the paper showing the estimated risk (solid line), the uncertainty, and the actual distribution of people’s sugar consumption

m_ioi130135f1


There’s a lot of uncertainty around the risk line, even assuming that the model is correct. More importantly, most people, even in the US, aren’t anywhere near the levels of sugar consumption that get you a tripling of risk.

There’s more detailed commentary at the UK “Behind the Headlines”. Eating lots of additional sugar isn’t good for you. But you knew that already.

Gambling problems

From Stuff

New Zealanders are the world’s fourth-biggest gamblers per capita, new figures show.

The figures come from H2 Gambling Capital, an international gaming research agency, and have been published in the Economist magazine.

This is unusually accurate for a ‘top in the world’ story, the only quibbles being that the data were actually published in one of the Economist blogs, and the data is on  gambling in New Zealand, not on  gambling by New Zealanders — it includes gambling by tourists.

More worrying is the last sentence of the story

The Ministry of Health reports that most New Zealand gamblers are recreational gamblers, with about 0.3 per cent of the population at risk of “problem gambling”.

In fact, the Ministry of Health reports that about 0.3% of the population are actually problem gamblers, “gambling at levels that are leading to negative consequences”,  with another 1% at moderate risk.

February 4, 2014

What an (un)likely bunch of tosse(r)s?

It was with some amazement that I read the following in the NZ Herald:

Since his first test in charge at Cape Town 13 months ago, McCullum has won just five out of 13 test tosses. Add in losing all five ODIs against India and it does not make for particularly pretty reading.

Then again, he’s up against another ordinary tosser in MS Dhoni, who has got it right just 21 times out of 51 tests at the helm. Three of those were in India’s past three tests.

The implication of the author seems to be that five out of 13, or 21 out of 51 are rather unlucky for a set of random coin tosses, and that the possibility exists that they can influence the toss. They are unlucky if one hopes to win the coin toss more than lose it, but there is no reason to think that is a realistic expectation unless the captains know something about the coin that we don’t.

Again, simple application of the binomial distribution shows how ordinary these results are. If we assume that the chance of winning the toss is 50% (Pr(Win) = 0.5) each time, then in 13 throws we would expect to win, on average, 6 to 7 times (6.5 for the pedants). Random variation would mean that about 90% of the time, we would expect to see four to nine wins in 13 throws (on average). So McCullum’s five from 13 hardly seems unlucky, or exceptionally bad. You might be tempted to think that the same may not hold for Dhoni. Just using the observed data, his estimated probability of success is 21/51 or 0.412 (3dp). This is not 0.5, but again, assuming a fair coin, and independence between tosses, it is not that unreasonable either. Using frequentist theory, and a simple normal approximation (with no small sample corrections), we would expect 96.4% of sets of 51 throws to yield somewhere between 18 and 33 successes. So Dhoni’s results are somewhat on the low side, but they are not beyond the realms of reasonably possibility.

Taking a Bayesian stance, as is my wont, yields a similar result. If I assume a uniform prior – which says “any probability of success between 0 and 1 is equally likely”, and binomial sampling, then the posterior distribution for the probability of success follows a Beta distribution with parameters a = 21+ 1 = 22, and b = 51 – 21 + 1 = 31. There are a variety of different ways we might use this result. One is to construct a credible interval for the true value of the probability of success. Using our data, we can say there is about a 95% chance that the true value is between 0.29 and 0.55 – so again, as 0.5 is contained within this interval, it is possible. Alternatively, the posterior probability that the true probability of success is less than 0.5 is about 0.894 (3dp). That is high, but not high enough for me. It says there at about a 1 in 10 chance that the true probability of success could actually be 0.5 or higher.

Keep off the E. coli

It’s not that I deliberately set out to write about the Daily Mail stories in the Herald. I decide to write a post before I get to the source line at the end. It’s just that the really bad stories tend to be imports.

Today’s story starts

Your friend swears by the Atkins diet, your colleague loves Paleo and your neighbour is raving about gluten-free.

So which diet works? Perhaps all of them, according to new research which claims dieting is all in your genes.

In a recent study, scientists claim to have identified a collection of genes that allow humans to adapt to different diets.

Actually

Here we show that Caenorhabditis elegans lifespan is regulated by their adaptive capacity to different diets, which is controlled by alh-6, a conserved proline metabolism gene. alh-6 mutants age prematurely when fed an Escherichia coli OP50 but not HT115 diet.

That is, the research is in mutant nematodes. Not humans. Not mice. Not even fruit flies. The mutations completely disabled the gene. In humans that is extremely rare (though cases have been described). Even in mutant nematodes the dietary difference had nothing to do with weight loss, which is the most common reason for people to diet. And it wasn’t that different diets were better depending on the genetic variant, it was that the difference between a bad diet and a good diet was larger in nematodes with a broken version of this gene.  And the bad diet was composed of E. coli bacteria, which don’t feature highly in Atkins, Paleo, or gluten-free. And.. just no.

It is interesting to see how the claims developed through the chain of citation. The abstract of the paper says

Collectively, our data reveal a homeostatic mechanism that animals employ to cope with potential dietary insults and uncover an example of lifespan regulation by dietary adaptation.

and the paper makes no claims about genetic sequencing or human diets.

The University of Southern California press release says

Your best friend swears by the Paleo Diet. Your boss loves Atkins. Your sister is gluten-free, and your roommate is an acolyte of Michael Pollan. So who’s right? Maybe they all are.

In new research published this month in Cell Metabolism, USC scientists Sean Curran and Shanshan Pang identify a collection of genes that allow an organism to adapt to different diets and show that without them, even minor tweaks to diet can cause premature aging and death.

Finding a genetic basis for an organism’s dietary needs suggests that different individuals may be genetically predisposed to thrive on different diets – and that now, in the age of commercial gene sequencing, people might be able to identify which diet would work best for them through a simple blood test.

introducing the trendy diets and the idea of gene sequencing to guide diets. This was also reprinted in shortened form at Science Daily.

The Daily Mail then reorganised the first paragraph, dropped Michael Pollan (whether because he’s less famous in the UK or because he’s more of a Guardian type) and introduced the assertion that the research found something about humans (rather than that it could be extrapolated to humans).   And the Herald reprinted it.

If you want to know whether a particular reasonably sane diet will work for you, the best way is to try it. That was true in the past, it’s true now, and it’s going to be true for a long time, even with advances in genetics.