February 4, 2014

Approximately quantified self

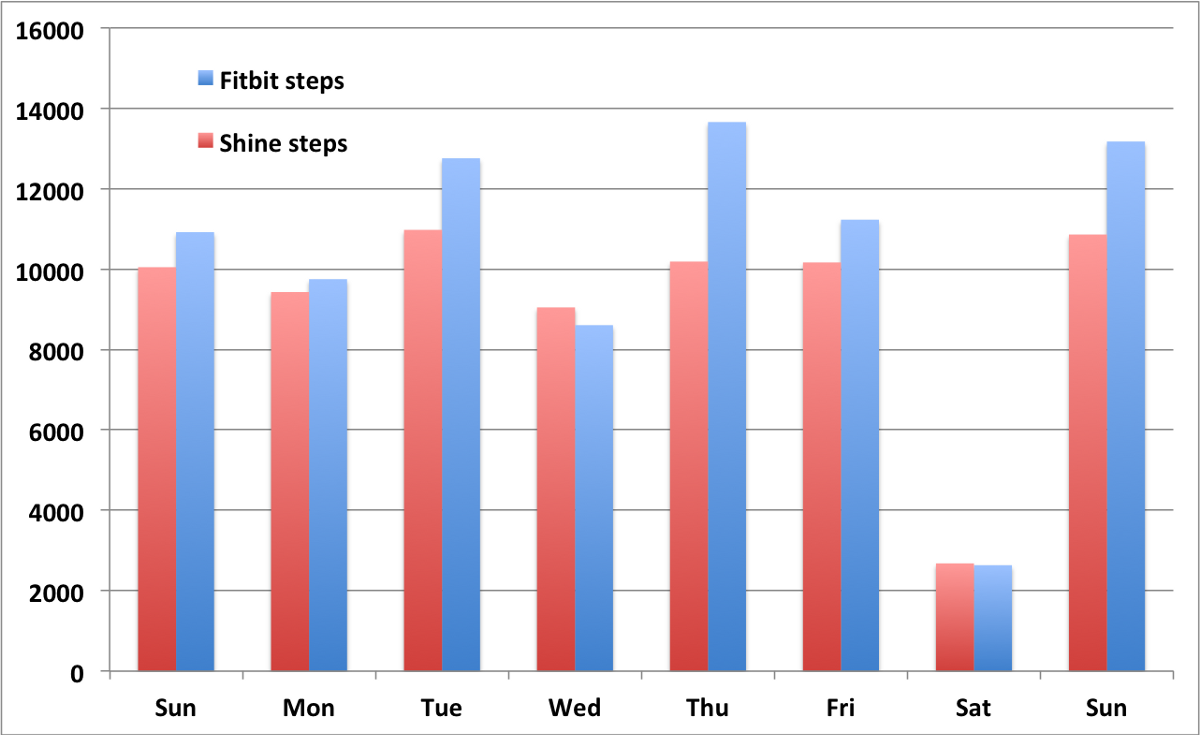
What happens if you wear two activity-monitoring devices at the same time, on the same wrist:

fitbit-shine


February 3, 2014

Abstinence at a distance

The Herald has a headline “Dry January may not have been as good for your health as you thought“, and lead

For many people, the beginning of February marks the end of a month of abstinence from their favourite tipple.

But as we bid a perhaps too enthusiastic farewell to Dry January, one expert is saying that last month’s good intentions may have done more harm than good.

Now, ‘Dry January’ almost certainly has done no real harm or good to readers of the Herald, since it’s a UK thing, and it would be quite hard for British alcohol consumption to have much impact on NZ health.  The story, amazingly, hasn’t even been edited to mention the NZ analog, FebFast, which has just started on Saturday.

With that out of the way, the point of the story is that moderate levels of alcohol consumption are probably beneficial to health, and so giving up alcohol for a month does more harm than good. While it’s nice to see the J-curve acknowledged in the media, it’s unlikely to apply here. If you have any real reason to join the ‘Dry January’ campaign, you’re probably drinking enough to be on the unhealthy side of the curve (like many people in NZ), and the health risks go up fairly fast with increased consumption.  If giving up alcohol for a month does you any good, except in the wallet, it’s likely to do quite a bit more good than harm. It’s true that drinking moderately without a month off would be even better, but that’s not the intervention at issue.

It’s also worth noting that the benefits claimed for beer in the story include its silicon content. That’s a fairly reliable sign of desperation in nutrition claims; it’s not clear that anyone has ever been short of silicon.

Cycling safety

The Herald reports on a nice comparison of Accident Compensation Commission claims rates for cycling and other activities. Michael Chieng, an Auckland medical student, found that the risk of a ACC claim was 35 times higher per rugby game than per two hour cycle ride, with cycling also safer than skiing and horseriding.  The health benefits of cycling are almost certainly greater than the risks, which is why helmet laws aren’t very good public health interventions.

It’s still a bit unfortunate that cycling was compared only to recreational activities, not to other ways of getting from point A to point B. I’m pretty sure that it’s less safe than walking or riding a bus. Also, unlike rugby and skiing, cycling in New Zealand is a lot more dangerous than it should be.

Sadly, I do have to point out, yet again, that there is not only no link to the research, there doesn’t even seem to be a source to link to.

February 2, 2014

Manipulating unemployment

There are two basic sets of numbers related to unemployment: the number of people receiving unemployment benefit, which is easy to measure because the government knows who they are and makes them check in regularly; and the actual number of unemployed people, which is harder to measure and not perfectly well-defined.

Essentially everyone in the world uses the same definition of the unemployment rate: number of people looking for jobs divided by number of people who have jobs or are looking.  This isn’t ideal — it excludes people who’ve given up looking for jobs because there aren’t any — but it’s standard (and endorsed by, eg, the International Labour Organisation).  These numbers are estimated in two ways: by a survey of people (in New Zealand, the Household Labour Force Survey) and by data from businesses (LEED, and the Quarterly Employment Survey, in New Zealand)

In countries such as NZ, with well-run, independent national statistics agencies, the unemployment rate is hard to manipulate because the official statisticians won’t let you. The number on benefits is hard to manipulate because it’s easily measured.  So both numbers are trustworthy measurements of what they measure.  Sometimes, deliberately or accidentally, people confuse the two and say that unemployment has gone down when in fact it’s only the number on benefits that has gone down. If anyone sees examples of deliberate or reckless confusion of numbers on benefits and numbers unemployed, I’d welcome a note either to me or as a Stat-of-the-Week nomination, since it’s an important issue and an easy target for a post.

The current government is not, actually, particularly culpable in confusing these numbers; they prefer to take unjustified credit for the economic improvements following the global recession. For example, Paula Bennett has tended to talk about her ministry’s success in reducing the number of people on benefits (whether it’s true or  not, and whether it’s good or not).

So, I was surprised to see a column by Matt McCarten in the Herald accusing the Government of manipulating the unemployment statistics. He doesn’t mean that Stats New Zealand’s unemployment rate estimates have been manipulated — if he had evidence of that, it would be (minor) international news, not a local opinion column. He doesn’t mean that the published numbers on people receiving unemployment benefits are wrong, either. In fact, none of his accusations are really about manipulating the statistics. Mr McCarten is actually accusing the government of trying to push people off unemployment benefits. Since that’s one of the things Paula Bennett has publicly claimed credit for, it can hardly be viewed as a secret.

Personally, I’m in agreement with him on his actual point, but not on how it’s presented. Firstly, if the problem is the harassment of unemployed people to stop them claiming unemployment benefits, you should say that, not talk about manipulating statistics. And secondly, if there really is widespread public misunderstanding when politicians talk about the state of the economy, it’s hard to see who could be more to blame than the Herald.

January 31, 2014

Briefly

  • Data journalism and computing. Scott Klein (Nieman Journalism Lab, Harvard): In 2014, you will be scooped by a reporter who knows how to program.  Alexander Howard (Tow Center for Digital Journalism Columbia) If you contrast his approach to commentators who make observations about Twitter without data or much experience, it’s easy to score one for the data journalist


  • Post hoc ergo propter hoc: When the Huffington Post writes about a lottery winner “Perhaps fortune cookies really can predict the future. Or at least William Johnson’s did” you know they don’t really mean you to take the claim seriously, so it isn’t really irresponsible. When Stuff writes, in what’s basically an ad for an alternative medicine book  `taking an alternative approach “was a gamble I was willing to take”, Jess says. It paid off,’ it’s less clear that they know this is bogus.  At least they do mention her mother tried the same thing (for a potentially-curable type of cancer) and died. For ‘balance’ read what a cancer surgeon says about this case.


  • There is no meaningful sense in which the recent fall in the Australian dollar affects the affordability of Auckland houses. The problem is bad enough without this sort of nonsense.
January 29, 2014

Mouthwash hogwash?

The Herald (from the Daily Mail again, sigh) has a story about deadly mouthwash

Using mouthwash is a ‘disaster’ for health, increasing the risk of heart attacks and strokes, scientists are warning

In a small experimental study, 19 people who spent two weeks using a type of mouthwash not recommended for long-term use ended up with slightly higher blood pressure, by 2-3.5mmHg (or ‘mmgh’ as the story says). This was an uncontrolled study and everyone had the with-mouthwash and without-mouthwash experimental periods in the same order, so it could just have been a problem of experimental design, but it’s quite plausible that it’s true, and similar results have been found in the past.

What’s a bit surprising is that the story regards this as entirely a bad thing. The hypothesised reasons for the blood pressure difference is that the mouthwash kills bacteria in the mouth that make nitrite. You probably have heard of nitrite in previous Herald or Daily Mail stories.  It’s usually  described as a preservative for cured meats and is anathematised for its presumed potential to cause cancer. Even the introduction in the mouthwash research paper mentions that nitrite has traditionally been regarded as harmful and doesn’t give any of the recent evidence to the contrary.

There is also a widespread belief, though based on relatively weak evidence, that gum and mouth infections increase the risk of heart disease. Since the type of mouthwash being studied is recommended only for treatment, not for long-term use, it might easily decrease rather than increase the risk of heart disease if used as recommended.

It’s not obvious whether the benefits of mouthwash for chronic disease would outweigh the disadvantages, even if the research had studied the sorts of mouthwash (such as Listerine) intended for daily use. It is clear that the context, even context present in the abstract of the open-access research paper, is being ignored.

Using statistics to fight crime

“I want to ‘Money Ball’ criminal justice” – Anne Milgram

Fascinating video from TED.

“When she became the attorney general of New Jersey in 2007, Anne Milgram quickly discovered a few startling facts: not only did her team not really know who they were putting in jail, but they had no way of understanding if their decisions were actually making the public safer. And so began her ongoing, inspirational quest to bring data analytics and statistical analysis to the US criminal justice system.

Anne Milgram is committed to using data and analytics to fight crime.”

January 25, 2014

When do we care about international comparisons?

I’ve done a bunch of posts recently about international comparisons. A good way to get a headline is to say NZ is the worst (second-worst, third-worst) in the world.  These tend not to be true — what’s usually true is that NZ is the worst among a smaller group of countries with high-quality official statistics.

But when do we even care? I’ll look at three recent examples

  • NZ is the worst (only not) in bowel cancer rates, so we need subsidised screening
  • NZ is the third worst (only probably not) in child road deaths, so we need to require child car seats up to age 11.
  • NZ is the second worst (only not) in imprisonment rates, so we need to change the justice system

When deciding whether to subsidise bowel cancer tests there are just two things that matter: whether it works, and how much it costs. If the screening isn’t effective, we shouldn’t do it. If it is effective, but costs a lot more than other ways of preventing the same amount suffering and loss of life, we should do those instead. It doesn’t matter whether the rates are higher in Austria or Australia. No-one should be taking that into account.

When deciding whether to require child car seats, there are three things that matter: do they prevent injuries, how much do they cost to buy, and how much does the law cost in enforcement and in the (subjective but real) costs of forcing people to do things. If the seats don’t prevent injuries, we shouldn’t use them. If they don’t prevent more injuries than other things we could do at a similar price, we should consider those things first. And to make them compulsory, the benefit has to be large enough to be worth the monetary and non-monetary costs of enforcement, but not large enough that parents will do it voluntarily. If we can satisfy these criteria, we should pass the law, regardless of what is happening in other countries. If we can’t satisfy these criteria, we shouldn’t.

Imprisonment rates are a bit different. It’s not obvious what the ‘right’ imprisonment rate is, so international comparisons are actually helpful in deciding whether the NZ rate is high or low. Comparisons to the whole world are still pointless, but it makes sense to compare to other countries with basically similar legal systems and a fairly high level of trust in government.

Even when we shouldn’t care about what is being done in other countries, it’s often useful to know why they do what they do. That’s why I link to things like the US Preventive Services Taskforce recommendations. It’s not that New Zealand should necessarily do what the US does, but the PTF has more resources for making decision, and they show their working. We can look at their collected evidence and read their rationales, and that’s helpful in deciding what to do in New Zealand.

Briefly

  • Warren Buffett is offering a prize of a billion dollars for correctly predicting all 63 US college Division 1 basketball games. Corey Chivers analyses the odds, and summarises as “You’re not going to win, but you’re still going to play.”  (via Jie Fu Yu)
  • According to the Herald, nearly one in three people (28%) admitted to the emergency room on Saturday nights had been drinking. According to the NZ Alcohol and Drug Use Survey 26% of people in New Zealand drink more than twice a week, and it would be deeply unsurprising if Saturday was one of those nights. The real statistic is that 80% of those had been drinking heavily: that’s just over 20%, almost twice the proportion of people who report drinking heavily at least once a week. There is an increased risk, but less than the story implies.
  • Some researchers at Princeton have modelled Facebook as an epidemic (PDF preprint), and predict that 80% of people will recover by 2017. I’m not convinced — they aren’t modelling the heterogeneity in Facebook users, and I think the older users will hang on longer. [Update: Mike Devlin uses web and social media data to show that Princeton will also disappear]


January 24, 2014

Citation needed

From Stuff, in a story about the new child-seat law not being broad enough

New Zealand has the third-highest child road death toll in the OECD, [a group of paediatric specialists] say in this month’s New Zealand Medical Journal.

This group are arguing for child restraints up to age 11, rather than age 7. As you know, I’m skeptical about claims like ‘third-highest’, so I looked at the NZ Medical Journal article. Its claim isn’t as strong

New Zealand compares unfavourably to other OECD countries for child traffic crash-related trauma[2]

And reference 2 is

  1. New Zealand Transport Agency. Child Restraints Fact Sheet 07. Wellington: New Zealand Transport Agency, 2012

which, as you can see for yourself, doesn’t say anything at all about OECD comparisons. Presumably that’s just an editing error in the NZMJ paper, but as far as I can tell, none of the other references were OECD documents either.

The closest thing to OECD statistics I can find on the internets is this 2004 report, based on data from 1996-2000. It does show NZ third out of the set of countries with good enough data to be in the table, so I suspect it’s the source of the statistic. It’s a bit out of date, is nowhere near all of the current OECD, and is for all children 0-14, when the story is about needing child restraints for children 7-11.

The NZ data in the NZMJ article are more up-to-date (2000-2009), but are only for infants 0-4, who have been required to been in proper child seats for the last twenty years, so those data are irrelevant to the point being made.

So in this case the ‘3rd worse’ statistic is true(ish), but you can’t find it where Stuff attributes it, and you can’t find it where the NZMJ paper attributes it. And it’s based on data from a time when the overall NZ road toll (per capita) was twice what it is now, and the number of deaths in children under 14 was three times what it is now.

It’s a good thing the statistic isn’t really relevant to the campaign.


[update: in comments, Glen Koorey has found up-to-date information. New Zealand is currently 10th out of 29 countries in 0-14 road deaths]