January 23, 2014

Really the worst?

Stuff has a story saying NZ is the worst in the world for bowel cancer, according to new World Health Organisation statistics. We’ve looked recently at claims that NZ was 2nd worst and 3rd worst in the world on various measures. They weren’t true. This one isn’t true either, though as with the previous stories, the truth is that NZ is still pretty bad.

The Herald story is more accurate, saying that Australia and New Zealand are the highest; that’s still a bit misleading because it just means the highest among regions, not countries, and because the region is dominated by the Australian data.

Since the stories are calling for more screening, it doesn’t really make sense to look at rates of diagnosis (‘incidence’). Incidence rates can only go up with increased screening, not down — the whole point of screening is to increase diagnosis. It makes more sense to looks at rates of death from bowel cancer (though the claims aren’t actually true for incidence, either).

If we use the new World Health Organisation statistics that both stories mention, and compare deaths from bowel cancer (as a fraction of the whole population, standardised for age) to all the countries for which the World Health Organisation has data, we find that NZ is second-worst in women (the gray line) and the rate of death is almost twice that for Australia.
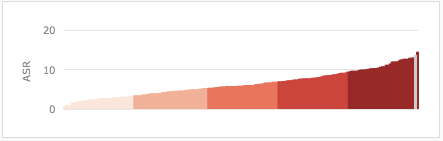
female-mortality

In men, New Zealand is 25th-worst, and about 50% higher than Australia
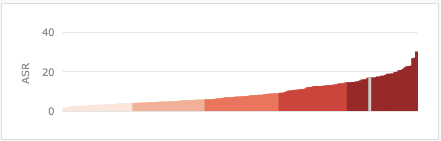
male-mortality

Going for the ‘worst in the world’ title has led to missing a real public-health fact from the new statistics: NZ fatal bowel cancer rates compare much less favorably in women than in men, whether the comparison is to the whole world or to Australia.
But probably not.

From the Herald: “Herbs, berries and red wine could create diabetes barrier”

High intakes of the flavonoids are linked to lower insulin resistance and better control of blood sugar, a study has shown.

Both effects help stave off the onset of Type 2 diabetes

That’s better than the Daily Mail lead

It sounds like the ingredient list for an indulgent dessert. But red wine, chocolate and strawberries are more than a guilty pleasure. They could all help guard against diabetes.

But it’s still misleading.  The study (newspapers,would it kill you to link?) didn’t measure diabetes in anyone, just an estimate of insulin resistance.

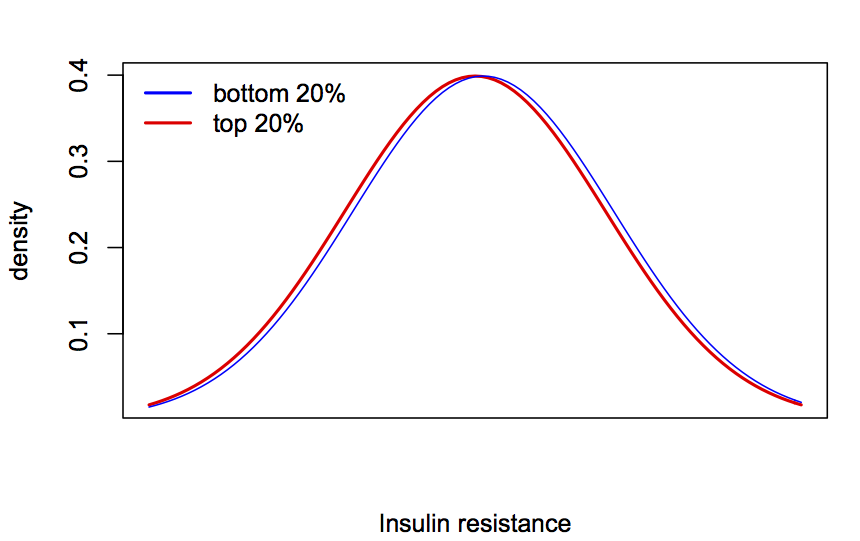
More importantly, the difference is tiny. No, smaller than that. The difference in the insulin resistance estimate between the 20% of participants with the highest and lowest flavanoids in the diet was 0.1. The standard deviation of insulin resistance was 1.6. For people who aren’t as used to visualising this sort of difference, this is what it would look like if they were Normal distributions

bluered


As usual, the StatsChat advice is that there are good reasons to consume red wine and chocolate, but preventing diabetes is not one of them.

Onward and upward

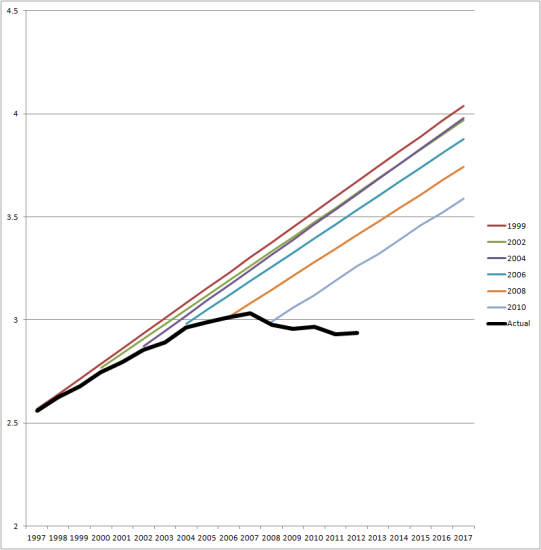
This graph (from Clark Williams-Derry via Andrew Gelman) shows US national traffic forecasts over time (the straight lines) and the reality (the black line)

VMT-C-P-chart-big1-541x550


Initially, the straight-line extrapolation would have made sense, but for the past five years or so it’s been increasingly obvious that it’s bogus.   Some of the fall off from expectations is due to the US recession, but people in the US seem to just be driving less than forecast.

It would be interesting to see this sort of graph for NZ data.

January 21, 2014

Meet Jonathan Goodman, Statistics summer scholar

Every year, the Department of Statistics at the University of Auckland offers summer scholarships to a number of students so they can work with our staff on real-world projects. Jonathan Goodman is working with Associate Professor Brian McArdle on a project called A comparison of multivariate dispersion tests. Jonathan explains:

“The assumption of homoscedasticity, that the groups we are going to compare have the same level of spread, is one of the fundamental assumptions made when doing analysis of variance. My research is looking at the range of tests of equality of variance.   Jonathan Goodman

“Brian has developed a technique that enables us to take tests developed to examine the levels of variance in a single variable and apply them to multivariate data. The aim of my research is to examine the personality of a range of tests in the univariate domain: are they Liberal or Conservative? Do they need lots of data and can they handle lots of groups at once? I will then take the univariate tests, and using Brian’s technique, see how they work with multivariate data.

“Over the past three years, I’ve been using techniques without looking at the machinery behind them. Now I get to break them open, see which work best and where, and perhaps give back to the stats community by helping to optimise the techniques.

“I have just completed my BSc majoring in Statistics and Psychology and next I will be doing my Honours degree in Statistics.

“Statistics is the best subject to study because it gives one the tools to answer questions asked in every subject. I’ve worked with people looking at the feelings of petrol station reps; the attitudes and values of New Zealanders; the effect of the stiffness of the pelvic floor on post-natal pelvic organ disorders; and the effects of different stent designs on aortal blood flow.”

January 20, 2014

What’s wrong with this picture?

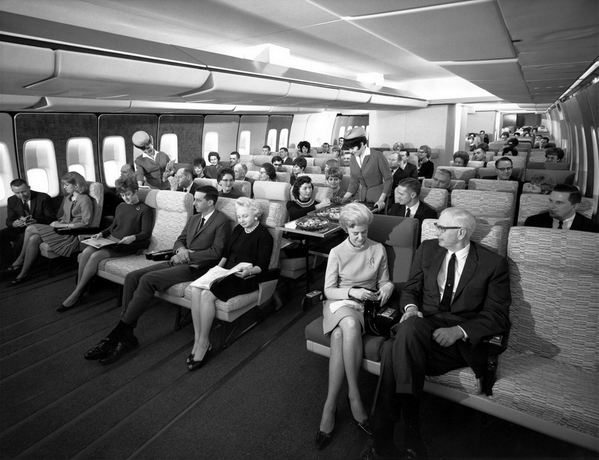
There’s a popular image on Twitter at the moment, labelled as “Economy Class on Pan Am 747 in the late 60’s”

BeXEgN-IYAAeS_d

Air travel, especially in the United States, was much more luxurious then, but there are some problems with this picture.

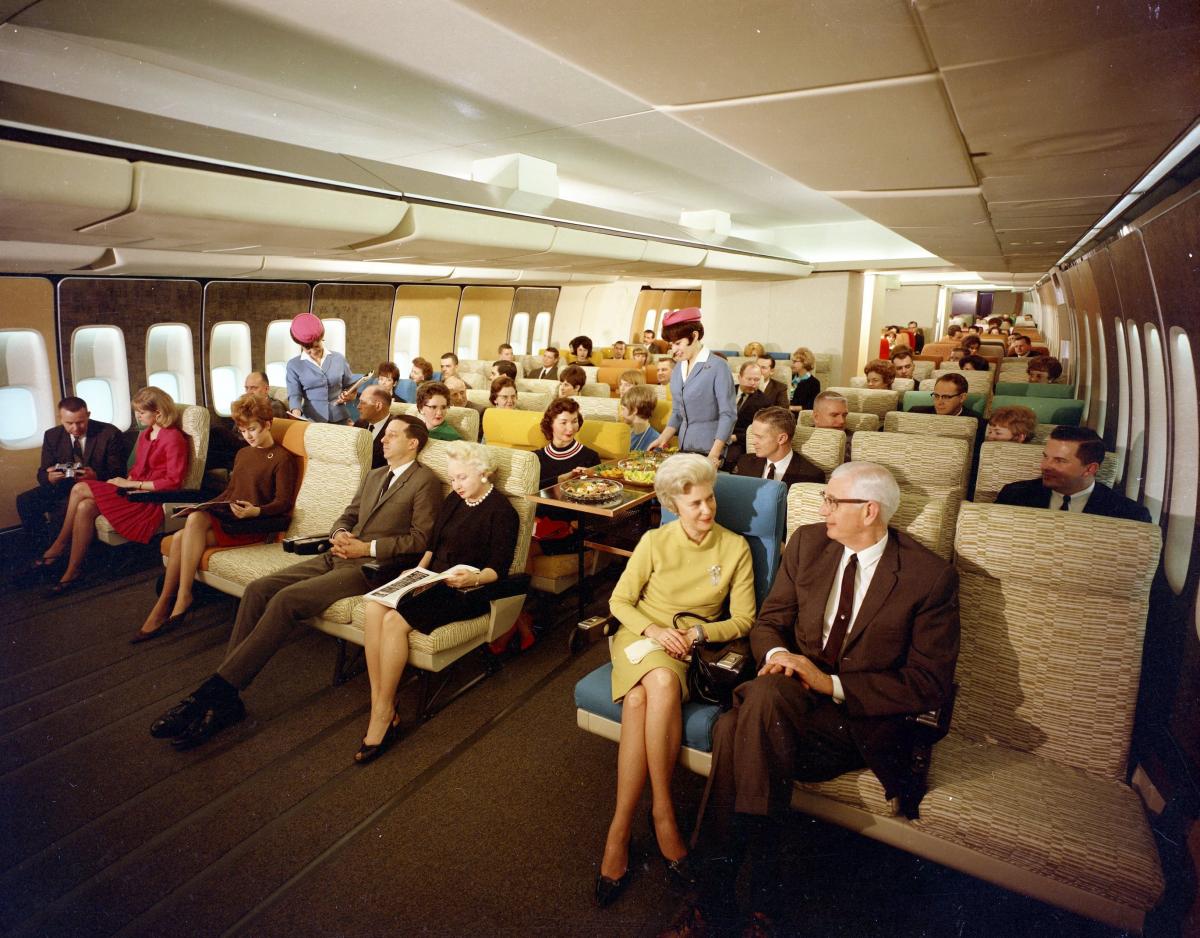
The easy ones: the picture as posted by @HistoryInPics has no attribution. It’s also mislabelled, and has been converted to black and white to make it look more period. The original (via @hypatiadotca) is a Boeing promotional photo of a mock-up of the 747 cabin.

SetWidth1200-K14142

Presumably the mock-up was done with Pan Am and their customers in mind, since Pan Am were the big customer, but that’s not the same thing at all. And the 747 wasn’t used in the 1960s — that’s what I noticed, since I know the first test-flight of the 747 was the year I was born.

Now we’ve got that out of the way, the StatsChat-relevant aspect of the picture is the dramatic fall in the price of flying over the years. In the 1960s Pan Am used to charge about US$500 for a round-trip from New York to London.  Adjusted for inflation, that’s nearly US$4000 now, which would get you a much nicer business-class ticket. In terms of median income the fall in price is even greater, and much greater in terms of the income of the sort of people who used to fly in the 1960s.

My parents moved from the UK to Australia in the mid-1960s. It was ten years before they next saw their families.  That’s what has really changed about flying.


[Update: 2014-5-30  @HistoryinPics has excelled themselves (screenshot)]

Meet Tim Evans, Statistics summer scholar

Every year, the Department of Statistics at the University of Auckland offers summer scholarships to a number of students so they can work with our staff on real-world projects.  Tim (below) is working with Associate Professor Rachel Fewster on a project called Acoustics as a method of wildlife monitoring. Tim explains:

“My research project involves taking noisy audio recordings taken in the bush and trying to extract key features and parameters from these recordings. These features can then be used to train a statistical model that will be able to recognise patterns in bird song and calls of a specific species. The project will focus on recordings of an endangered native species, the kōkako.

Tim Evans

“This research will be of significant use to the conservation efforts for the kōkako. Currently, population estimates rely on being able to find kōkako nests during fledging season and banding new chicks when they fledge. This is extremely difficult, as it relies on extensive hours from volunteers working in dense bush. The vast majority of chicks fledge without being banded.

“With the kōkako detection model, we will be able to use triangulation to pinpoint the position of the birds when they call or sing. This will enable us to monitor their behaviour and narrow down kōkako nests and territories. This will make far easier the process of finding nests and banding and monitor new chicks, and will give rangers and volunteers information about birds’ whereabouts.

“I hold a Bachelor of Engineering (Hons) in Electrical and Electronics Engineering. I am now studying a Graduate Diploma in Science majoring in Mathematics. Statistics appeals to me as it is provides a scientist with a formal language of the real world.”

“In my spare time this summer, I hope to be getting out for the odd surf. I also hope to get out on our yacht with my dad and my brother.”


January 19, 2014

How to beat Lotto

That is, how to gamble in a way that over a course of a year, gives you a higher chance at a larger payout than playing NZ Lotto each week and hoping for Division 1. We all know you can’t “beat Lotto” in the usual sense of improving your odds of winning.

In the ordinary Saturday Lotto, you pick 6 numbers out of 40, and if all 6 are correct (which they aren’t) you win $1 million. The chance of winning is 1 in 3838380 per ‘line’. Suppose you play the minimum of 4 lines, for $6, each week for a year. The chance of winning in a year is one in 18453.75. That is, on average you’d expect to win once in every 18453 years and 9 months.

Alternatively, suppose you save up the $6 per week, and then at the end of the year go to a casino and play roulette.  Put it all on a single number.  If you win, put it all on a single number again, and then if you win,  put it all on a ‘double street’ of six numbers.  Your chance of winning (in double-zero roulette) is 1 in 9145.33, and if you win you will make $2426112.

So, you get twice the chance of winning as you would have for Lotto division 1, and more than twice the payout. The expected return is 85%, much better than the 56% that NZ Lotteries returns (averaged over all its games, annual report).  Does that mean it’s a good idea? No. Not even slightly.  You have a 37 in 38 chance of turning up with $300 and losing it in a few minutes. If you don’t, you have a 37 in 38 chance of losing $7500 in the next few minutes, and if you don’t, you have about an 85% chance of losing more than quarter of a million dollars.   This strategy makes your losses obvious, which makes gambling no fun. And you still only win once every 91 centuries.

Enjoyable gambling, including Lotto, is based on making your losses less obvious by masking them with small wins and stretching them out over time. Of course, that’s also what makes gambling, including Lotto, potentially addictive.

January 18, 2014

Briefly

Prostate cancer controversy

The Ministry of Health has put out two brochures about prostate cancer screening, and there has been a heated reaction from some doctors. Prostate cancer screening in men without any symptoms is controversial, because it makes a lot of sense that it would have benefits, but the estimates from clinical trials are surprisingly small, and it definitely causes harm.  There are plausible reasons to hope the benefits are larger than estimated in the trials, but not clear evidence.

The US Preventive Services Taskforce says that basically no-one should be screened, because there’s moderately good evidence that screening does not prolong life, and gives only small reductions in prostate cancer death. A statement from a group of prostate cancer researchers (somewhat misleadingly called a ‘consensus statement’, given the clear lack of consensus) says basically everyone should be screened because there’s good evidence that it reduces death specifically from prostate cancer. This isn’t just a situation where some people would decide one way and some would decide the other way because of different preferences and values; this is genuine disagreement.

You’re obviously not going to get a resolution of this question from me. But according to the ChCh Press

The Prostate Cancer Foundation says the pamphlets are perfectly balanced and branded the critics as “pathetic”.

Here I do have to disagree.  One of the pamphlets says literally not one word about risk or harm or any possible disadvantage of screening. I don’t see how that can possibly be `perfectly balanced’.

The other one is substantially better; it says

A prostate check aims to reduce your chances of being harmed or dying from prostate cancer. While the PSA blood test and the DRE may be uncomfortable, there is no risk from having them. They do not harm you in any way.

Depending on your PSA and DRE results, you may need to make decisions about more tests and possibly treatments. The tests and treatments have benefits and risks (can cause harm). You need to understand what the benefits and risks are so you can make the right decisions for you and your family and whānau.

The second paragraph there is the important one. Personally, I don’t think it’s sufficiently clear how much the second paragraph takes back the claims of the first, but it is there, as is a description of the treatment options. The pamphlet also does emphasize that screening should be an individual choice, but there isn’t  any suggestion that there is any uncertainty or controversy over the best approach.

In any case, if you’re male, older than, say, Russell Coutts, and the sort of person who reads StatsChat, it’s probably worth reading both the US PTF anti-screening recommendations and the Melbourne Consensus pro-screening recommendations. They are both produced by intelligent, knowledgeable people using the same set of facts and trying their best to help.

It’s a real pity the NZ Guidelines Group is no more. They wouldn’t be able to solve the problem, either, but they might at least be able to referee the argument and perhaps reduce the name-calling.

Desolation of Smog

From the air pollution monitor at the US Embassy in Beijing

01-16-2014 04:00; PM2.5; 671.0; 613; 
  Beyond Index (at 24-hour exposure at this level)

“Beyond Index” means “when we made up the categories, we didn’t bother to go this high because it obviously wouldn’t be needed.”  671 μg/m3 of PM2.5 is roughly the same as the peak particulate air pollution in the Great London Smog of 1952 — only a rough comparison is possible because air pollution was measured differently back then.  The pollution isn’t quite as bad as the London Smog because the Beijing air improves around midday and again in the evening. The 24 hour average was ‘only’ 448μg/m3, and the following day’s average was down to 154, a bit more than four times the US standard for the 98th percentile of days.

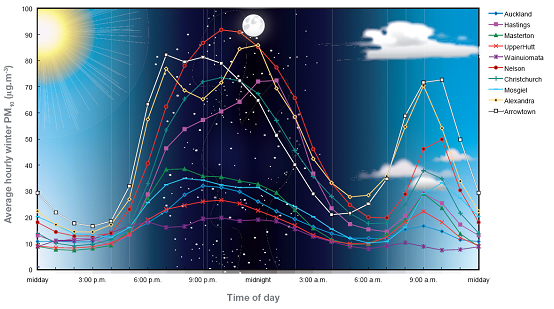
For comparison, here’s a New Zealand graph from GNS. The y-axis is PM10, which includes larger particles that aren’t measured in the Beijing figure; PM2.5 would be very roughly half as high.

air-quality-graph

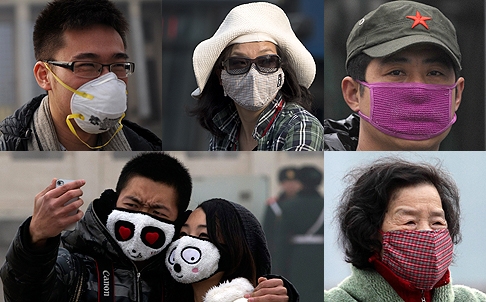
Last month there was a story at Quartz about China’s air pollution, mentioning how sharing face-mask pictures had become a thing. Here are some examples, from the South China Morning Post

masks

They make good photos. They don’t protect you from PM2.5, which goes straight through ordinary paper or cloth masks.