January 18, 2014

Vaccine-preventable disease outbreaks

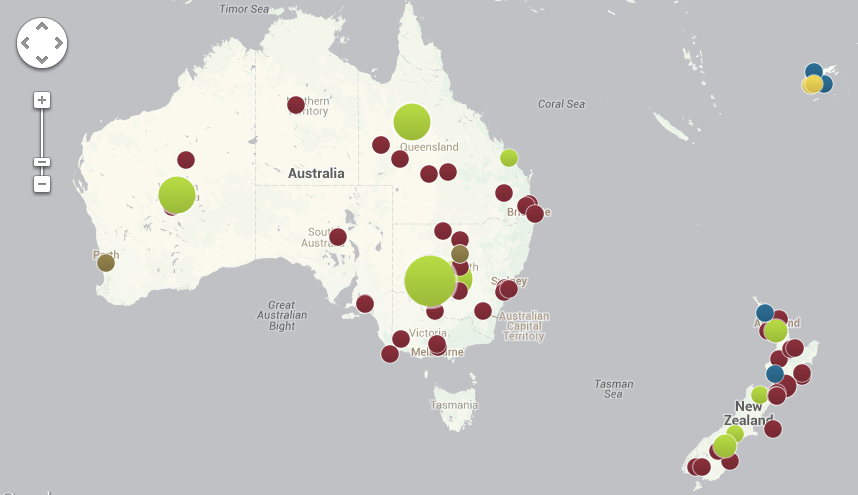
The Council on Foreign Relations has built an interactive map showing outbreaks of the major vaccine-preventable diseases since mid-2008, based on news stories. Here’s the local map

vaccine-oznz


The red circles are measles; the green are pertussis; blue are rubella.

There are two big limitations to the use of news stories as the source. The first is obvious from the map. That outbreak of 3500 pertussis cases in Western Australia wasn’t actually among the Ngaanyatjarra people of the Western Desert, where the circle is. It was mostly in Perth, but the story didn’t say that, just “Western Australia”.

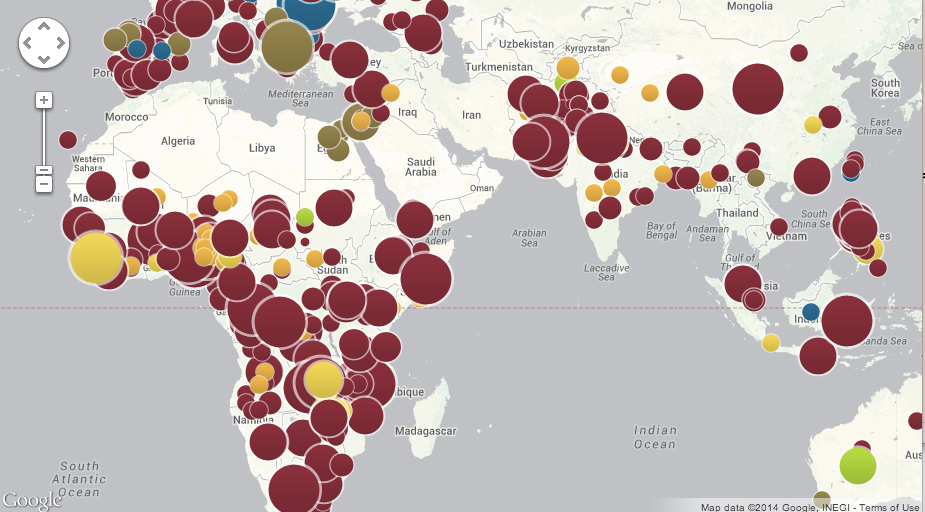
The second limitation is that not everything gets reported. Here’s a map of more of the world

vaccine-world


The small orange circles are  polio, and probably include every polio case diagnosed in the world. The larger, yellow circles include cholera and typhoid, and are just big outbreaks. The brown circles are mumps, which only seems to make the news in Europe and the Middle East. And there’s basically no pertussis reported in Africa or South Asia, because it’s underdiagnosed and not really news.

January 17, 2014

Meet Lily Trinh, Statistics summer scholar

Every year, the Department of Statistics at the University of Auckland offers summer scholarships to a number of students so they can work with our staff on real-world projects.  Lily (below) is working with Dr. Steffen Klaere (Statistics) and Prof Miriam Meyerhoff (Linguistics) on a project called Structure detection in spoken language features. Lily explains:

“I ain’t going nowhere. Me no care.” These are a couple of examples that illustrate my rather interesting project research topic, looking at the use of the non-standard spoken English form also known as Bequia Creole (Bequia is  part of Saint Vincent and the Grenadines). Linguists have hypotheses about Creole speakers using certain language patterns in their speech, and as statisticians we are especially interested in potential groupings among features of Creole and identifying those patterns. Over the summer, we will be analysing data obtained from conversations with speakers from three villages.

Lily Trinh

“One example is the Creole form of negation (ain’t instead of am not in standard English) possibly clustered with negative concord or double negation (I ain’t … nowhere instead of I am not … anywhere in standard English). Some other features of Creole we are also interested in include the zero copular verb (the verb “be” in English), the non-standard subject form, tense-aspect markers and the like. In particular, we would like to use statistical tools to visualise and quantify any clustering relationships.

“Being bilingual myself – I also speak Vietnamese – I hope the research will give some kind of insight into linguistic understanding of spoken languages.

“I have just completed two-and-a-half years of a conjoint BA/BCom degree. Aside from my Statistics major, I am also completing a second major in Economics for the BA component of my degree.

“I really enjoy the problem-solving aspect of science and I admire the magic of numbers to tell stories. In particular, I am amazed by the usefulness of statistics for giving undeniable evidence either for or against a logical- sounding statement. I am still considering whether to go on to Honours in statistics after I’ve finished my time as an undergraduate, but I know for sure a background in statistics will be help me to become a more competent econometrician and generally speaking, help me to make more sense of the world around me.

“Over the summer, I’m looking forward to doing lots of relaxing and pursuing my favourite pastimes: reading, cooking, origami, guitar playing, and spending lots of time at the beach with family and friends.”


Hard-to-survey populations

As we saw a few weeks ago with the unexpectedly high frequency of virgin births, it can be hard to measure rare things accurately in surveys, because rare errors will crowd out the true reports. It’s worse with teenagers, as a new paper from the Add Health study has reported. The paper is not open-access, but there’s a story in MedicalXpress.

So imagine the surprise and confusion when subsequent revisits to the same research subjects found more than 70 percent of the self-reported adolescent nonheterosexuals had somehow gone “straight” as older teens and young adults.

“We should have known something was amiss,” says Savin-Williams. “One clue was that most of the kids who first claimed to have artificial limbs (in the physical-health assessment) miraculously regrew arms and legs when researchers came back to interview them.”

This wasn’t just data-entry error, and it probably wasn’t a real change; after some careful analysis they conclude it was a mixture of genuine misunderstanding of the question (“romantic” vs “sexual” attraction), and, well, teenagers. Since not many teens are gay (a few percent), it doesn’t take many incorrect answers to swamp the real data.

It doesn’t matter so much that the number of gay and bisexual teenagers was overestimated. The real impact is on the analysis of health and social development in this population.  In Add Health and at least one other youth survey, according to the researchers, this sort of error has probably led to overestimating the mental and physical health problems of non-heterosexual teenagers.

January 16, 2014

Meet Hongbin Guo, Statistics summer scholar

Every year, the Department of Statistics at the University of Auckland offers summer scholarships to a number of students so they can work with our staff on real-world projects.  Hongbin Guo (below) is working with Dr. Stephane Guindon on a project called Incorporating spatial information into the coalescent. Hongbin explains:

“We all share a common ancestor. The age of that ancestor strongly depends on the size of the population under scrutiny. For instance, two individuals randomly chosen in New Zealand (a large population) will generally have Hongbin Guoan older common ancestor compared to two randomly-chosen individuals from the same family (a small population). Kingman’s coalescent translates this idea into a simple yet powerful statistical tool that has been used to infer the size of populations given the genealogies of groups of individuals.

“However, this approach does not account for spatial information – the location of individuals is simply ignored. Since closely-related individuals also tend to live next to each other, incorporating spatial information into the coalescent appear like a relevant extension of this model. This project aims at making a first step in this direction.

“I am an international student from China, and this is my fourth year at the University of Auckland. I have a BCom\BSc in Economics, Statistics and Mathematics; this year I am doing Honours.

“Statistics appeals to me because our society is built on information, and statistics is the study of finding logic and useful information in messy piles of data. It is the study of bringing beauty out of chaos. Statistics is extremely useful in all fields of science.

“This summer, when I am not working on my project, I want to take a trip to the South Island and see beautiful New Zealand. In the past four years, thanks to my workload, I haven’t got out of Auckland. I am really grateful for this scholarship – hard work pays off, indeed!”


Private-sector surveillance

A maths-free article on data mining and surveillance, from the New York Review of Books

Using techniques ranging from supermarket loyalty cards to targeted advertising on Facebook, private companies systematically collect very personal information, from who you are, to what you do, to what you buy. Data about your online and offline behavior are combined, analyzed, and sold to marketers, corporations, governments, and even criminals. The scope of this collection, aggregation, and brokering of information is similar to, if not larger than, that of theNSA, yet it is almost entirely unregulated and many of the activities of data-mining and digital marketing firms are not publicly known at all.

January 15, 2014

He’s a forestry export statistic and he’s ok

From the Herald

Log exports to China are driving an increase in the value of New Zealand’s forestry products – which has more than doubled in the past 20 years, according to figures from Statistics New Zealand.

and from Stats NZ, this infographic (click to embiggen, as usual)

forestry-exports-infographic-jpg


In both the infographic and the Herald story there’s interesting information about changes in the makeup of NZ forestry exports (more logs, more to China), but in both cases the headline number is a bit misleading.

The change is from $1.9 billion in 1992 dollars to $4.5 billion in 2012 dollars. It’s not explicit that the dollar values are nominal, but they are — if I were a newspaper I’d say “evidence obtained by StatsChat under the Official Information Act”, which is to say I asked the always-helpful @StatisticsNZ twitter account.

My general view is that comparing nominal dollars twenty years apart is Not Even Wrong, but I have to admit it’s not obvious what the ideal adjustment would be. Consumer Price Index? Producer Price Index? Something that involves exchange rates? For that reason, here’s a selection of adjustments

  • CPI: $1.9 billion in 1992 is $2.97 billion now, using the Reserve Bank’s calculator, which all journalists should have bookmarked
  • PPI (outputs, all industries) $1.9b in 1992 is $3 billion now
  • PPI (inputs, all industries) $1.9b in 1992 is $3.1 billion now
  • As a proportion of GDP, forestry has fallen from 2.5% to 2.1%
  • As a proportion of all exports, forestry has fallen from 10.4% to 9.4%

So, there’s a reasonable degree of agreement between measures that forestry has increased in value about 50% and has fallen slightly as a fraction of the economy. “More than doubled” doesn’t seem defensible.

(via @kiwieric)

Briefly

‘Approaches to measurement’ edition

Meet Geyang Mao, Statistics summer scholar

Every year, the Department of Statistics offers summer scholarships to a number of students so they can work with our staff on real-world projects. Geyang is working with Dr Ian Tuck on a project called Correlations between air pollutants.  Geyang, below, explains:

“It is likely that the levels of air pollutants are somehow related in time if they arise from a common source such as vehicle emissions. Relationships between levels of pollutants could also be influenced by meteorological conditions, such as wind speed. Furthermore, the relationship may change in time as the nature of emissions changes due to technological change or emission controls.

Geyang Mao

“My research is about investigating the nature of the correlation between a number of key air pollutants, using data collected by Auckland Council and National Institute of Water and Atmospheric Research.  This project mainly focuses on predicting PM2.5 from PM10 and investigating correlation between particle number concentration (PNC) and nitrogen oxides (NOx).

“PM2.5 refers to particles smaller than 2.5 micrometers, which tend to penetrate into the gas-exchange regions of the lung. They can adversely affect human health and also have impacts on climate and precipitation. It is becoming very important to measure PM2.5 level in Auckland Council’s air-quality monitoring network. However, most weather stations in New Zealand monitor just the level of PM10. It is too expensive to measure all pollutants at all times, therefore, this project will be very useful if we can establish the relationship between correlated pollutants so that concentrations of one may be estimated from concentrations of the other.

“I have just finished my third year of a Bachelor of Science/ Bachelor of Commerce conjoint majoring in Statistics, Accounting and Finance, and I plan to pursue postgraduate studies in Statistics after I graduate.

“Statistics appeals to me because of its relevance to a lot of real-world problems. Stats can be widely applied to almost every industry. It helps us to make sense of data and extract useful information from large datasets. Furthermore, Statistics provides me with many quantitative skills that are transferable across a wide range of fields and has improved my problem-solving ability significantly. I have found learning stats at the University of Auckland to be very enjoyable due to the great learning environment and friendly lecturers.

“Over the summer, I’m also doing a lot of relaxing: catching up with friends, watching movies, spending some time at the beach and playing computer games.”
 

Fancy packaging of plain packaging impact

The Sydney Morning Herald has a story on the impact of plain packaging for cigarettes in Australia.  Cancer researchers in Sydney found a big spike in calls to Quitline after the packaging change, and interpreted this as evidence it was working

The researchers said although the volume of calls to Quitline was an ”indirect” measure of people’s quitting intentions and behaviour, it was more objective than community surveys where people can answer questions in a socially desirable and biased way.

On the other side, tobacco companies say there hasn’t been any actual fall in smoking.

”In November 2013, a study by London Economics found that since the introduction of plain packaging in Australia there has been no change in smoking prevalence … What matters is whether fewer people are smoking as a result of these policies – and the data is clear that overall tobacco consumption and smoking prevalence has not gone down,” he said.

In this setting you might reasonably be concerned that either side is putting their results in fancy packaging. So what should you believe?

In fact, the claims are consistent with each other and don’t say much either way about the success of the program.  If you look at the research paper, they found an increase peaking at about 300 calls per week and then falling off by about 14% per week. That works out to be a total of roughly 2000 extra calls attributed to the packaging change, ie, just over half a percent of all smokers in Australia, or perhaps a 10% increase in the annual Quitline volume. If the number of people actively trying to quit by methods other than Quitline also goes up by 10%, you still wouldn’t expect to see much impact on total tobacco sales after one year.

The main selling point for the plain packaging (eg) was that it would prevent young people from starting to smoke. That’s what really needs to be evaluated, and it’s probably too early to tell.


[Update: Of course, other countries that were independently considering changing their policies shouldn’t wait for years just because Australia started first. That would be silly.]

[Update: the Quitline data are just for NSW; so perhaps 1.5% of smokers]

January 14, 2014

Causation, counterfactuals, and Lotto

A story in the Herald illustrates a subtle technical and philosophical point about causation. One of Saturday’s Lotto winners says

“I realised I was starving, so stopped to grab a bacon and egg sandwich.

“When I saw they had a Lotto kiosk, I decided to buy our Lotto tickets while I was there.

“We usually buy our tickets at the supermarket, so I’m glad I followed my gut on this one,” said one of the couple, who wish to remain anonymous.

Assuming it was a random pick, it’s almost certainly true that if they had not bought the ticket at that Lotto kiosk at that time, they would not have won.  On the other hand, if Lotto is honest, buying at that kiosk wasn’t a good strategy — it had no impact on the chance of winning.

There is a sense in which buying the bacon-and-egg sandwich was a cause of the win, but it’s not a very useful sense of the word ’cause’ for most statistical purposes.