December 18, 2013

Survival analysis of chocolate in hospital

You may remember StatsChat’s criticism of data quality and analysis in paper about chocolate and Nobel Prizes from a leading medical journal.  Another leading medical journal, BMJ, traditionally has a Christmas issue with not entirely serious papers, typically based on good-quality silly research. One of the past highlights was the systematic review of randomised trials of parachute use.

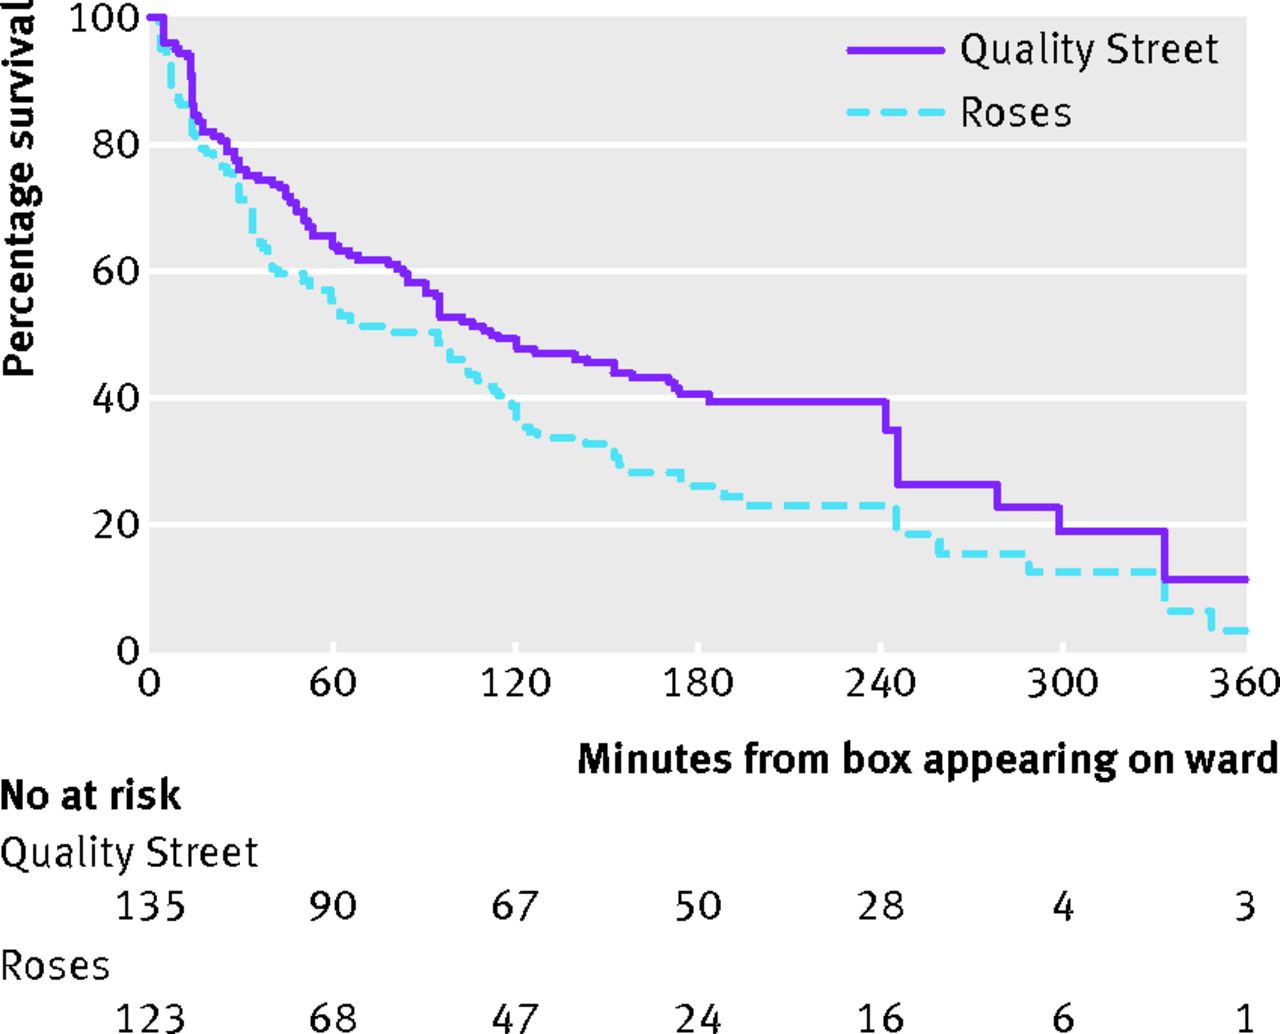
This year, there’s a survival analysis of chocolate in hospital wards. Survival analysis is the branch of statistics working with the time until an event happens.  Often the event is death, hence the name ‘survival’, but it could be something else bad, such as a heart attack, or something good, such as finding a job.  If you’re a chocolate, it’s being eaten.

survival


The data are a good fit to a constant hazard of consumption, with a rate of just under 1%/minute.  There isn’t any sign of strong heterogeneity — if some chocolates are preferred to others, the preference is either not strong enough or variable enough between people that no chocolates are safe.

Other papers in the Christmas issue include a semi-serious comparison of stem cell size and structure for mice and whales, and the finding that, in Dublin, people called Brady are more likely to have pacemaker treatment for bradycardia (presumably a multiple comparison issue)

December 16, 2013

Briefly

“In any case, the current uncertainty about any benefit from helmet wearing or promotion is unlikely to be substantially reduced by further research” – Ben Goldacre and David Spiegelhalter

  • NZ cartographer Chris McDowall (@fogonwater) “When presented with an unlabelled map depicting a random part of the country, I can identify most places purely on the basis of their shape. But, when I close my eyes, their forms fade away …. The maps on this page are an attempt to translate my head landscapes into cartographic artefacts. I am trying to recreate of what I see when I close my eyes“

Stat of the Summer Competition: December 14 2013 – February 28 2014

This summer, we would like to invite readers of Stats Chat to submit nominations for our Stat of the Summer competition and be in with the chance to win a copy of “Beautiful Evidence” by Edward Tufte:

Here’s how it works:

  • Anyone may add a comment on this post to nominate their Stat of the Summer candidate before midday Friday February 28 2014.
  • Statistics can be bad, exemplary or fascinating.
  • The statistic must be in the NZ media during the period of December 14 2013 – February 28 2014 inclusive.
  • Quote the statistic, when and where it was published and tell us why it should be our Stat of the Summer.

On Monday 3 March 2014 at midday we’ll announce the winner of the Stat of the Summer competition, and restart the weekly competition.

The fine print:

  • Judging will be conducted by the blog moderator in liaison with staff at the Department of Statistics, The University of Auckland.
  • The judges’ decision will be final.
  • The judges can decide not to award a prize if they do not believe a suitable statistic has been posted.
  • Only the first nomination of any individual example of a statistic used in the NZ media will qualify for the competition.
  • Individual posts on Stats Chat are just the opinions of their authors, who can criticise anyone who they feel deserves it, but the Stat of the Week award involves the Department of Statistics more officially. For that reason, we will not award Stat of the Week for a statistic coming from anyone at the University of Auckland outside the Statistics department. You can still nominate and discuss them, but the nomination won’t be eligible for the prize.
  • Employees (other than student employees) of the Statistics department at the University of Auckland are not eligible to win.
  • The person posting the winning entry will receive a copy of “Beautiful Evidence” by Edward Tufte.
  • The blog moderator will contact the winner via their notified email address and request their postal address for the book to be sent to.
  • The competition will commence Saturday 14 December 2013 and continue until midday Friday 28 February 2014.

Giving and receiving

I’ve been looking at our links in and out over the past year.  Leaving out Twitter, Facebook, various RSS readers, and Reddit, we get the most traffic from Kiwiblog and Simply Statistics, with consistent appearances from Observational Epidemiology, Lindsay Mitchell, Learn and Teach Statistics, Andrew Gelman, Public Address, Anti-Dismal, and my other blog.

Unsurprisingly, our largest outward traffic is to Stuff and NZ Herald, in about a 2:3 ratio.  Wikipedia is next, including informative technical references such as the Optional Stopping Theorem,  Berkson’s Paradox, and the Asch conformity experiments, and cultural phenomena you might not have encountered, such as the Bechdel test, Satoshi Kanazawa, and ‘Hitler Has Only Got One Ball’.

The other main media sites you clicked through to were the BBC, the Guardian, the Washington Post, and the New York Times.

December 15, 2013

He knows if you’ve been bad or good

From today’s Herald (or the very similar story at 3News)

A Wellness in the Workplace survey show sickies taken by people who aren’t really ill are estimated to account for 303,000 lost days of work each year, at a cost of $283 million.

Skipping over the estimate of over $900/day for the average cost of a sickie, this is definitely an example where a link to the survey report and some description of methodology might be helpful. The report says

The survey was conducted during the month of
June 2013. In total, 12 associations took part,
sending it out to a proportion of their members.
In addition, BusinessNZ sent the questionnaire
to a number of its Major Companies Group
members. Respondents were asked to report their
absence data for the 12-month period 1 January to
31 December 2012 and provide details of their policies
and practices for managing employee attendance.

In total, 119 responses were received from entities
across the private and public sectors.

which gives more idea about potential (un)representativeness. But most importantly,  while the survey has real data on numbers of absences and on policies, the information on how likely employees were to take sick leave when not sick was just the opinion of their employers. Unless you work for Santa or the NSA, this is going to have a large component of guesswork.

If you’re an employer, and you want to know whether inappropriate use of sick leave is a problem for your organisation, do you want to rely on your own guesses, or on an average of guesses by an anonymous assortment of 119 other organisations around the country?

How much evidence would you expect to see?

[UPDATE: I got the calculations wrong, and was too kind to the MoT and the paper. The time to get good evidence is more like 20 years.]


The Sunday Star-Times has a story saying that the reduction in speed-limit tolerance, which is now on all the time in the summer, hasn’t yet shown evidence of a reduction in road deaths. And they’re right, it hasn’t, despite some special pleading from the Police Minister and Assistant Commissioner David Cliff. We’ve looked at this issue before.

However, it’s also important to ask whether we’d expect to see evidence yet if the policy really worked as promised. The Star-Times goes on to say:

While MOT data shows just 13 per cent of fatal crashes were attributable to speed Land Transport Safety Authority spokesman Andy Knackstedt said there was “a wealth of evidence” that showed even very small reductions in speed led to reductions in fatalities and serious injuries, and that lowering the enforcement tolerance meant lower mean speeds.

So, we should ask whether we’d expect a clear and convincing drop in road deaths if the theory behind the policy was sound. And we wouldn’t.

Let’s see what we should expect if the policy prevented 10% or 20% of the deaths from speeding, which works out to 1.3% or 2.6% of all road deaths.  The number of deaths last year was 286, over 366 days. Under the simplest model for road crash data, a Poisson process that basically assumes different roads and time periods are independent, we can work out how long you’d have to wait to have a 50% chance or an 80% chance of the reduction getting below the margin of error

For a 20% reduction in deaths from speeding it takes about 190 days to have an even-money chance of seeing evidence, and about 390 days to have an 80% chance. For a 10% reduction in deaths from speeding it takes about 380 days for an even-money chance of convincing evidence and 760 days for an 80% chance. Under more complex and realistic models for road deaths it would take longer.

There’s no way that we could expect to see convincing evidence yet, and given the much larger unexplained fall in road deaths in recent years, it will probably never be feasible to evaluate the policy just based on road death counts.  We’re going to have to rely on other evidence: overseas data, information on reductions in speeding, data from non-fatal or even non-injury crashes, and other messier sources.

December 13, 2013

An interesting thing about the referendum

The referendum preliminary results are in, and as you’d expect, there is a substantial majority for “No”, but it’s also substantially smaller than the number who voted National at the last election. Everyone will be able to say the results support their own views, so I won’t bother.

What is interesting is the relationship between turnout and vote. Before going further, think about what you’d expect. (more…)

Heritability doesn’t measure nature vs nurture

Q: Have you read the latest issue of PLoS One?

A: What do you mean? PLoS One doesn’t have “issues”, it’s online-only and publishes papers as soon as they are ready.

Q: Well, have you read the study that led to the headline ‘exam results are influenced by genes, not schools‘, which the Herald says is in the latest issue of PLoS One?

A: Perhaps they mean this paper about heritability of exam results.

Q: Yes, that one. Couldn’t they have just linked to it?

A: My sources tell me linking is harder than it looks.

Q:  Whatever. How did they find out that schools don’t matter?

A: That’s not quite what they found out.

Q: Well, they found 60% of education was due to genes, not schools, didn’t they?

A: What would that even mean?

Q: I thought I got to ask the questions.

A: <sigh>

Q: Ok, what did they find?

A: They found that identical twins had a correlation of about 0.8-0.9 between their exam results, and non-identical twins had a weaker correlation, about 0.5-0.6.  If you assume that the only difference between identical and non-identical twin pairs is that the identical twins share more genes, and that the genetic and non-genetic contributions just add, you can estimate how much of the variation between twins was due to genes and how much is due to environmental factors. And they end up with estimates from 40% to 60% for the genetic part.

Q: How is that different from the headline?

A: The effects aren’t going to be additive in reality — genetics isn’t going to let you pass a British history test if you haven’t ever studied any British history — so the heritability is just a summary of variation in the current population under the current conditions. What the study really finds is that British schools currently differ from each other less than British kids do. If you made a lot of kids from Beijing or Buenos Aires take the British GCSE tests (or vice versa) they’d probably do really badly, and that would definitely be due to their schooling, not their genes.

Q: And what do the researchers say?

A: Pretty much what I said. The Herald quotes them further down in the story

“Since we are studying whole populations, this does not mean that genetics explains 60 per cent of an individual’s performance, but rather that genetics explains 60 per cent of the differences between individuals, in the population as it exists at the moment.

“This means that heritability is not fixed – if environmental influences change, then the influence of genetics on educational achievement may change too.”

Q: If schools were improved, would the heritability of exam results increase or decrease?

A: That’s a very interesting question. We don’t know. It could be that better schools would have more benefits for people who currently do poorly for genetic reasons, and would reduce heritability; it could be that they would have more benefits for people who currently do poorly for environmental reasons, and would increase heritability; it could be that they would have more benefits for people who currently do well for genetic reasons, and would increase heritability; it could be that they would have more benefits for people who currently do well for environmental reasons, and would decrease heritability. Or it could be that they wouldn’t use exams.

Q: What does this research tell us about the UK’s falling position on the PISA international education comparison? Or is that the fault of Facebook and email, like the UK Schools Minister says?

A:  Well, it’s not genetic.  The genes of the UK population don’t change fast enough. It’s probably not due to Facebook, either, but at least that’s conceivable.

Q: Are the results surprising?

A: Not especially. Similar correlations are seen in IQ test results, where we do know from changes over time that environmental differences can have a large impact. It’s a bit surprising that test scores are slightly more heritable than IQ test results.

Q: Could you give a less controversial example, perhaps something like height?

A: Height is an excellent example.  The fact that siblings have similar heights shows the large genetic component when environments are similar; the fact that most people are taller than their parents or grandparents shows the large environmental component when genetics are similar. If you look in a wealthy Western country, height is about 80% heritable. In medieval Europe it would have been much more sensitive to environment, since the nobility were much healthier and better-nourished than the peasants. And if you mixed together people from medieval Europe and modern Europe, about half the variability would be due to which era they came from.

 

December 12, 2013

Fly? You fools!

It’s time for our annual holiday drive-vs-fly post.

Last year I looked at safety: for trips where either flying or driving is feasible, flying is much safer.

This year, let’s look at fuel economy and carbon emissions.  Holiday flights tend to be  full, which makes them more efficient. According to random people on the internet, a Boeing  737 with winglets uses about 3 litres/seat/100km, and according to more reliable sources, Air New Zealand’s smaller turboprop Q300’s will use about 5 litres/seat/100km. (Car and jet fuels are different, but they both have an energy density of about 36MJ/litre and roughly two hydrogens per carbon, so are similar for this purpose.)

There are two further complications: firstly, take-off and landing use more fuel (based on Figure 3 in this report, they add about 250km of effective distance). And secondly, the global warming impact of emissions at high altitude is greater than the same amount of CO2 at ground level, by a factor that is uncertain, but in the range 1.3-2.9.

According the Ministry of Transport national fleet data, the average car in NZ seems to use about 10 litres/100km in real life. In terms of fuel use for long-distance flight, a car with 3-4 people would be comparable to flying on a full 737, and a car with 2 people would be comparable to flying on a full Q300 turboprop. For short NZ distances, the take-off/landing cost adds a good 50%, and the extra impact of high-altitude emissions means that cars win out, though by a relatively small margin if there’s only one person in the car.

A direct comparison like this misses the real emissions problem with planes, though. Hardly anyone drives to the Cook Islands or Australia over Christmas — planes let you travel further.

Stats abuse in The Press, Dom Post smacked by Press Council

The New Zealand media is self-regulating – that is, it governs its own, and the Press Council is the port of call for public complaints about print media. Two complaints that have been upheld recently focused on the use/abuse of statistical information. I’m posting about these  not to take a dig at my esteemed colleagues, but to point out how we can avoid falling into a hole and/or creating a damaging, discriminatory or dangerous urban myth.

The first complaint concerns the The Press (Weekend) newspaper, which published an article on Saturday October 12, 2013, about health data from the Canterbury District Health Board concerning the increase in the sexually-transmitted infection chlamydia in the region since 2011. The headline of the article was Luck of the Irish has downside in sex-disease stats. The intro read “Irish workers helping with the rebuild are sharing the love but it seems they may also be helping to spread sexual disease.”

The Press Council noted there was no statistical information given to support the statements linking the Irish to the chlamydia. The link between the Irish nationals and the chlamydia statistics was of the newspaper’s making and not supported by any reported information, making the report inaccurate and discriminatory.  Read the full decision here.

The second complaint concerns the Dominion Post. On August 12, 2013, under the headline Boys slip further in school’s co-ed class, the paper published a story and table about achievement rates in 2012 for NCEA level 3 students in its circulation area, with the table reporting on highest and lowest achieving schools. The table gave pass rates for the highest achieving schools, but failure rates for the lowest achieving schools. Under the heading “Lowest Achieving Hawke’s Bay Schools” the table listed Wairoa High School 43.8% not achieved; Dannevirke High School: 40%; Taradale High School: 36.2%. The school complained that this conveyed a misleading impression that only 36.2% of its students had passed. In fact, 63.8% had.

It turns out that the original NZQA figures showed the number of year 13 students who had NOT passed NCEA level 3. The newspaper said that it had decided to turn the figures around to assist readers and also show how well most schools and students had performed.  In upholding the complaint, the Press Council said “A table provides readers with a quick and ready means of assessing data. But when a comparison is being made it is important that the data is presented in such a way as to make the comparison valid. The use of two differing measures of data in the same table was therefore confusing and misleading.” The editor said, ” … I do accept that we would have been better advised to have used only one measure throughout. I am happy to give an undertaking that we will not be using that format again.” Read the full decision here.