December 11, 2013

As you do

From Stuff, where GJ Gardner are asking for a GST exemption for their industry

“For example, if the average Kiwi purchases a house worth $600,000, they end up paying $90,000 in GST.”

That’s not a house+land worth $600k, that’s just the value of the new building. In Auckland, the ratio of land to building value averages about 60:40, so you’d expect that to be $1.5 million of real estate. The average Kiwi isn’t quite buying at that level.

At that 60:40 ratio, even if there were no increase in construction costs as a result, the impact of removing GST would be to reduce the price of new homes by about 5%. Auckland prices have increased by twice that much this year already, so it’s not going to solve the problem. In fact, the price reduction would almost certainly be smaller than that — if prices are constrained by available money, and GST is decreased, people will spend some of the savings on more expensive construction.

GJ Gardner are right that the only solution to housing prices is more homes, but in Auckland it’s either going to be necessary to decrease the price of land or reduce the amount of land a home occupies to have a big impact on prices.

Three quarters or 3%?

This Herald story improves a lot after the first few paragraphs. But it would have to.

Almost three-quarters of the depressed New Zealanders who have gone to Sir John Kirwan’s website depression.org.nz are no longer depressed after finishing the six lessons the site offers.

The story goes on to say that an evaluation of the website found that only 3% of the first 13000 people who registered ended up finishing the six lessons.

Public health officials say the result makes the website, and the $5 million-a-year advertising campaign around it, one of the New Zealand’s most successful public health campaigns.

Based on the 3% figure applied to the current 40000 registrants that doesn’t sound at all plausible: the relevant figure would have to be the 26% who completed at least two lessons, 48% of whom were no longer depressed. That comes to about 5000 people out of 40000. They estimate that 10-15% would have recovered without any intervention, or about 5000 out of 40000.  So, any evidence of public-health benefit needs some information about how representative the 26% were: if they included everyone who was going to recover anyway, there’s no benefit; if they were completely representative, there’s a big benefit. Both extremes are pretty unlikely, but we can’t tell any more from the information in the story.

The evaluation report may have more detail that really does show this website has been effective, but the report doesn’t seem to be public (yet).


[Update: I hadn’t noticed that this had also been nominated for Stat of the Week, with much the same arguments.]

Briefly

And these three men, Noah, Daniel, and Job were in it, and all the abominations that be done in (log n) steps.

December 10, 2013

It’s all in the definition

The most-read story on the NZ Herald right now is “Cost of home dream in Auckland – 19 incomes“. Only six months ago, the NZ Herald published an infographic which showed that a median house costs 6.9 times the annual median household income in Auckland. It’s enough to make anyone confused.

The new article says:

“It would take 19 median incomes in Auckland to buy a home for the city’s median house price.

In the 1,119,195 Census forms filled out for Auckland, the median annual income was $29,600, a Herald analysis found.”

I checked with the Stats NZ Census figures (Excel spreadsheet) and found the $29,600 figure is for the usually resident population count aged 15 years and over. In other words, this includes everyone who is not in paid employment: all the students, retirees, parents who are staying at home, those on benefits and not working etc.

Using Statistics New Zealand’s income survey data for the June 2013 quarter (Excel spreadsheet), the median earnings for people in paid employment was $45,864. This figure is only from those earning wages and salaries and/or self-employment income.

Strictly speaking, the median house price we’re comparing to should be for the same period but for now, I’m using the June 2013 median Auckland house price from the Real Estate Institute (PDF): $555,000.

This means the statement could be revised to:

“It would take 12 median incomes in Auckland to buy a home for the city’s median house price.”

However, this misses the point that the accepted method is to look at median household incomes. Statistics New Zealand recommends a more complex calculation:

The ratio of housing cost to income is often used as a way of measuring affordability. Here, the ratio is calculated as housing cost as a proportion of disposable household income (income after tax). A housing cost to income ratio of 25 percent has been used as a threshold for the purpose of comparing groups. This threshold is widely used both nationally and internationally.

Again, using Statistics New Zealand’s income survey data for the June 2013 quarter, the median household income was $70,616 for the Auckland region (NZ.STAT tool).

This means the statement could be revised to:

“It would take 7.9 median household incomes in Auckland to buy a home for the city’s median house price.”

Comparing simple figures from New Zealand with overseas without taking into consideration tax and the cost of living really isn’t meaningful. Further, the mixing of means and medians means that they are not comparing like with like…

It’s easy to use figures to make things seem much worse than they actually are.
December 9, 2013

Stat of the Week Competition: December 7 – 13 2013

Each week, we would like to invite readers of Stats Chat to submit nominations for our Stat of the Week competition and be in with the chance to win an iTunes voucher.

Here’s how it works:

  • Anyone may add a comment on this post to nominate their Stat of the Week candidate before midday Friday December 13 2013.
  • Statistics can be bad, exemplary or fascinating.
  • The statistic must be in the NZ media during the period of December 7 – 13 2013 inclusive.
  • Quote the statistic, when and where it was published and tell us why it should be our Stat of the Week.

Next Monday at midday we’ll announce the winner of this week’s Stat of the Week competition, and start a new one.

(more…)

Muphry’s Law

Muphry’s Law says that any attempt to criticise editing or proofreading will contain editing or proofreading errors. It clearly extends to criticising educational standards:

The biggest fall in NZ’s rankings was in mathematics, from 13th to 23rd (though we also fell from 7th to 18th in science and from seventh to 13th in reading).

(via @economissive)

Inequality in NZ

Nick Iversen nominated the Herald’s story on increasing inequality as Stat of the Week, on the grounds that it didn’t have any data showing increasing inequality. That’s slightly unfair — the increase in high incomes is not explainable by inflation — but it’s certainly true that the conclusion was pretty weakly supported by the numbers.

Firstly, any comparison of money in 2006 to money in 2013 that’s not inflation-adjusted in some way is pretty pointless. The CPI went up 19% over that period.

Secondly, minimum wages are pretty obviously relevant. At the last Census, the minimum wage was $9.50; at this Census it was $13.50, a nominal increase of 42% and a real increase of  19%.

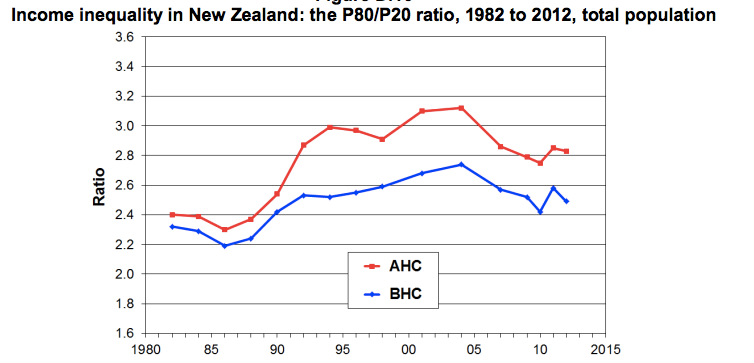
Thirdly, there are established ways to measure income inequality, and while they aren’t perfect, they are better than trying to reinvent the wheel.  From an Inequality Forum earlier this year,  we can find some summaries based on survey data (PDF) of the ratio of the 80th to 20th percentile of income, and the Gini index.  Here’s the 80:20 ratio, with the blue line for income before subtracting housing costs and the red line for income after subtracting housing costs. Both have gone down since 2006, though up since the 1980s, and housing costs are clearly a fair chunk of the inequality problem.

r8020


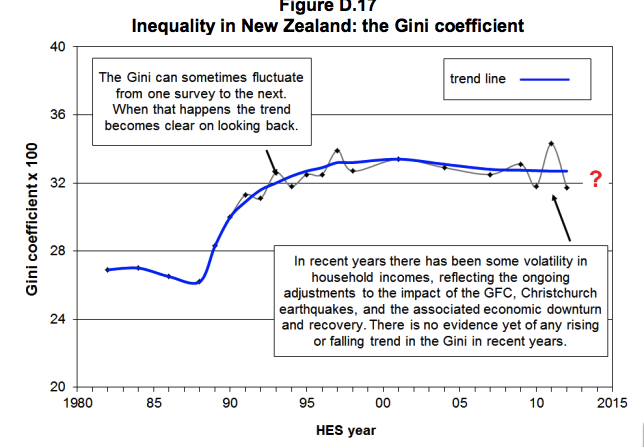
The Gini index is a more complicated summary of inequality that uses all the data, not just two percentiles. It’s popular for comparing between times and between countries.  The Gini index for raw income (before taxes and benefits) has stayed fairly stable in NZ recently.

gini


The Gini index for income after taxes and benefits will have increased, but probably not by a lot.

So, inequality in NZ is substantially higher than it used to be, and there are a lot of reasons to think this is bad, but the increase was in the 1980s and 1990s, not since 2006.  And this information is not hard to find.

December 6, 2013

If New Zealand were a village of 100 people ….

… according to the 2013 Census figures,

  • 51 would be female, 49 male.
  • 70 would be European, 14 Maori and 11 Asian.
  • 24 would have been born overseas
  • 21 would have a tertiary qualification
  • 4 would be unemployed.
  • 4 would earn over $100,000

Statistics New Zealand has done a nice graphic of the above, too. Full 2013 Census info available here.


Reports about young women and binge-drinking: a caution

Local media have been proclaiming that younger women are binge-drinking themselves into oblivion, (examples here and here),  many of these stories leaning on Canadian journalist and recovering alcoholic Ann Dowsett Johnston’s book Drink: The Intimate Relationship Between Women and Alcohol.  She says the percentage of college students who binge drink, using the measure of consuming five or more drinks in one sitting, was nearly 45% in 2011, and repeated this in a recent Wall Street Journal item called The New Face of Risky Drinking is Female.

However, there is an editor’s note at the bottom of her piece (that probably should be at the top), pointing out that Johnston got her compelling  figure by combining the results  of two separate studies carried out in different years.

The  non-profit, non-partisan Statistical Assessment Service (STATS) in the US points out that a basic tenet of Statistics 101 is that one should never directly compare survey results that come from different populations or that were provided from surveys taken with different methods, even if the surveys are angling for the same kind of data.  Surveys can return different results for a variety of reasons, from the time of year in which they are administered, to the population from which participants are chosen, and even to how the questions are asked. In this case, it says, both surveys  have systematic biases that come from their survey methods, which in turn makes direct comparisons problematic. See its useful analysis of the situation here.


December 5, 2013

Anybody for a slice of PISA?

There has been significant coverage in the press of New Zealand’s slip in the OECD PISA (Programme for International Student Assessment) rankings for mathematics, reading, and science.
We probably should be concerned.

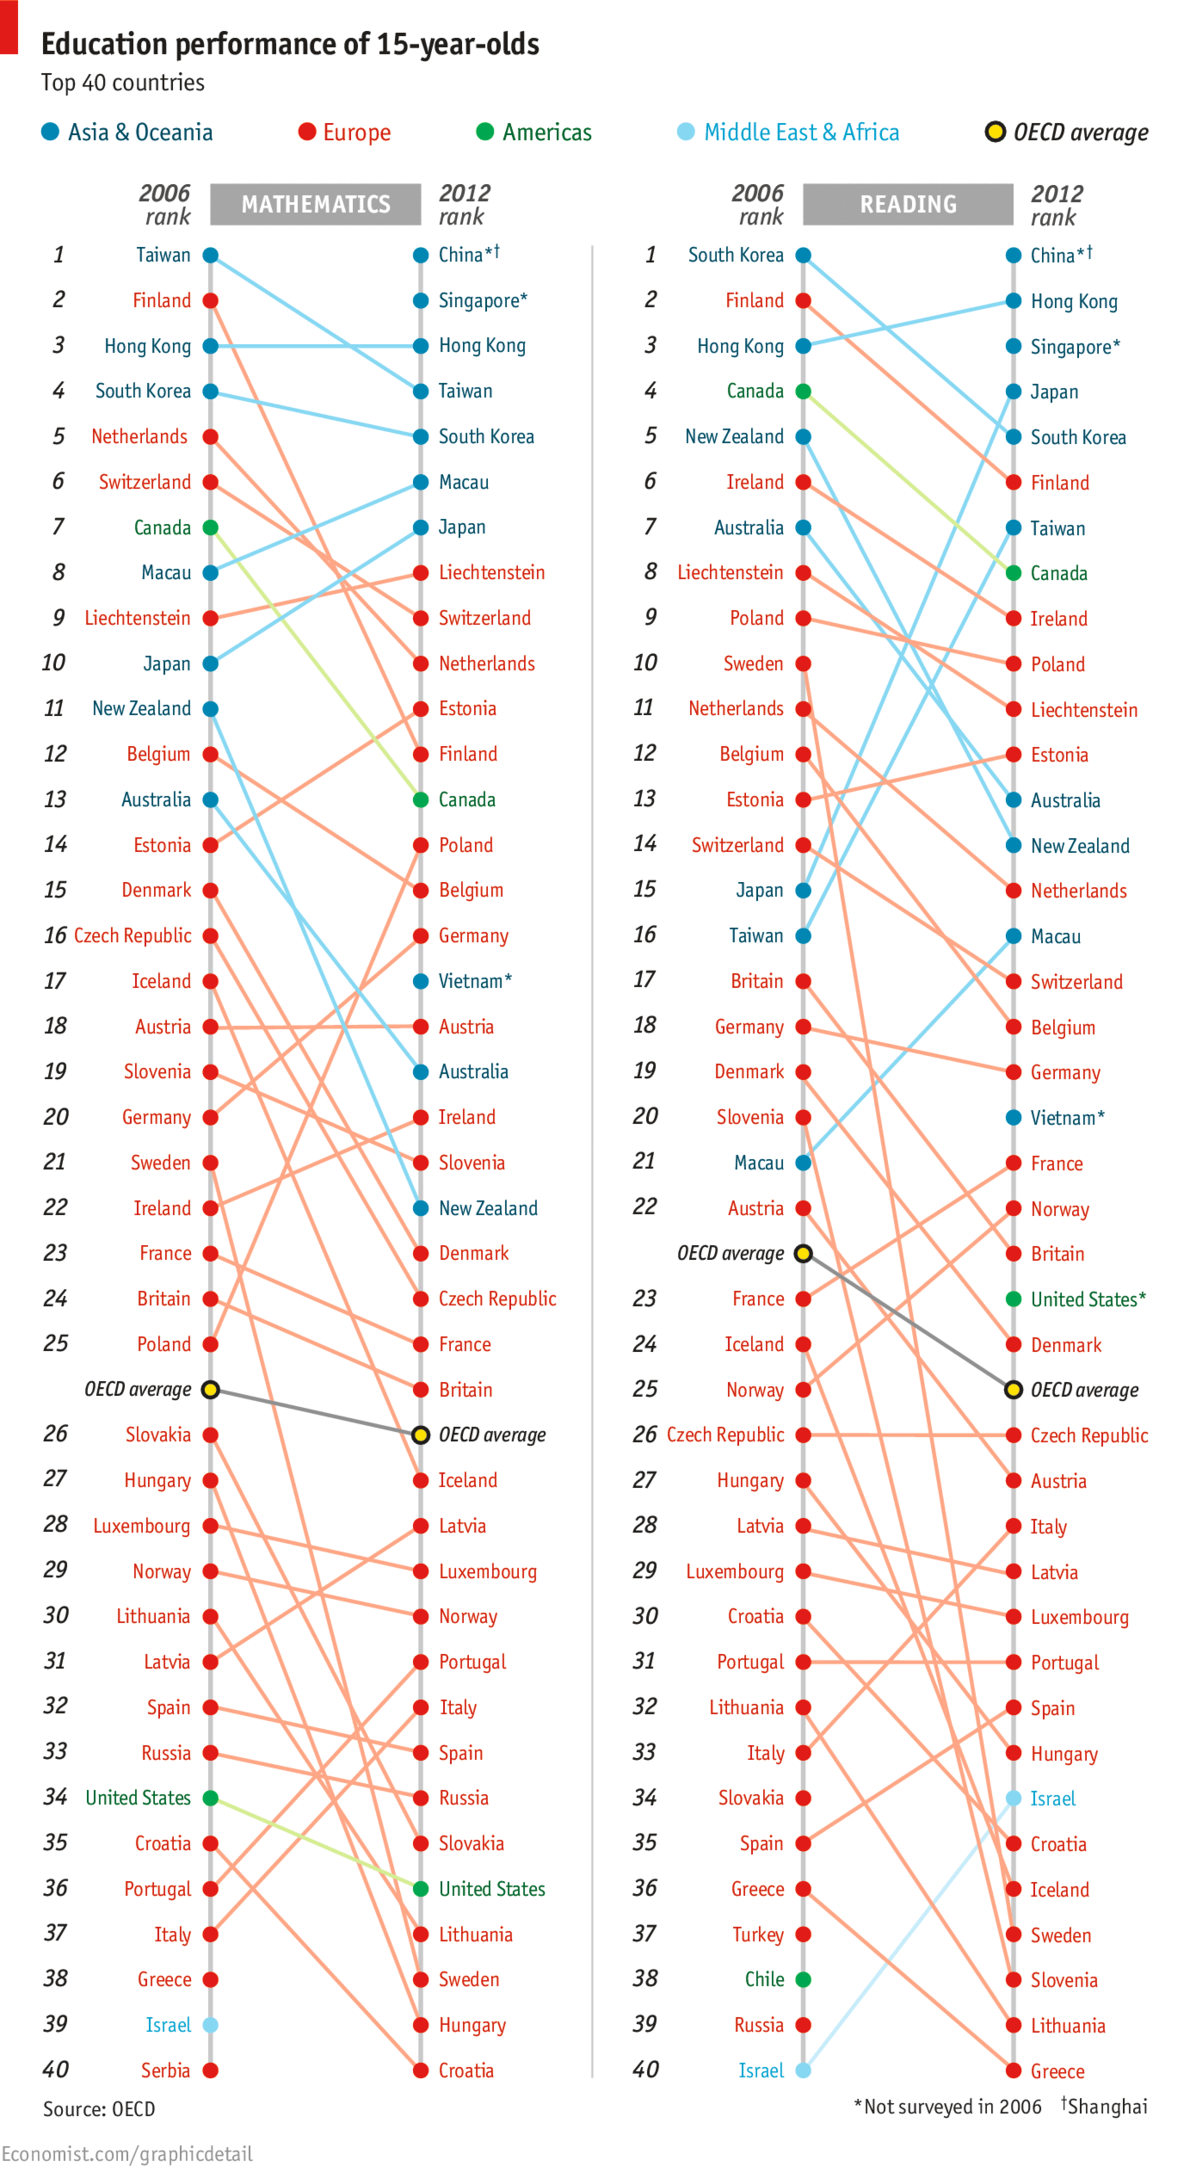
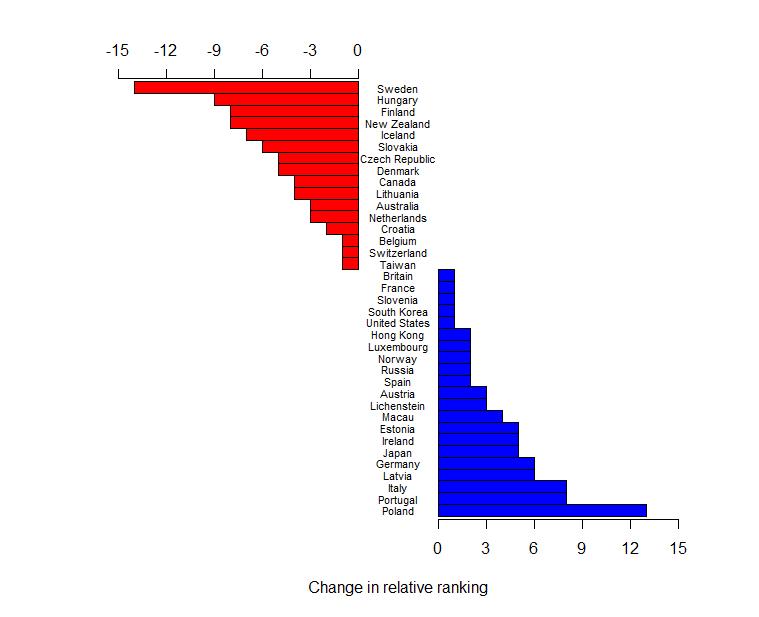
However, today I stumbled across the following chart: OECD PISA Rankings 2006 and 2012 in The Economist. Two things about it struck me. Firstly, part of the change (in the mathematics ranking at least) was driven by the addition of three countries/cities which did not participate in the 2006 round: Shanghai, Singapore, and Vietnam. The insertion of these countries is not enough to explain away New Zealand’s apparent drop, but it does move us from a change of down 11 places to a change of down 8 places. Secondly, I found it really hard to see what was going on in this graph. The colour coding does not help, because it reflects geographic location and the data is not grouped on this variable. Most of the emphasis is probably initially on the current ranking which one can easily see by just reading the right-hand ranked list from The Economist’s graphic. However, relative change is less easily discerned. It seems sensible, to me at least, to have a nice graphic that shows the changes as well. So here it is, again just for the mathematics ranking: Changes in PISA rankings for mathematics.

The raw data (entered by me from the graph) has been re-ranked omitting Greece, Israel, and Serbia who did not participate in 2012, and China, Singapore, and Vietnam, who did not participate in 2006. I am happy to supply the R script to anyone who wants to change the spacing – I have run out of interest.

It is also worth noting that these rankings are done on mean scores of samples of pupils. PISA’s own reports have groups of populations that cannot be declared statistically significantly different (if you like to believe in such tests). This may also change the rankings.

Updates:

Professor Neville Davies, Director of the Royal Statistical Society’s Centre for Statistical Education, and Elliot Lawes, kindly sent me the following links:

Firstly a blog article from the ever-thoughtful Professor David Spiegelhalter: The problems with PISA statistical methods

and secondly, a couple of articles from the Listener, which I believe Julie Middleton has also mentioned in the comments:
Education rankings “flawed” by Catherine Woulfe” and Q&A with Andreas Schieicher also by Catherine Woulfe.